-
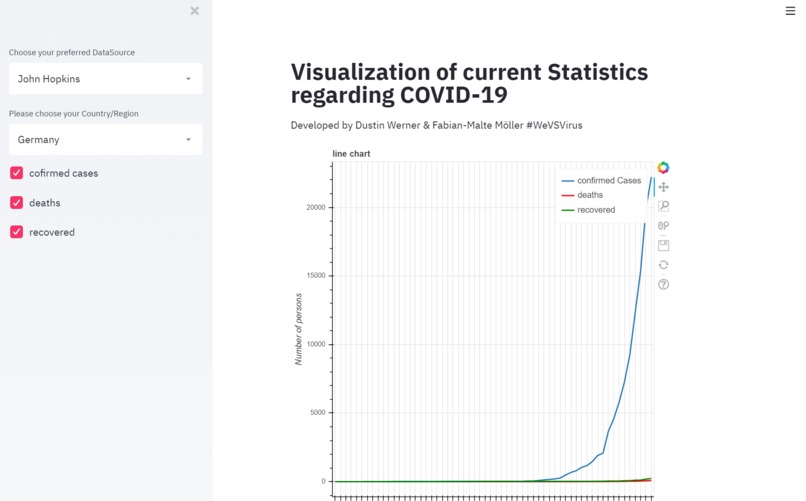
Short overview of the Webapp

We want to make Data visible for people to understand the exponential growth rate of the coronavirus easily!
What it does
Interactive visualization of confirmed cases, deaths and recovered to see the #flattenthecurve graphs.
What's next for 38_Daten_ML-Tool for Statistics
-Comparisation of different data sources -worldwide map ... we want to make all stats we can get to visualize in graphs
How you can try it out currently: -clone the Github repository and run the py. file with this command: 'streamlit run your_path.py'
We want to Upload it as Website in the future!


Log in or sign up for Devpost to join the conversation.