-
-
demo
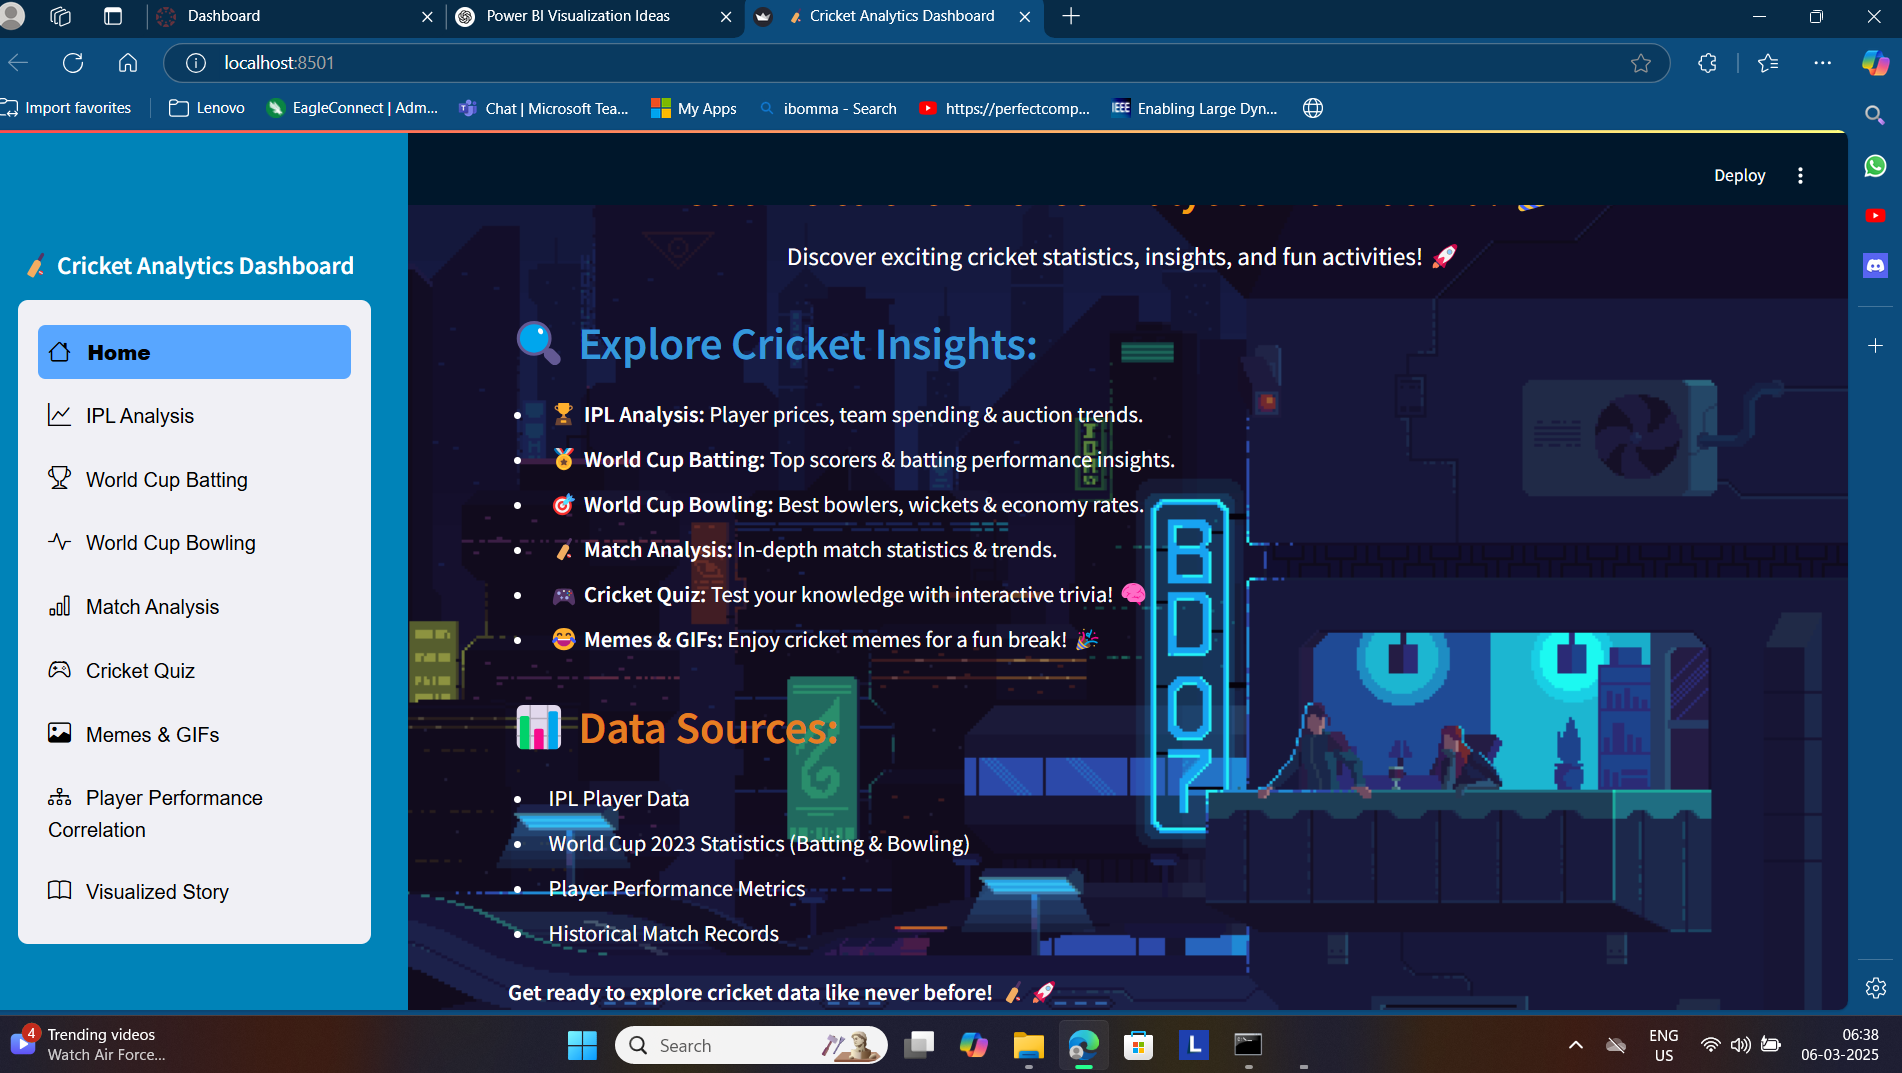
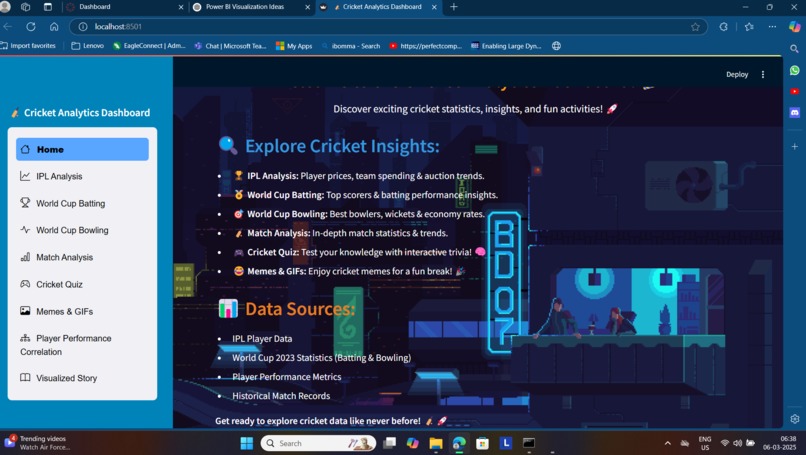
Inspiration As passionate cricket fans and data enthusiasts, we noticed that while cricket generates massive volumes of data—from IPL auctions to World Cup performances—there’s no single, user-friendly platform to explore these insights interactively. We were inspired to bridge this gap and make cricket data accessible and exciting for fans, analysts, and even casual viewers using an intuitive web interface. How We Built It We built the Cricket Analytics Dashboard using:
Streamlit for a fast and interactive web interface.
Pandas for data manipulation and cleaning.
Plotly for beautiful, interactive charts and visualizations.
A variety of CSV datasets covering IPL auction data, player stats, and World Cup performance metrics.
The app features different tabs for IPL analysis, batting and bowling breakdowns, and historical match analytics. We also added a customizable theme, a sidebar for filtering, and download options for raw data.
What We Learned How to structure multi-page Streamlit apps for modular analytics.
Effective use of Plotly for engaging and responsive data visualizations.
Streamlit theming and configuration with config.toml.
The importance of clean, consistent data preprocessing to ensure accurate visual outputs.
How to create a smooth user experience by integrating interactive widgets and filters.

Log in or sign up for Devpost to join the conversation.