-
-

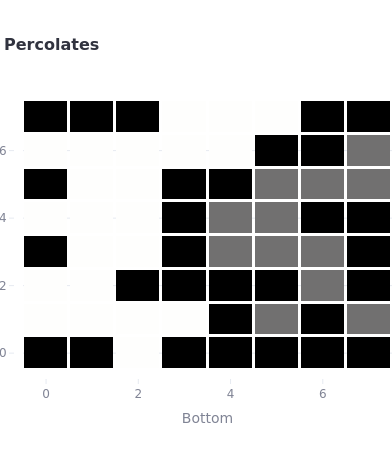
A system with 8-by-8 grid that is percolated
-
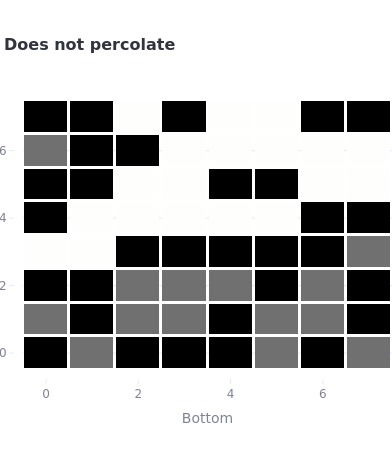
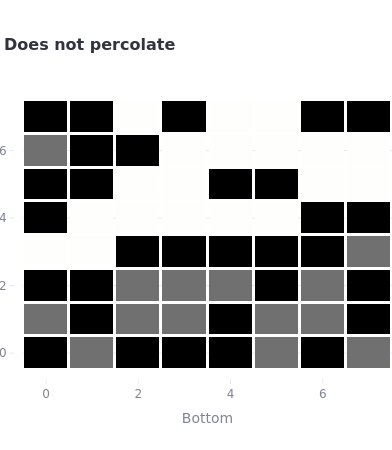
A system with 8-by-8 grid that is not percolated
-
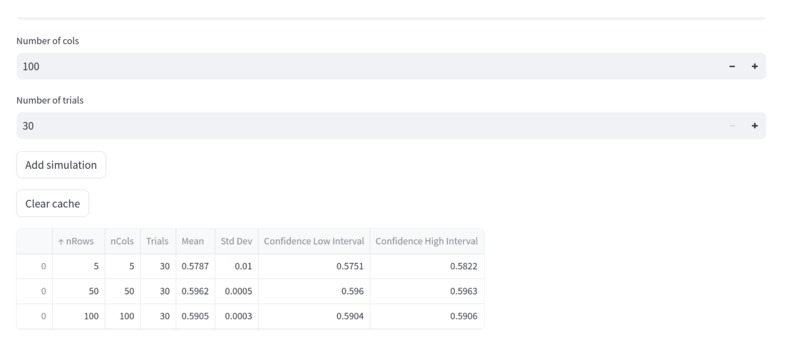
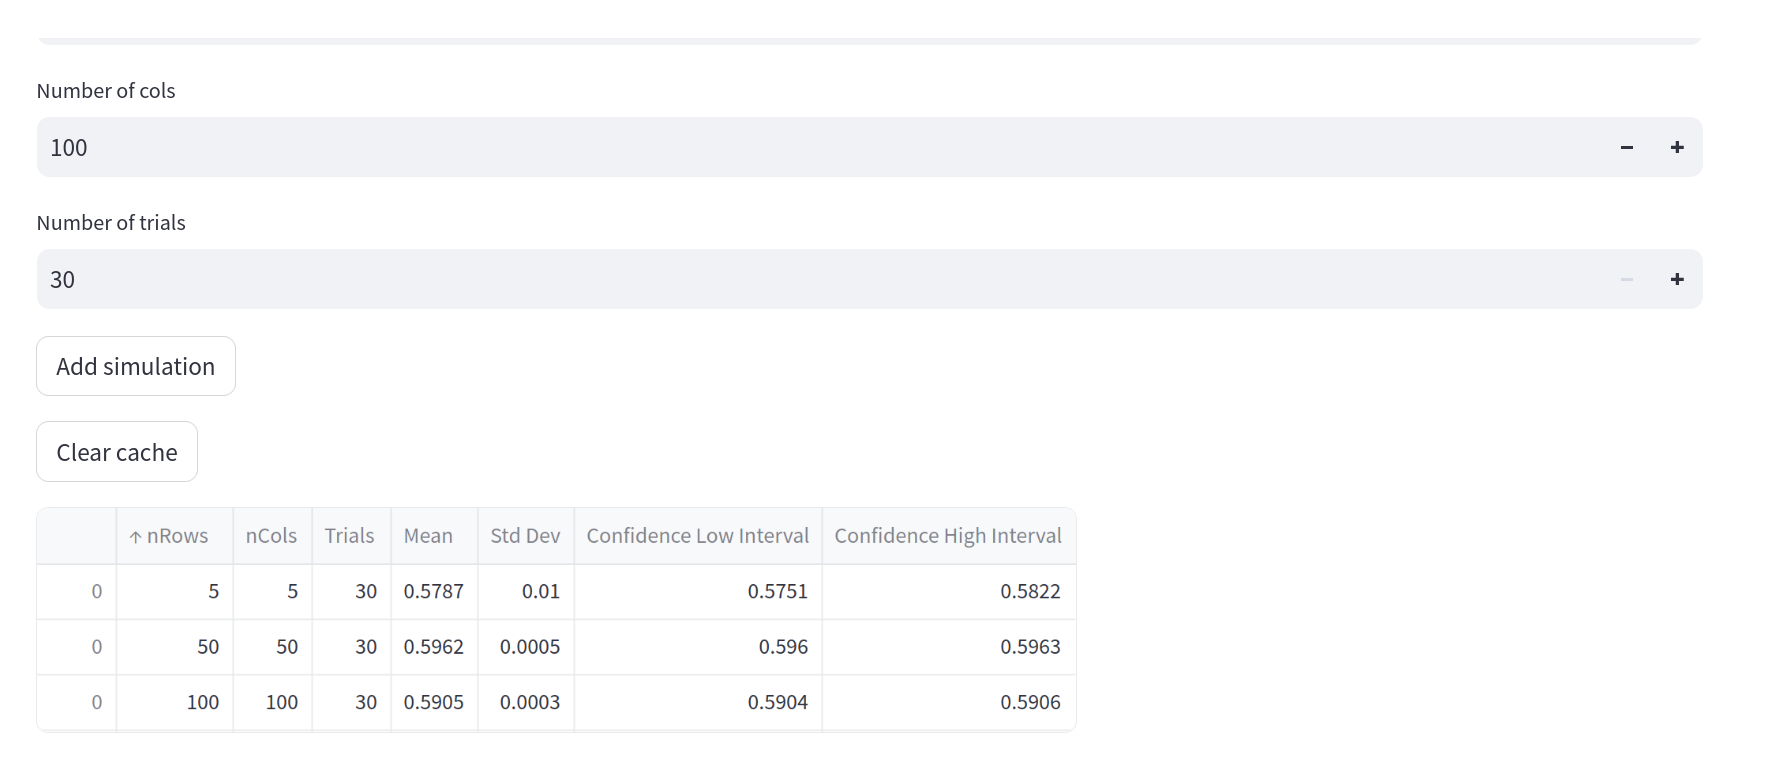
Results of simulations ran with different parameters
Inspiration
Here is my submission for MLH's month long hackathon. I got the inspiration from the Percolation assignment in Coursera's Algorithms 1 course from Princeton. I took advantage of the implementations of quick union , weighted quick union, and weighted quick union with path compression .
What it does
Some systems from the test files are visualized and used to test the quick union implementations, which are used in the connectivity between points in the system. The test files are downloaded from the link.
Apart from the visualization, it shows how the percolation threshold converges with increasing number of rows, columns and statistical experiments. As a new simulation is added, it is tabulated in the same table to make a comparison of their standard deviations, means and confidence intervals.
How we built it
I built the app with Streamlit. I deployed in Streamlit community cloud. First of all, I implemented quick union, weighted quick union and weighted quick union with path compression while following an object-oriented design. On the top of that, I implemented the classes for percolation using the given quick union algorithm and the for statistical trials.
Challenges we ran into
The one of the challenges I faced is to figure out how to calculate the full sites (white pixels in the attachment) in the system. I tried to set up an automated test pipeline to make sure my implementations are correctly done. This was another challenge. I wanted to tabulate all simulations ran in a session to compare the results of each run. I had to search a bit to put all of them in one table.
Accomplishments that we're proud of
I could manage to implement all the way from the algorithms to the Streamlit app. This is what I am proud of. I hope this will inspire a lot of people to visualize seemingly complicated algorithms and computations, either while teaching or learning.
What we learned
While building this app, I learned quick union data structure, how to optimize quick-union algorithm, the application of this algorithm to the problems related to dynamic connectivity, and some statistics.
What's next for Streamlit App for Estimation of the Percolation Threshold
I am enthusiastic about discovering ways to accelerate the simulation. I would appreciate any contribution for this.
Built With
- python
- streamlit

Log in or sign up for Devpost to join the conversation.