-
-
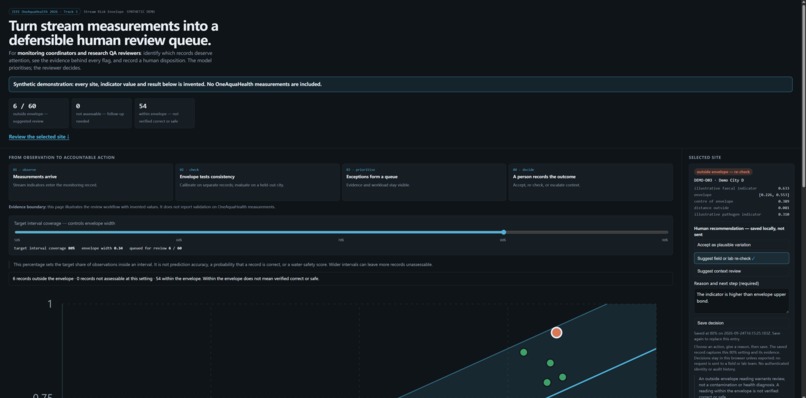
Synthetic demo at the 80% operating point: 6 of 60 records queued for review, with the evidence behind the selected record.
Inspiration
Stream-monitoring coordinators and research QA reviewers have limited time to investigate inconsistent records. We wanted to help decide which records deserve a second look — and to be explicit when the evidence cannot support a judgement at all.
We developed the method using OneAquaHealth Resilience Map data in a private repository. Our initial landscape-context model failed to beat a mean baseline when cities were held out. We kept that negative result rather than tuning around it, and narrowed the task to a question the data could actually answer: do the faecal and pathogen indicators in the same record follow their observed cohort co-variation?
We do not infer the antibiotic-resistance indicator from those two. The possibility of shared upstream measurement inputs remains unresolved, so this is a consistency check — not an independent validation of either indicator.
What it does
A standardised ridge model predicts one indicator from the other. Split conformal calibration forms an interval using a separate calibration split.
- Outside the interval — the record enters a ranked human review queue. The reviewer sees the observed value, the expected envelope, and the distance outside it.
- Interval too wide to judge — the record appears in a separate "needs further assessment" queue. It is not automatically cleared.
- Inside the interval — consistent with how the cohort behaves.
A control shows how the nominal level changes interval width and review workload. The reviewer can accept plausible variation, suggest a field or lab re-check, or escalate context — but must provide a reason and explicitly save. Each saved decision captures its operating point and the evidence visible at the time, and can be exported as a CSV handoff.
Decisions persist locally unless exported. No request is sent to any field or laboratory team — the coordinator must arrange it.
How we built it
Python, scikit-learn, pandas and NumPy implement the data access pattern, model, leave-one-city-out evaluation and split conformal logic. HTML, CSS, SVG and JavaScript provide the offline interactive demonstration — no build step, no framework, and no network request of any kind.
The public repository includes the model code, a deterministic synthetic fixture, tests, method notes and an accessible site table. Its acceptance checks regenerate the fixture and rehearse the browser path without network calls. These checks verify the public synthetic demonstration, not the private real-data benchmark.
Evidence from the private retrospective analysis
The method was evaluated on 96 actual OneAquaHealth Resilience Map records across five cities, holding out each city in turn. At the default 80% nominal operating point, the private evaluation recorded 82% empirical coverage and 17 of 96 records queued for review. The fitted model beat a mean-prediction baseline in each of the five held-out cities.
These are aggregate retrospective results from the private analysis, not numbers generated by the public demo. They assess consistency-screening behaviour and workload. The data do not establish that flagged records were erroneous, that reviewer time was saved, or that ecosystem or human-health outcomes improved. The private snapshot and its Git history are not public, so the actual-data evaluation cannot be reproduced from this public repository alone.
Public demo and data boundary
Every site code, city, observation, plot, flag and performance number shown in the public interface is independently generated synthetic data. The video shows only this synthetic interface, and discusses the separate private evaluation using aggregate results. None of the plotted values is an actual OneAquaHealth measurement or a transformed copy of one.
A OneAquaHealth representative confirmed in writing that actual Resilience Map data should not be extracted and republished as a dataset in a separate application or public repository, and directed the public hackathon repository to contain code, methodology, derived logic and a clearly labelled synthetic demo payload. We followed that direction with a new public repository and Git history. No actual site-level data or derived snapshot is redistributed.
Challenges we ran into
The first hypothesis failed. We tried predicting stream risk from urban landscape and weather context, and under leave-one-city-out it lost to predicting the average. We reported that and changed the mechanism, rather than adjusting the validation protocol until the numbers looked better. The negative result stays in the repository, with a test that fails if it ever quietly stops being true.
What we learned
Preliminary usability feedback relayed by the project author highlighted that an empty exception queue could overshadow unassessable records, that coverage percentages could be mistaken for accuracy, and that request wording could imply delivery. We responded by showing all three outcome counts together, explaining target coverage next to the control, moving observed coverage into method details, and labelling follow-ups as local recommendations.
These changes have not yet been retested with that participant. No task-success rate, time saving or field effectiveness is claimed.
Limits and what's next
- The real analysis is a single-season retrospective cross-section — not a forecast or a field trial.
- A flag is a prompt to review co-variation, not a finding of measurement error, contamination or human-health risk.
- Standard conformal coverage requires exchangeability between calibration and test records. Cross-city distribution shift can violate that assumption, and marginal coverage would not ensure equal coverage within each city even when the assumptions hold.
- Observed interval coverage is not error-detection accuracy.
- The prototype exports editable follow-up records, but has no authenticated reviewer identity and no audit history.
A pilot would require permissioned data access, repeated local observations, city-specific calibration where possible, a responsible review team, and measurement of review time and re-check yield against a manual baseline.
Built With
- conformal-prediction
- css
- html
- javascript
- numpy
- pandas
- python
- scikit-learn
- svg


Log in or sign up for Devpost to join the conversation.