-
-
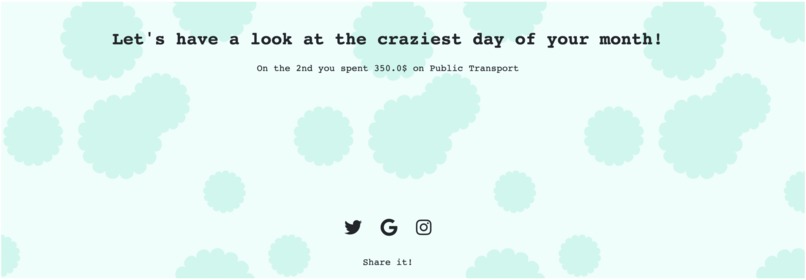
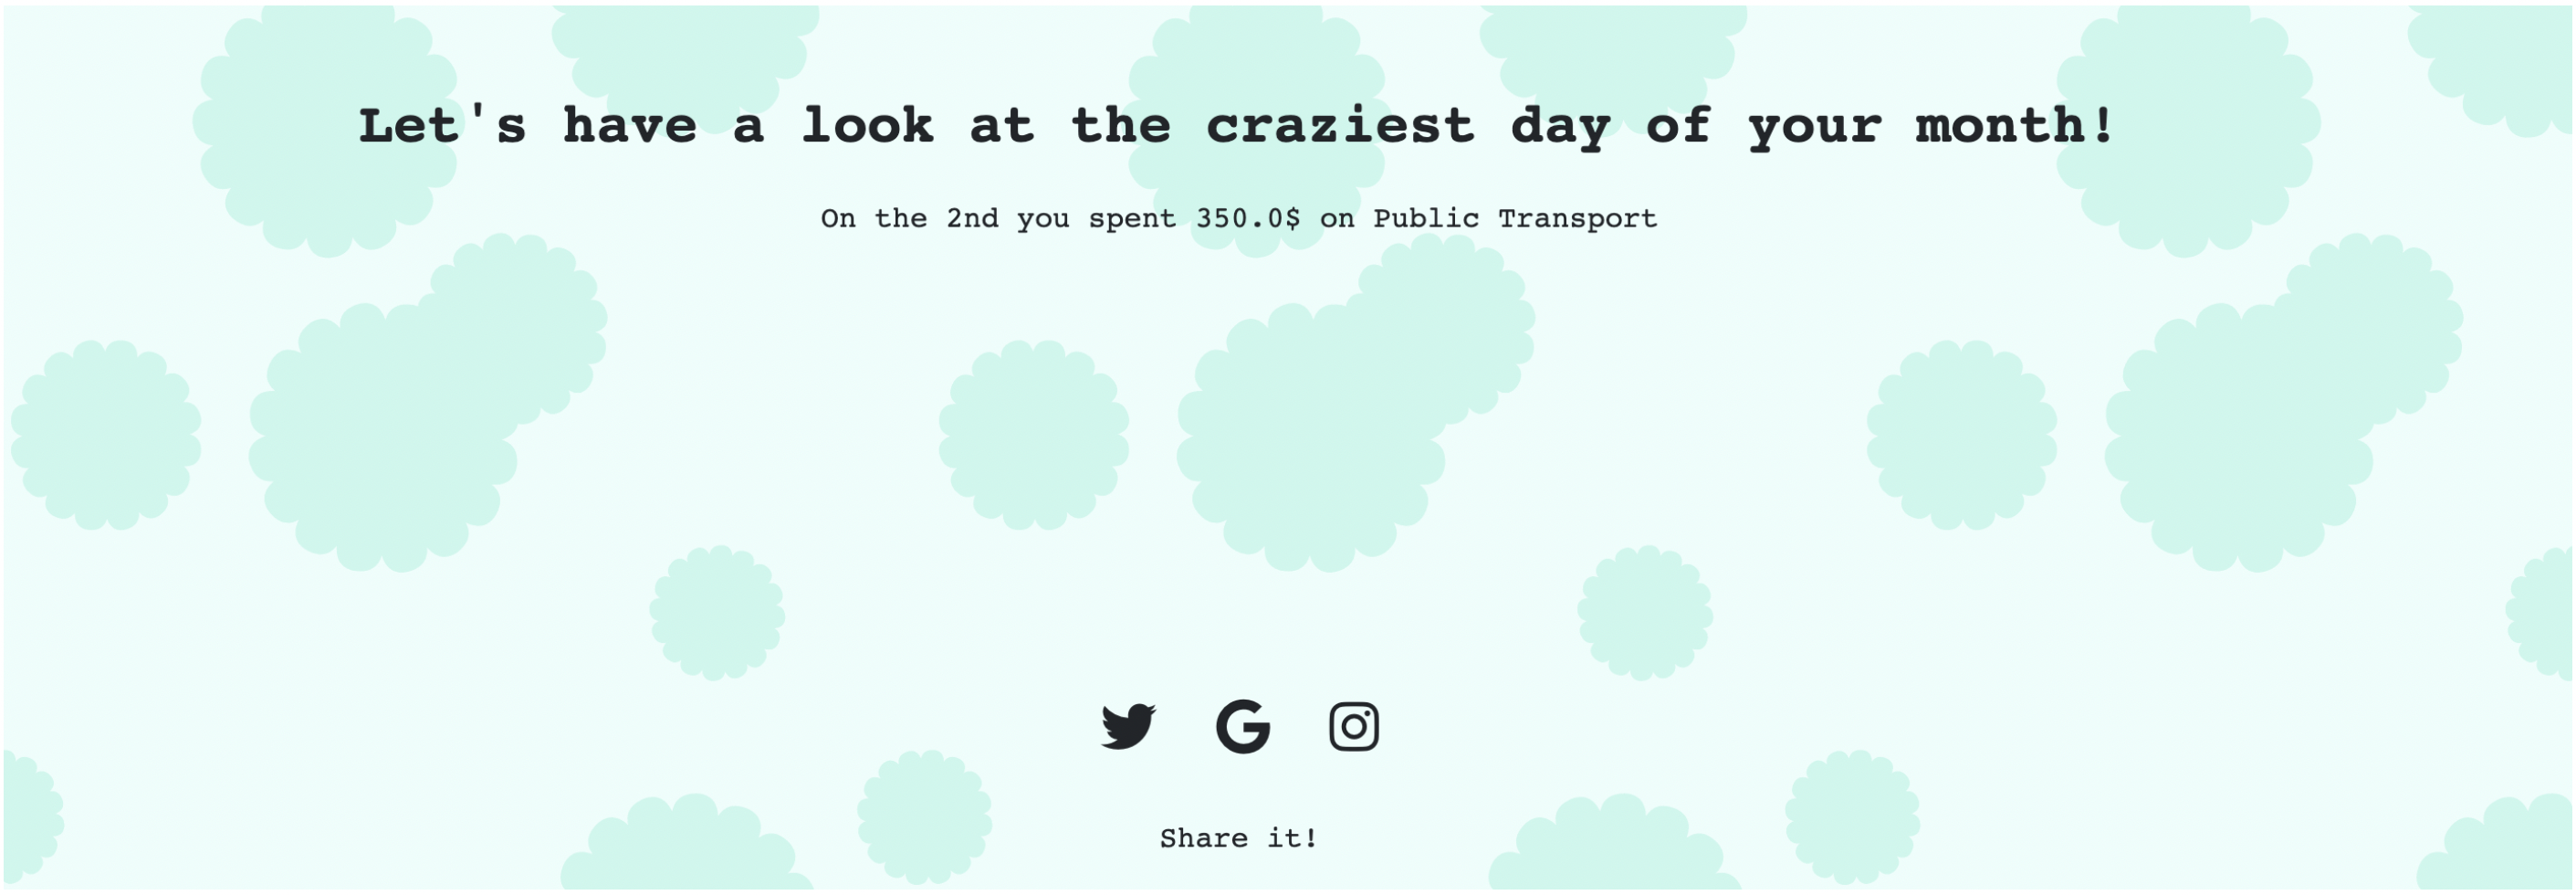
Initial Outlook of the GUI
Inspiration
Aiming to attract younger generation users, the idea of creating a general insight into financial movements, with a fun and creative touch, emerged. We were highly inspired by Spotify's viral marketing campaign "Spotify Wrapped", which allows users to see a compilation of the data about their platform activity. It had a huge impact since all users were sharing it via social media, and it attracted a lot of young users. We firmly believed that this would be a perfect concept since young users usually don't bother to use bank applications, and this would encourage them to keep track of their expenses and also share it with potential new clients.
What it does
StrandStats is a graphical user interface that displays information about a client's monthly financial movements, including income and expenses, and highlights the client's most expensive days. In addition, StrandStats offers a sustainability aspect by providing information about the client's carbon footprint in comparison to other users in their area. To add a touch of humor, StrandStats also includes information about impulsive midnight purchases that the user may have made, something that would attract younger generations and encourage them to share it on social media.
How we built it
We utilized an API to extract information about transactions, users, products, and carbon footprint emissions. Using Python, we combined the data and information to obtain the desired statistics. We created a .py file that returns all the information that needs to be displayed, and this data can be viewed on the GUI. We incorporated two invisible buttons to navigate through the statistic slides.
Challenges we ran into
As a team, we encountered challenges with APIs and front-end techniques. However, with the help of online resources, mentors, and sponsor support, we were able to overcome these challenges and deliver our project as expected.
Accomplishments that we're proud of
We are really proud of how we improved our ability for autonomous learning and team collaboration. We were able to help each other get through the issues we were experiencing, and we can say that the team dynamic was amazing.
What we learned
We learned how to turn an idea into a tangible project. This was our first time building something from scratch, and the process of taking our initial ideas and translating them into a functional front-end and back-end was a valuable learning experience. Additionally, we learned to not be afraid to ask for help and seek mentorship. Our interactions with sponsors, mentors, and other teams were helpful and supportive. We were nervous about seeking help because we thought we were supposed to have all this previous knowledge. But, eventually, we felt really comfortable speaking to the sponsors, mentors, and other teams. They were really helpful and really kind about it, which we highly appreciated.
What's next for StrandStats
Our hope is to continue developing StrandStats with more data to create a more comprehensive and enjoyable financial insight tool. Our original goal was to showcase the potential of our idea, which we believe we've successfully accomplished.

Log in or sign up for Devpost to join the conversation.