-
-
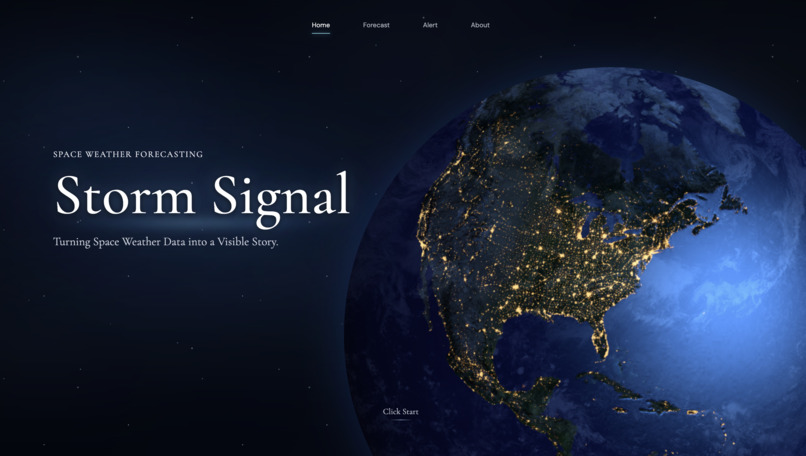
Home
-
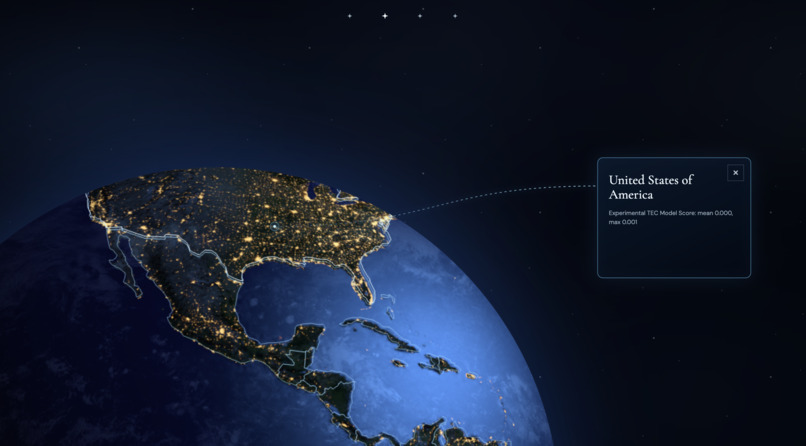
Simple Check
-
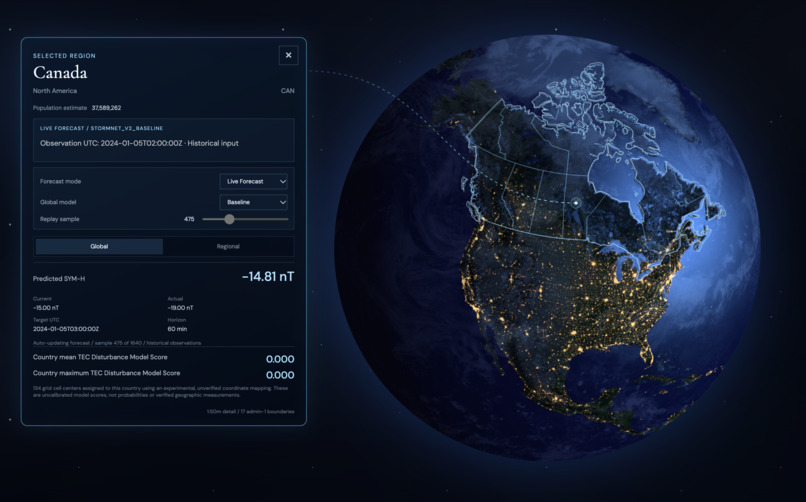
Details Information
-
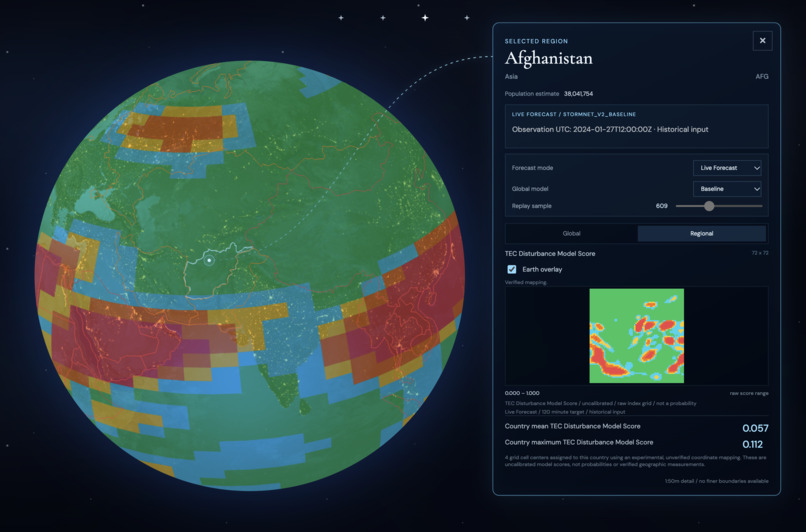
Heat Map
-
Alert
-
Regional Display
-
About
-
Poster
Inspiration
Our inspiration came from exploring a large amount of NASA space weather data. When we learned that geomagnetic storms could affect power grids and communication systems, we realized that these events might also affect people's daily lives.
This inspired us to combine NASA data with other publicly available datasets to build an interactive website that uses AI to predict geomagnetic storms and show their potential effects in different regions around the world. We hope our project can help people better understand the changes happening in space and how they may affect life on Earth.
What it does
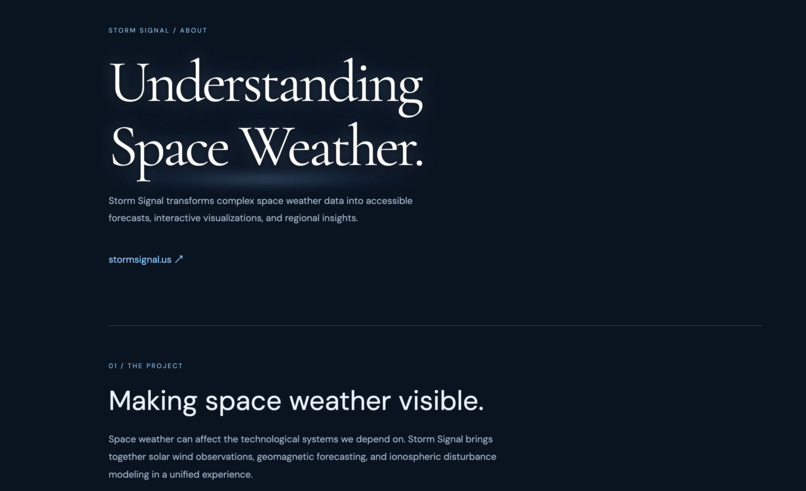
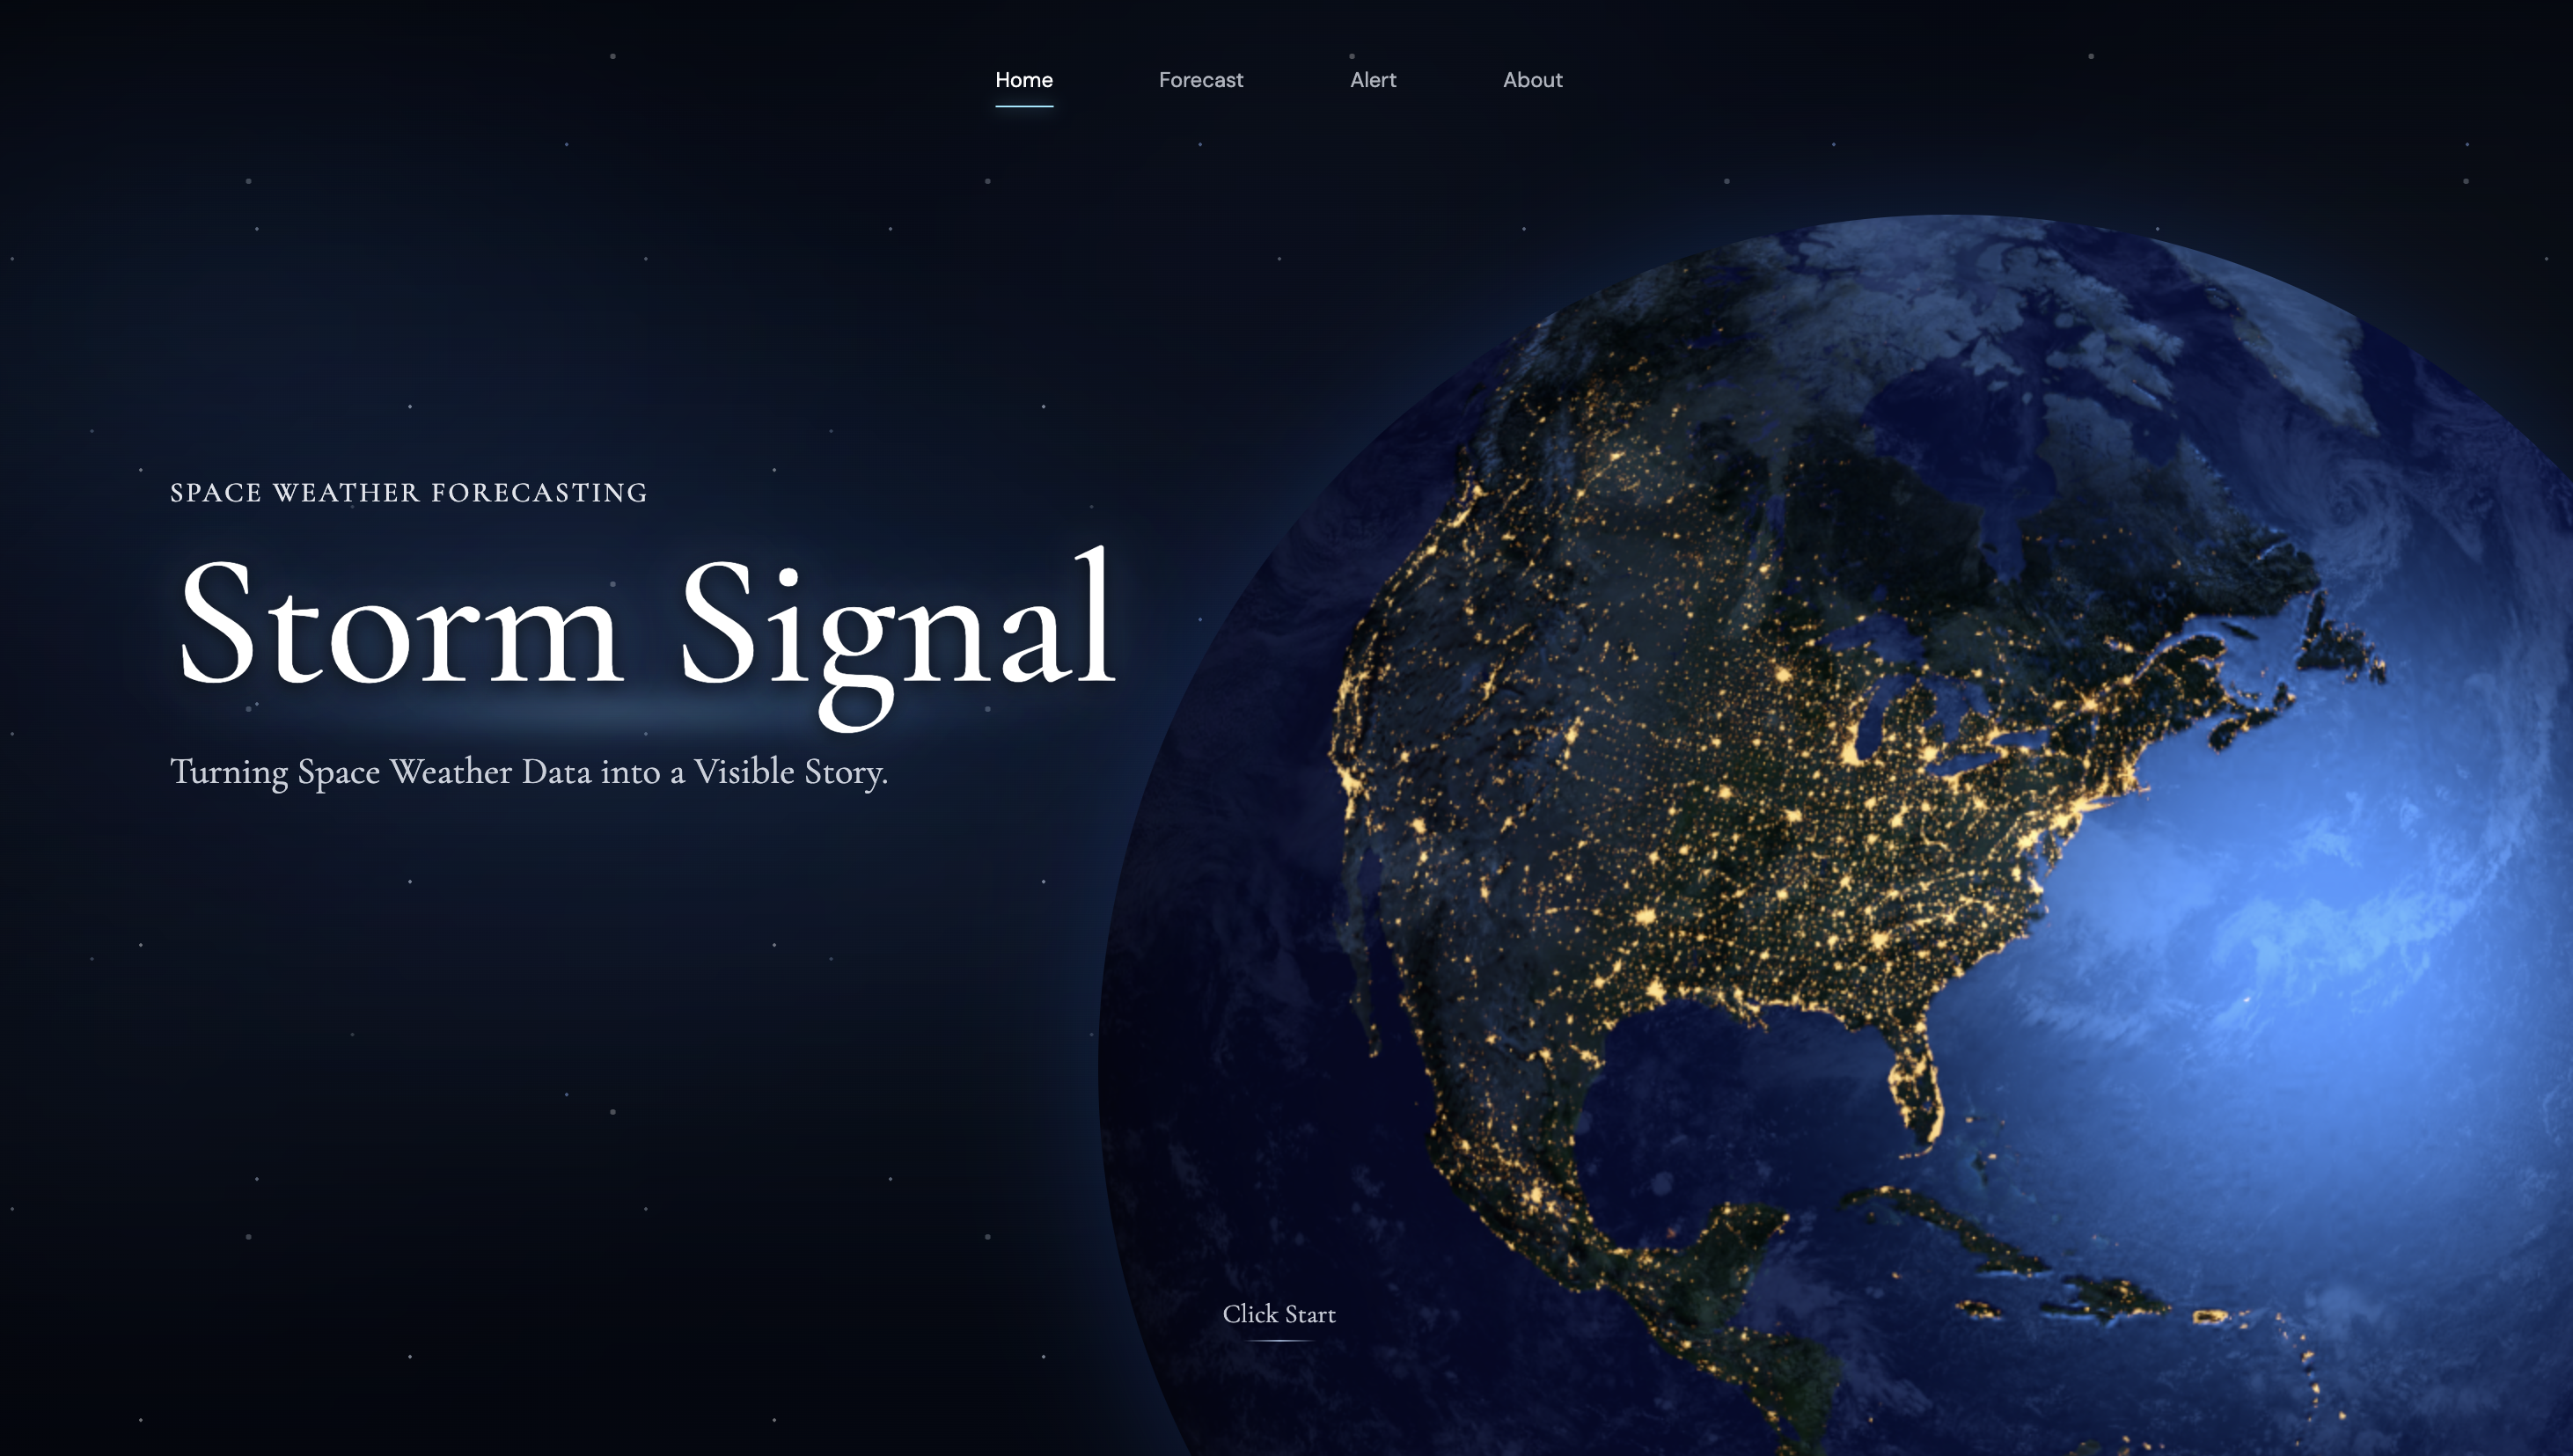
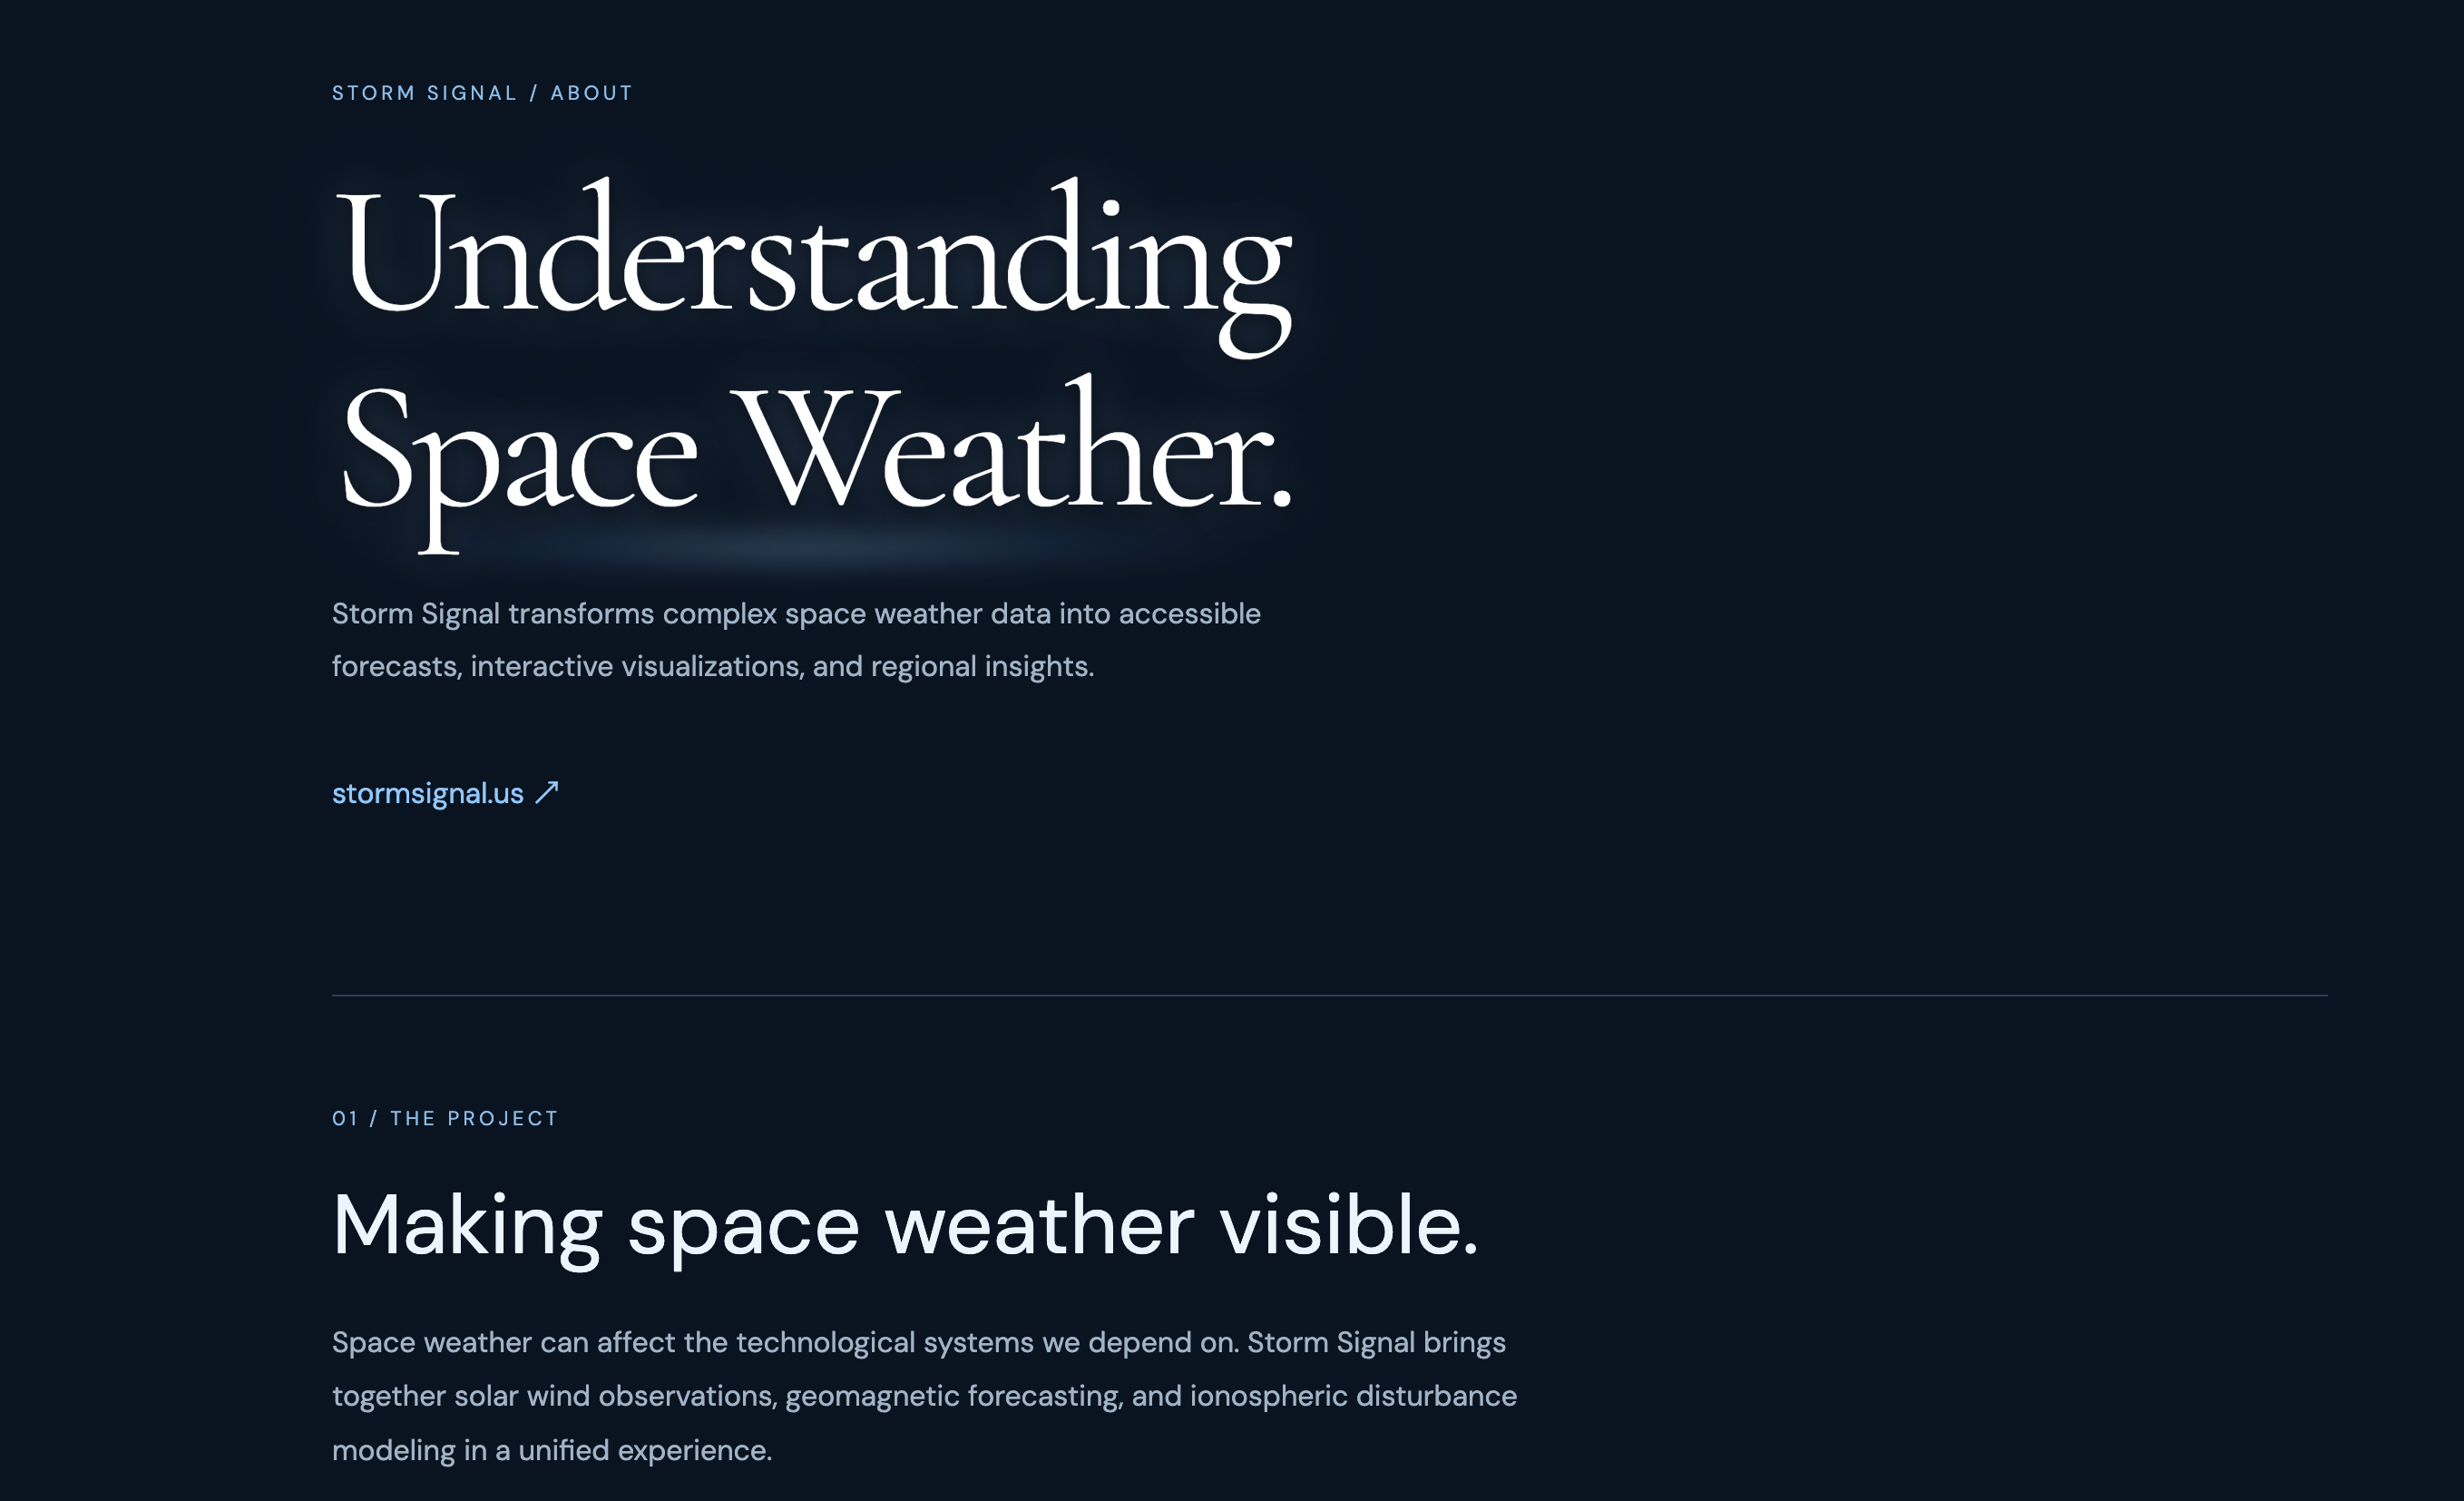
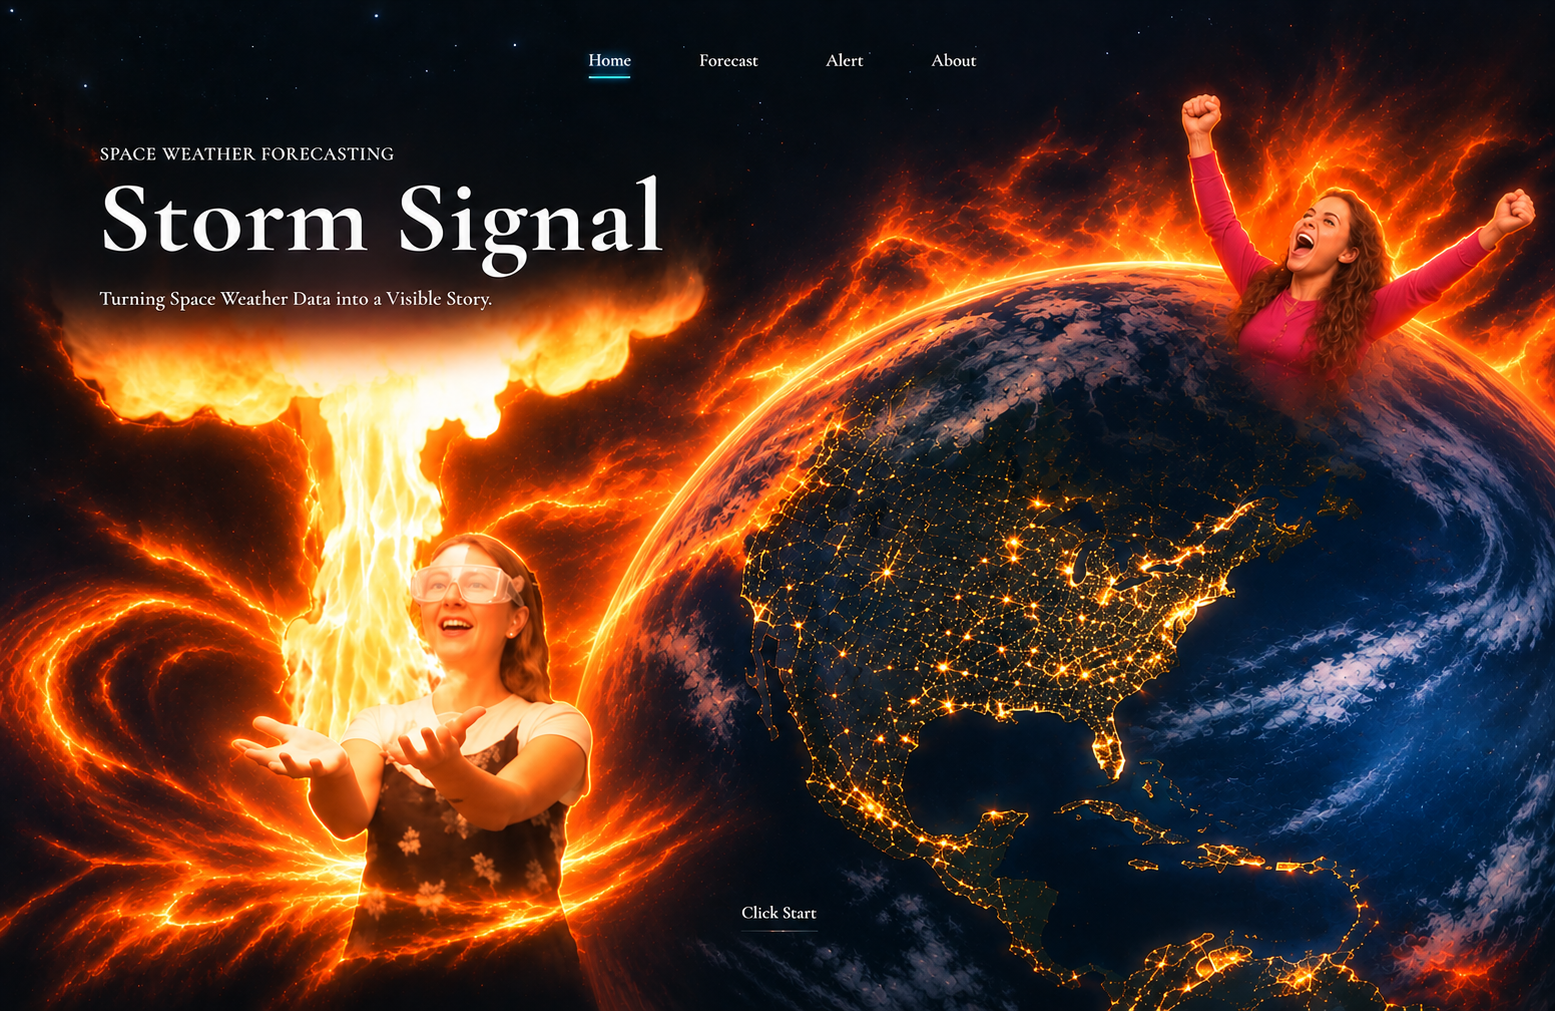
Storm Signal is an AI-powered website designed to predict geomagnetic storms and show which areas on Earth may be affected.
By training three AI models using real space weather data, we aim to predict storm intensity, analyze changes in Earth's ionosphere, and identify areas with a higher risk of disruption.
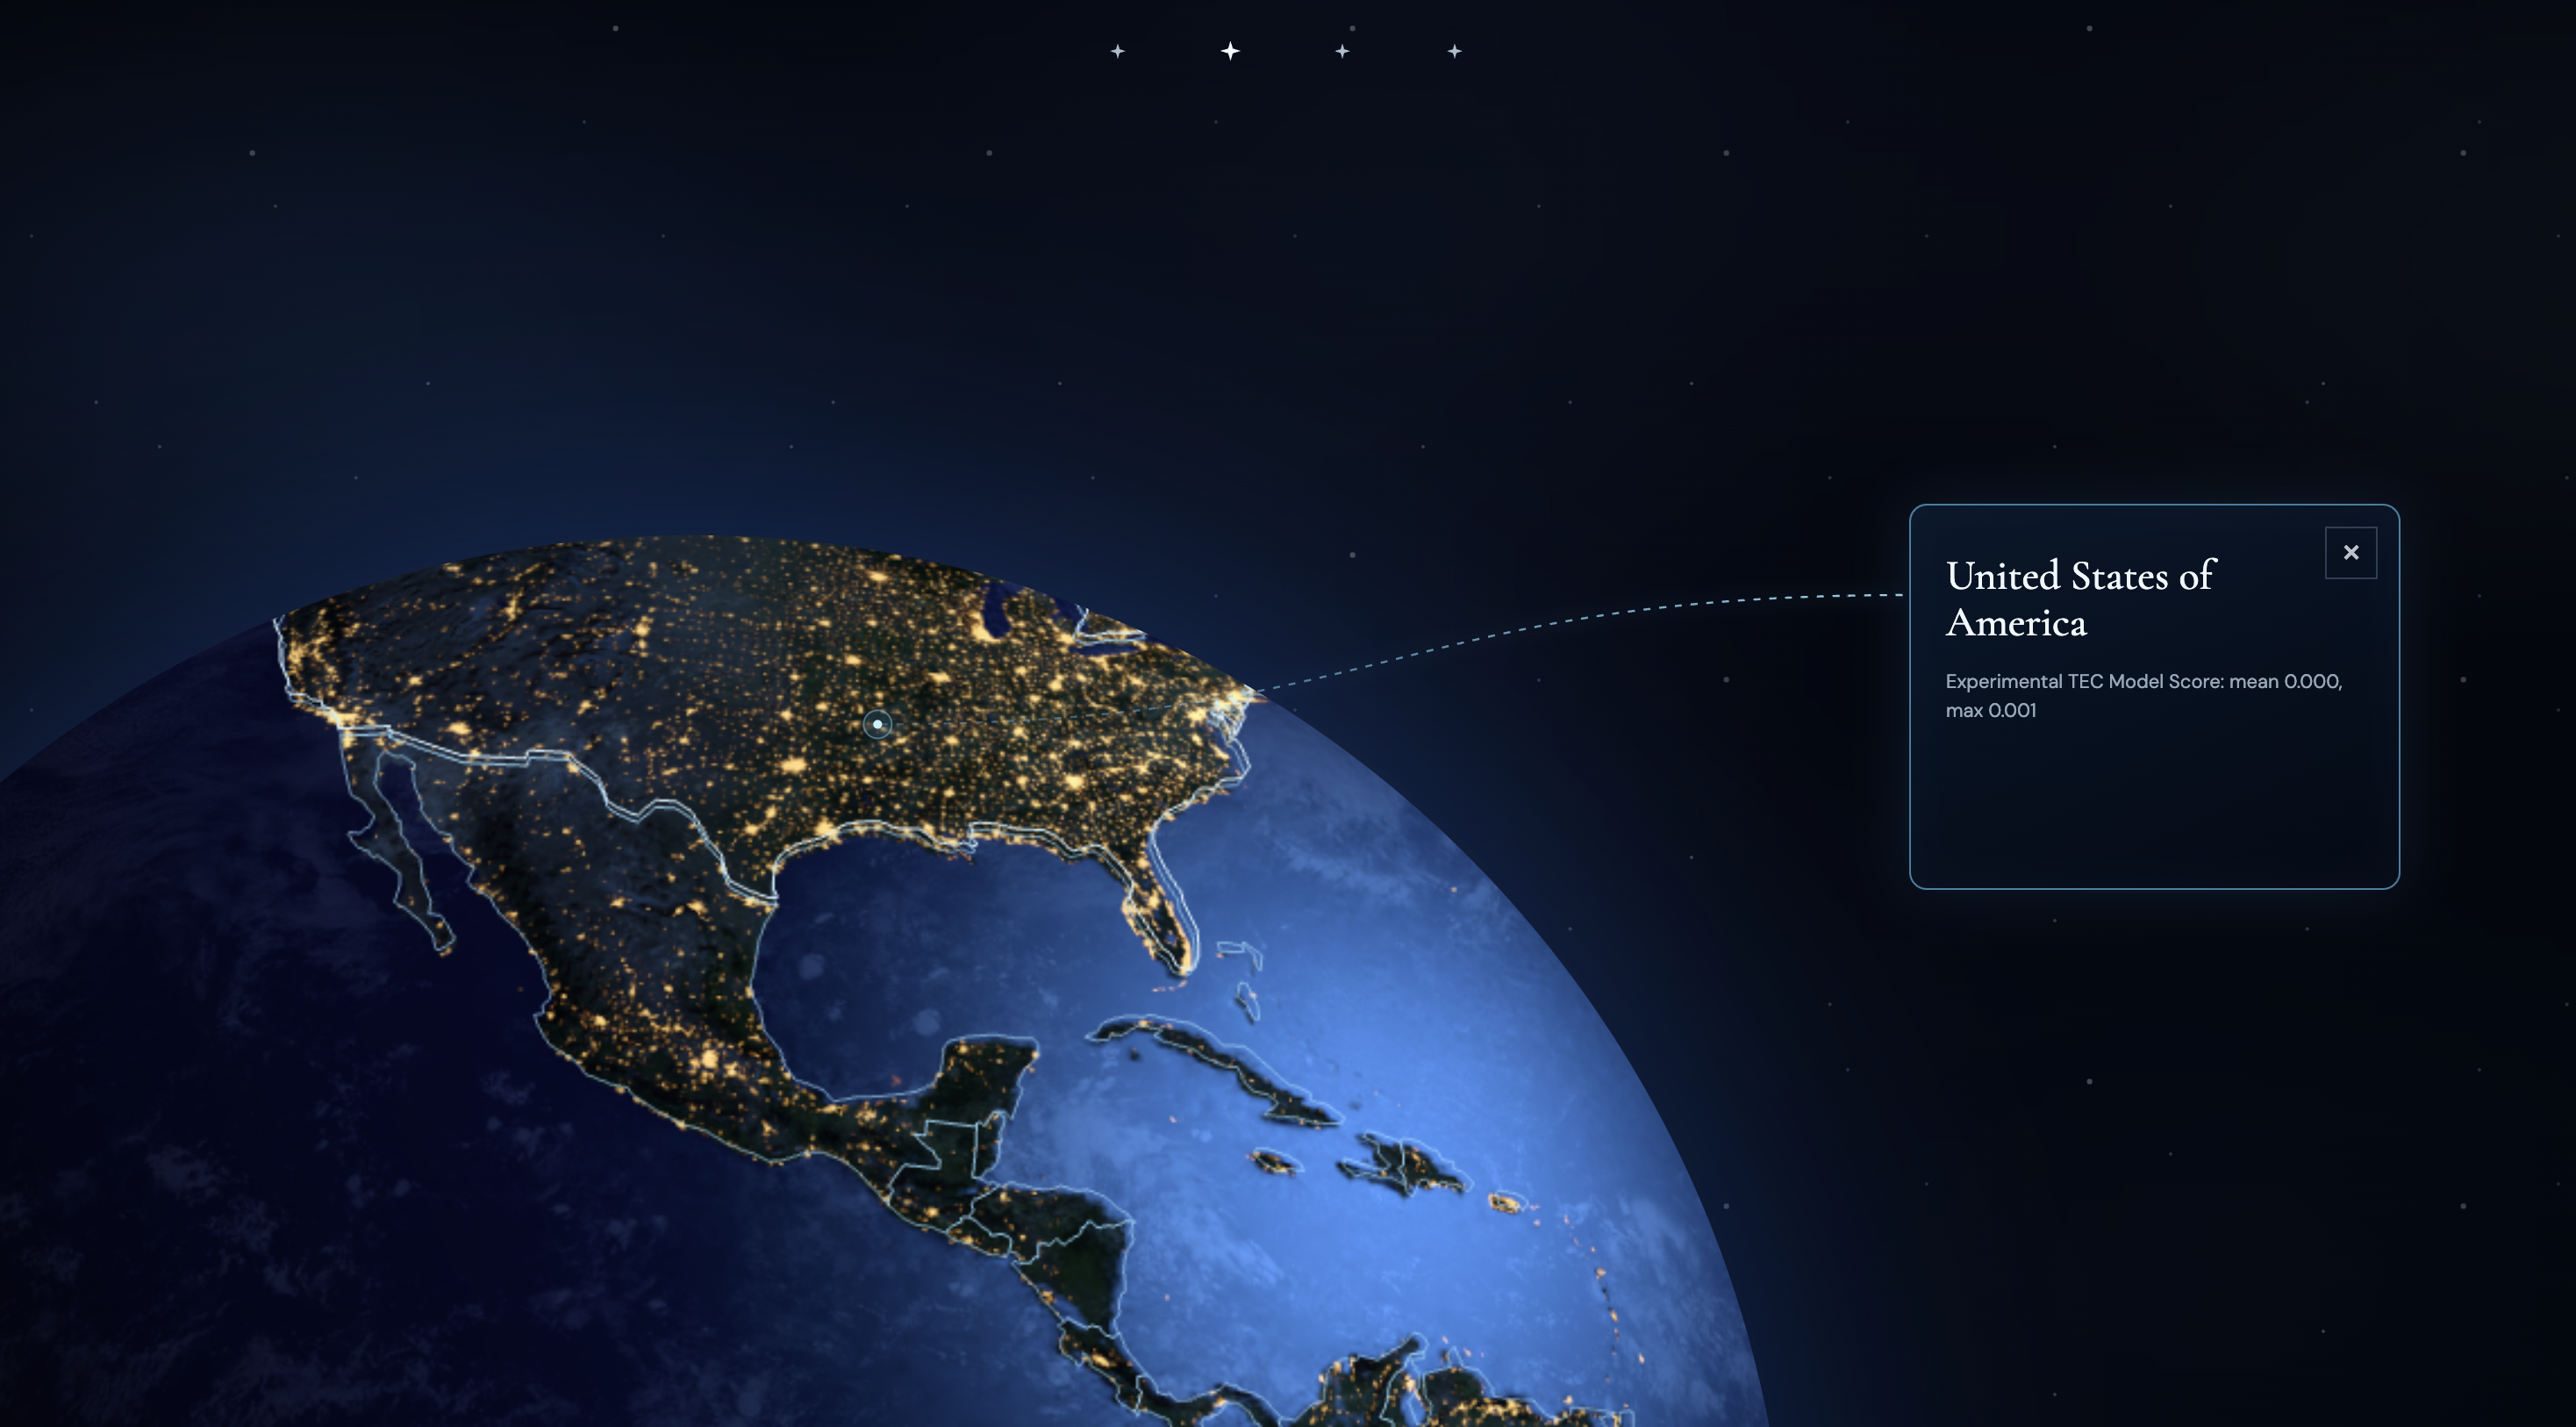
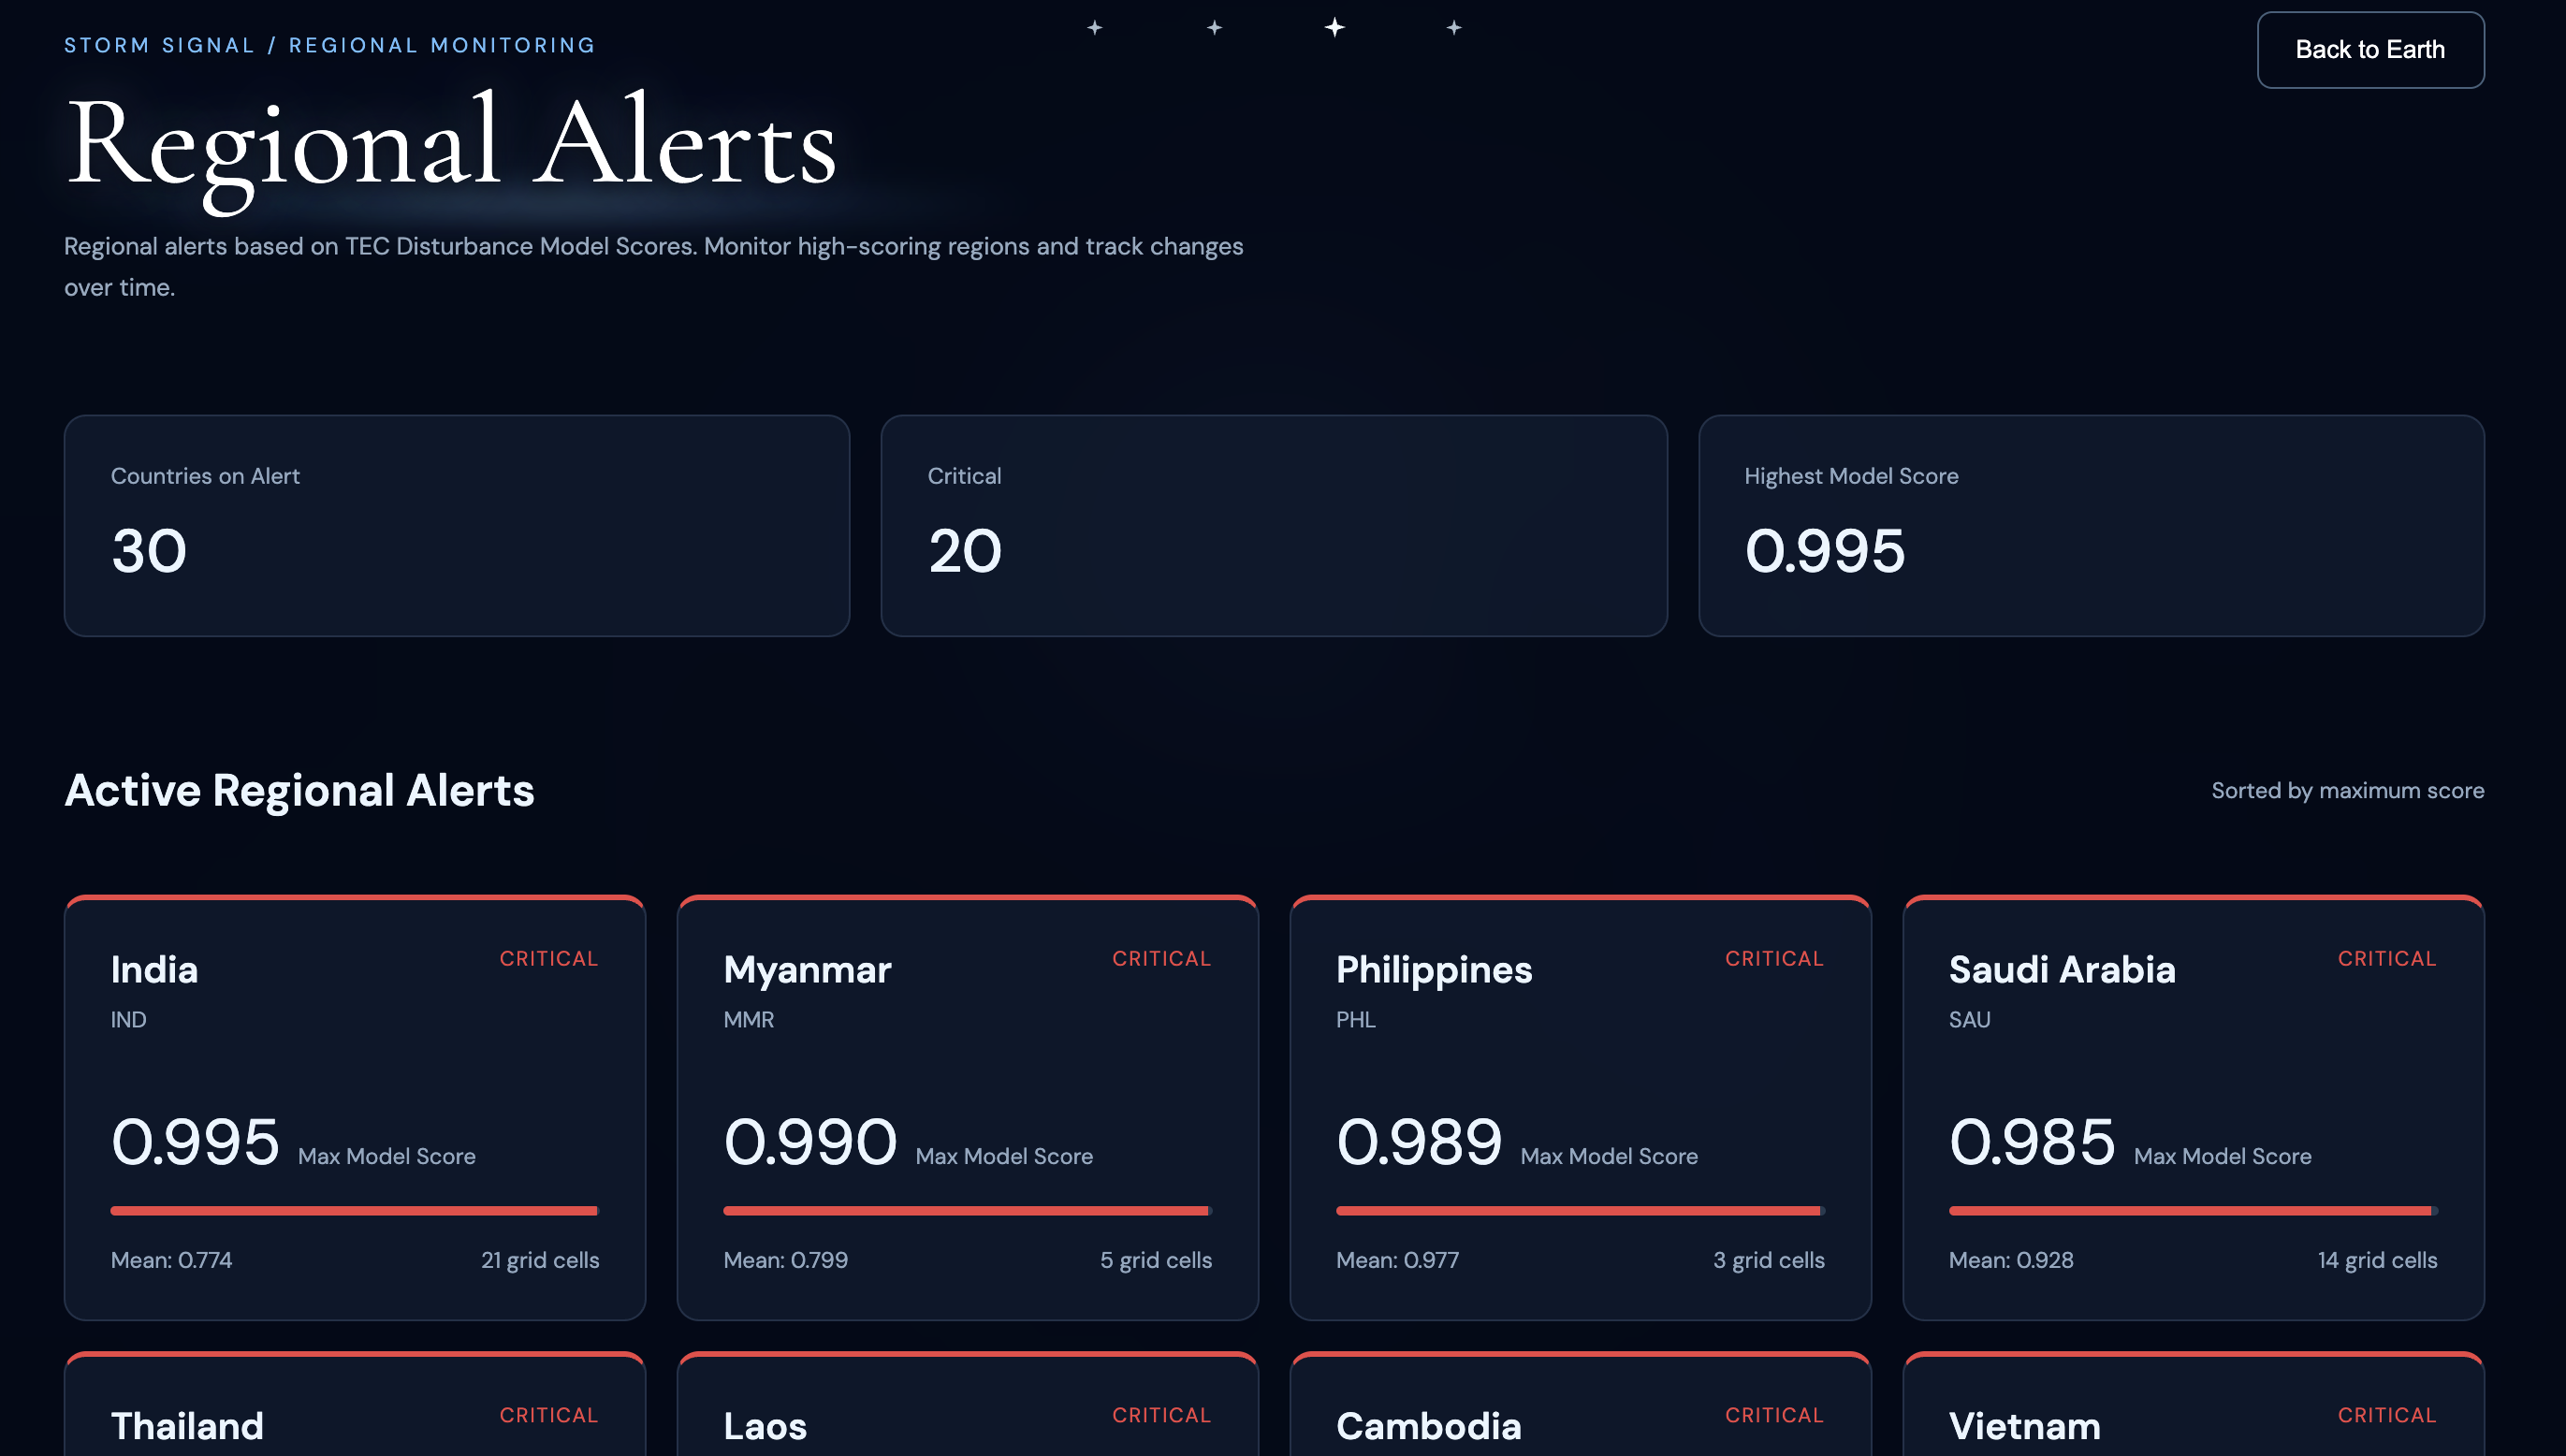
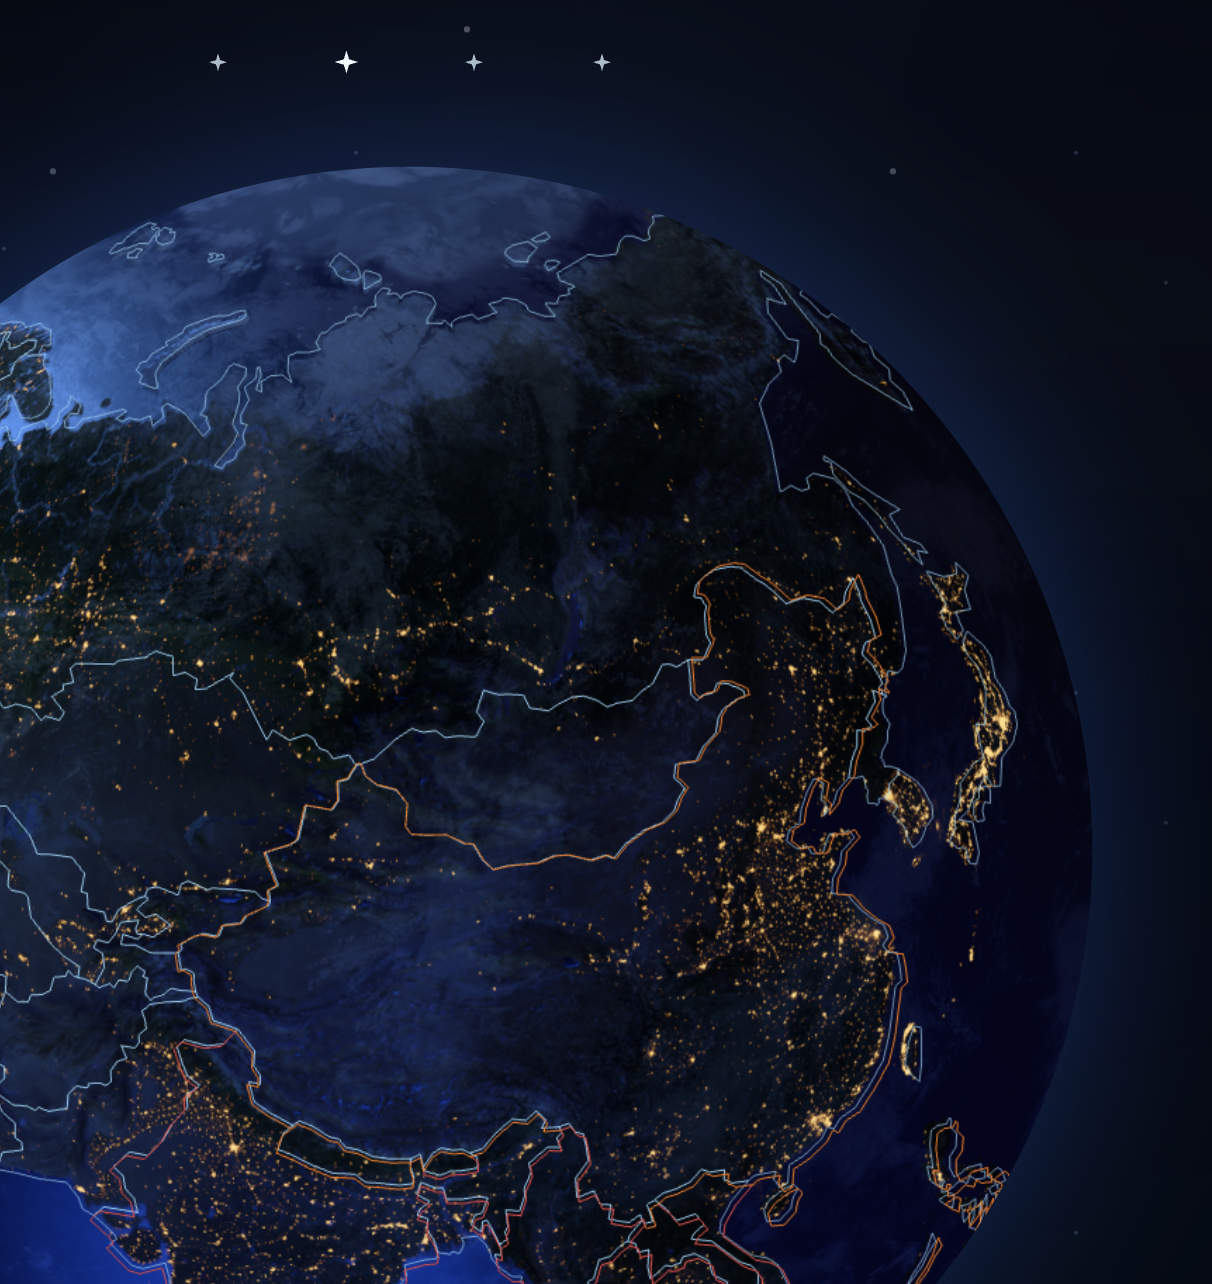
Users can explore a 3D Earth, view space weather information, and understand potential risks through visual alerts.
How we built it
We built Storm Signal by combining NASA space weather data, machine learning, backend development, and interactive 3D visualization. Our goal was to transform complex scientific data into an accessible website that helps people understand geomagnetic activity and changes in Earth's ionosphere.
Our development process involved five major stages: preparing scientific datasets, training three AI models, evaluating their performance, building a backend API, and developing an interactive 3D Earth website.
1. Data Collection and Processing
We started by working with two scientific datasets: NASA OMNI and IonoBench.
NASA OMNI contains historical solar wind and geomagnetic measurements, including magnetic field components, solar wind speed, plasma density, and geomagnetic indices. We used observations recorded at 5-minute intervals to help our AI models recognize patterns in space weather activity.
IonoBench provides historical ionospheric Total Electron Content (TEC) measurements. The data is represented as 72 × 72 spatial grids, with observations recorded every two hours. These grids allow us to study how Earth's ionosphere changes across different regions.
We used Python, Pandas, and NumPy to process the datasets, handle missing values, organize time-series observations, and prepare the data for training.
One technical challenge was that the two datasets used different time intervals. To solve this, we synchronized their UTC timestamps and matched solar wind observations with corresponding TEC measurements. We also created chronological training, validation, and testing splits to evaluate how our models perform on later observations.
2. Developing and Training Three AI Models
We used PyTorch to build three neural network models, each designed to analyze a different aspect of space weather.
StormNet V2 Baseline — GRU
Our first model uses a Gated Recurrent Unit (GRU), a neural network architecture designed for sequential data.
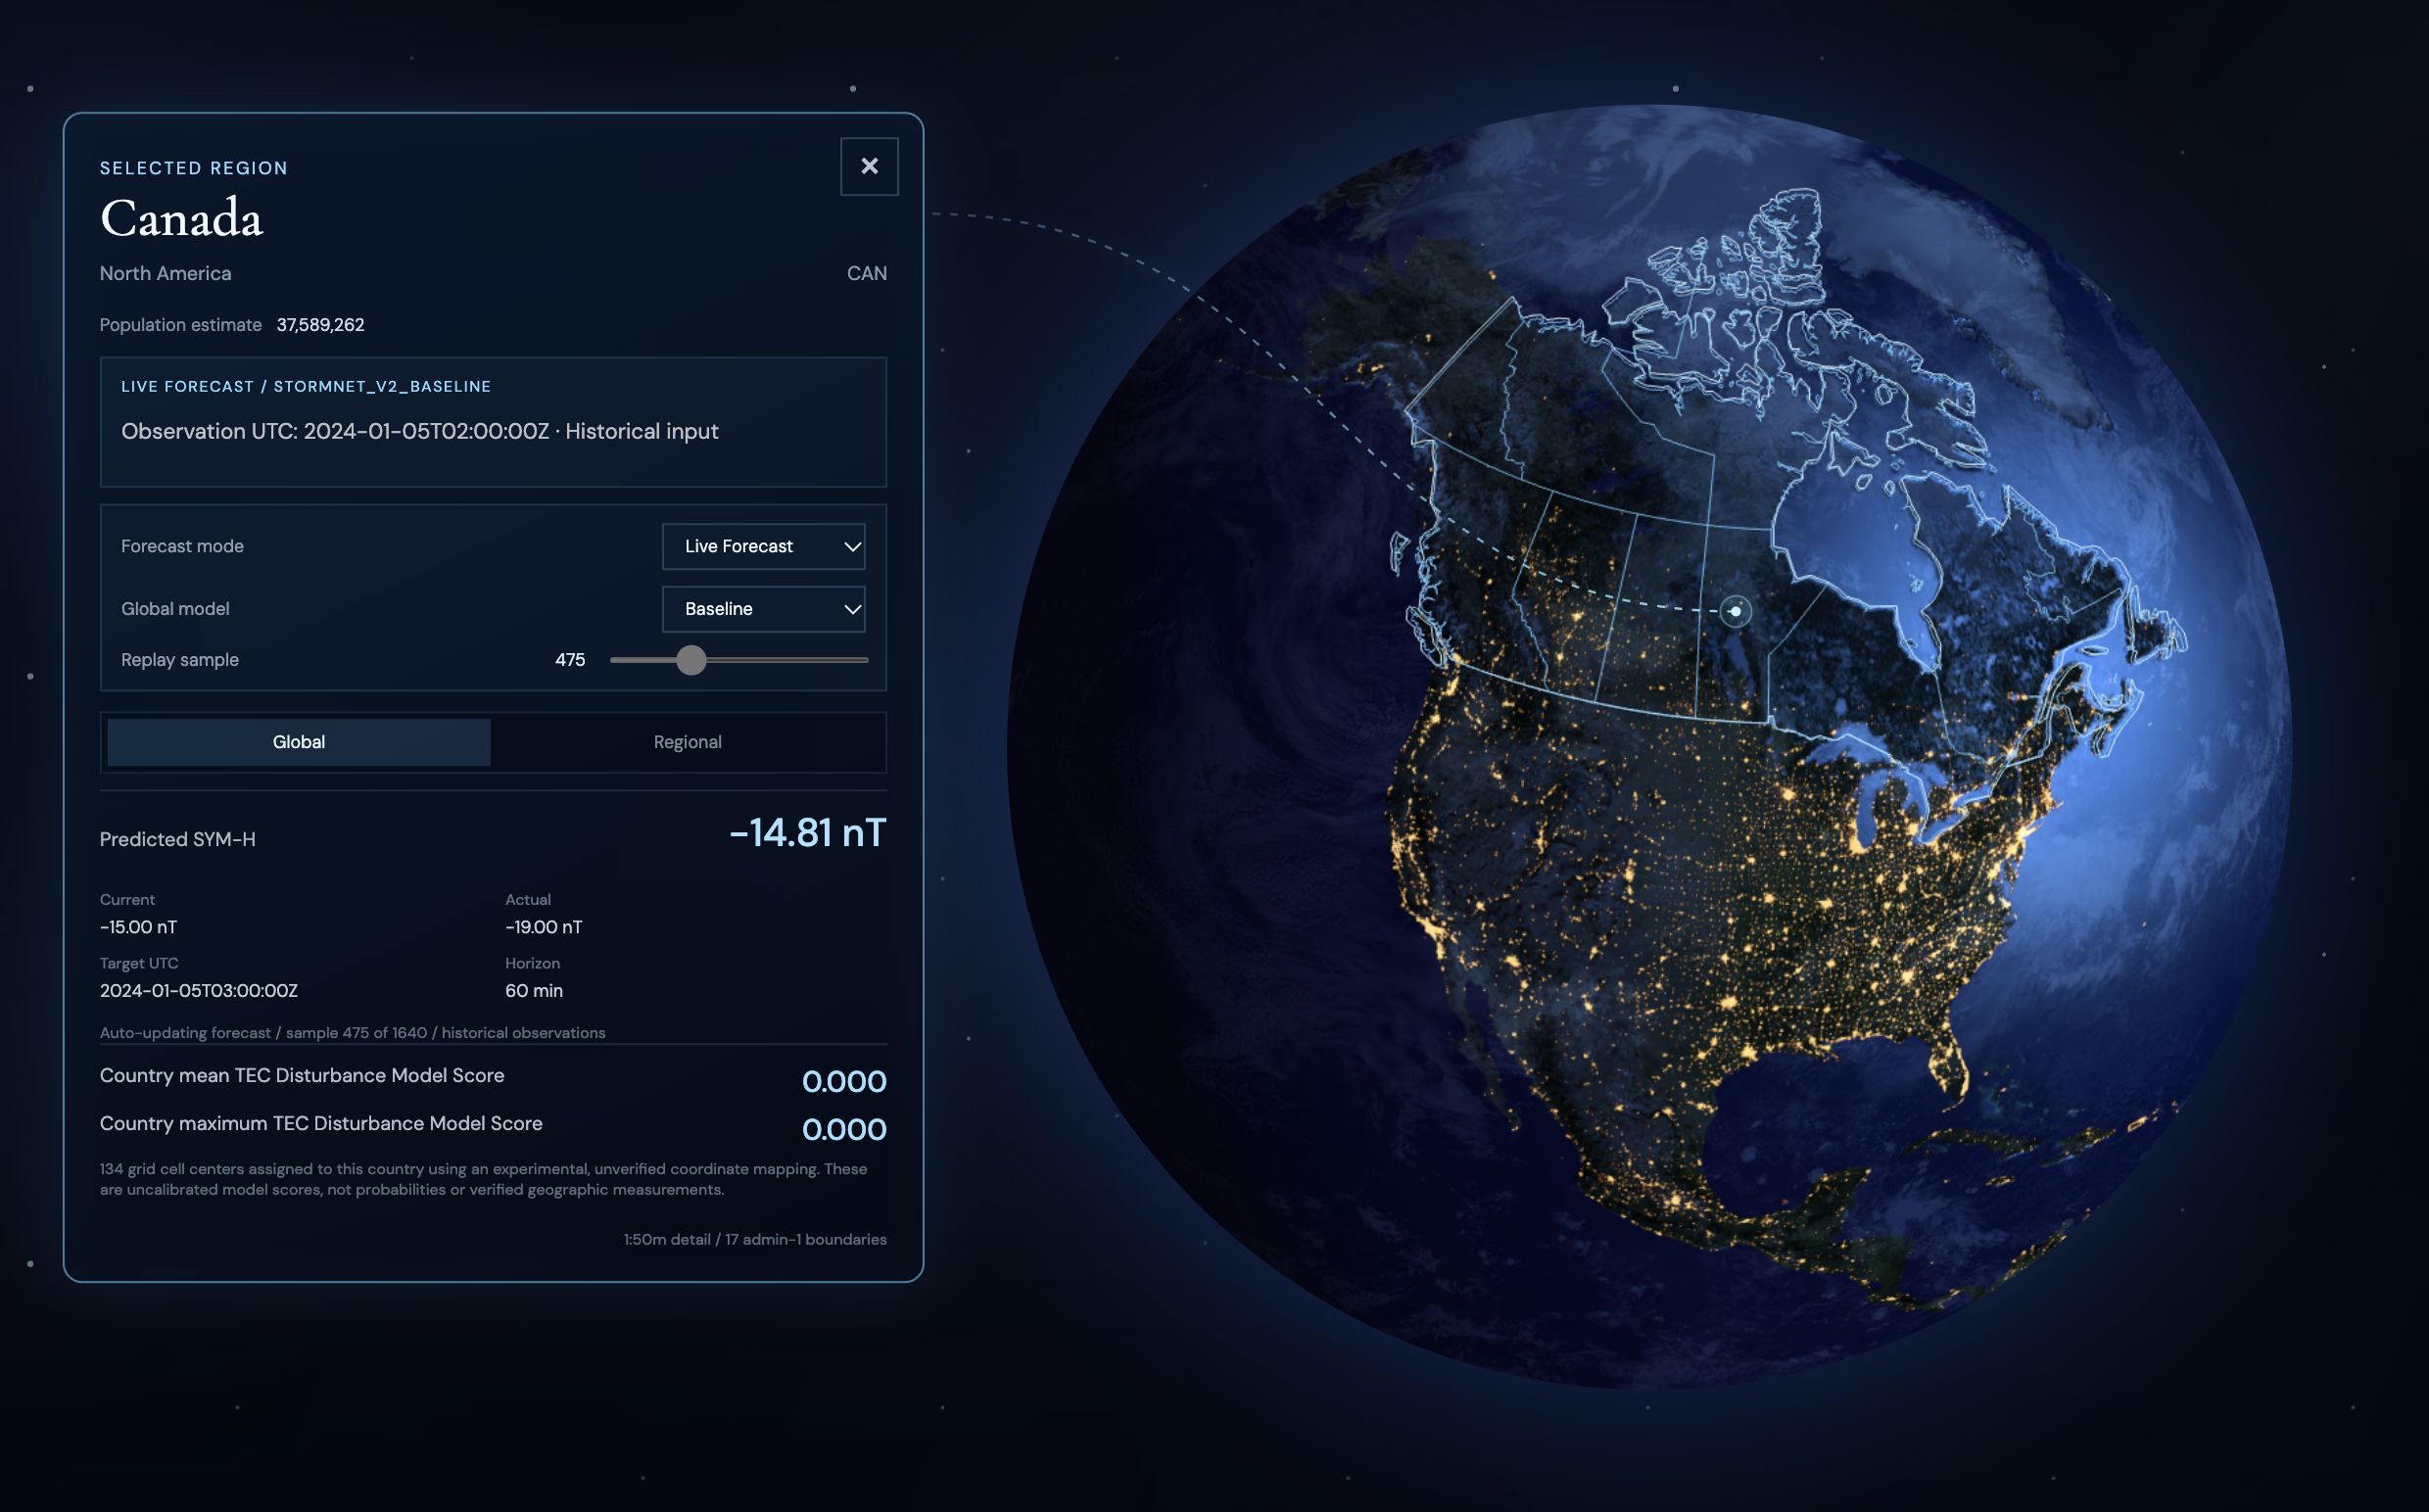
The model analyzes historical solar wind and geomagnetic measurements to predict the SYM-H index 60 minutes into the future. SYM-H is a geomagnetic index that helps describe changes in Earth's magnetic field during geomagnetic disturbances.
StormNet V2 Fusion — CNN-GRU
Our second model combines a Convolutional Neural Network (CNN) with a GRU.
The CNN extracts spatial patterns from ionospheric TEC maps, while the GRU learns temporal patterns from solar wind measurements. By combining these two types of information, we explored whether ionospheric observations could improve geomagnetic storm intensity predictions.
StormNet Regional — CNN-GRU
Our third model focuses on predicting regional ionospheric changes.
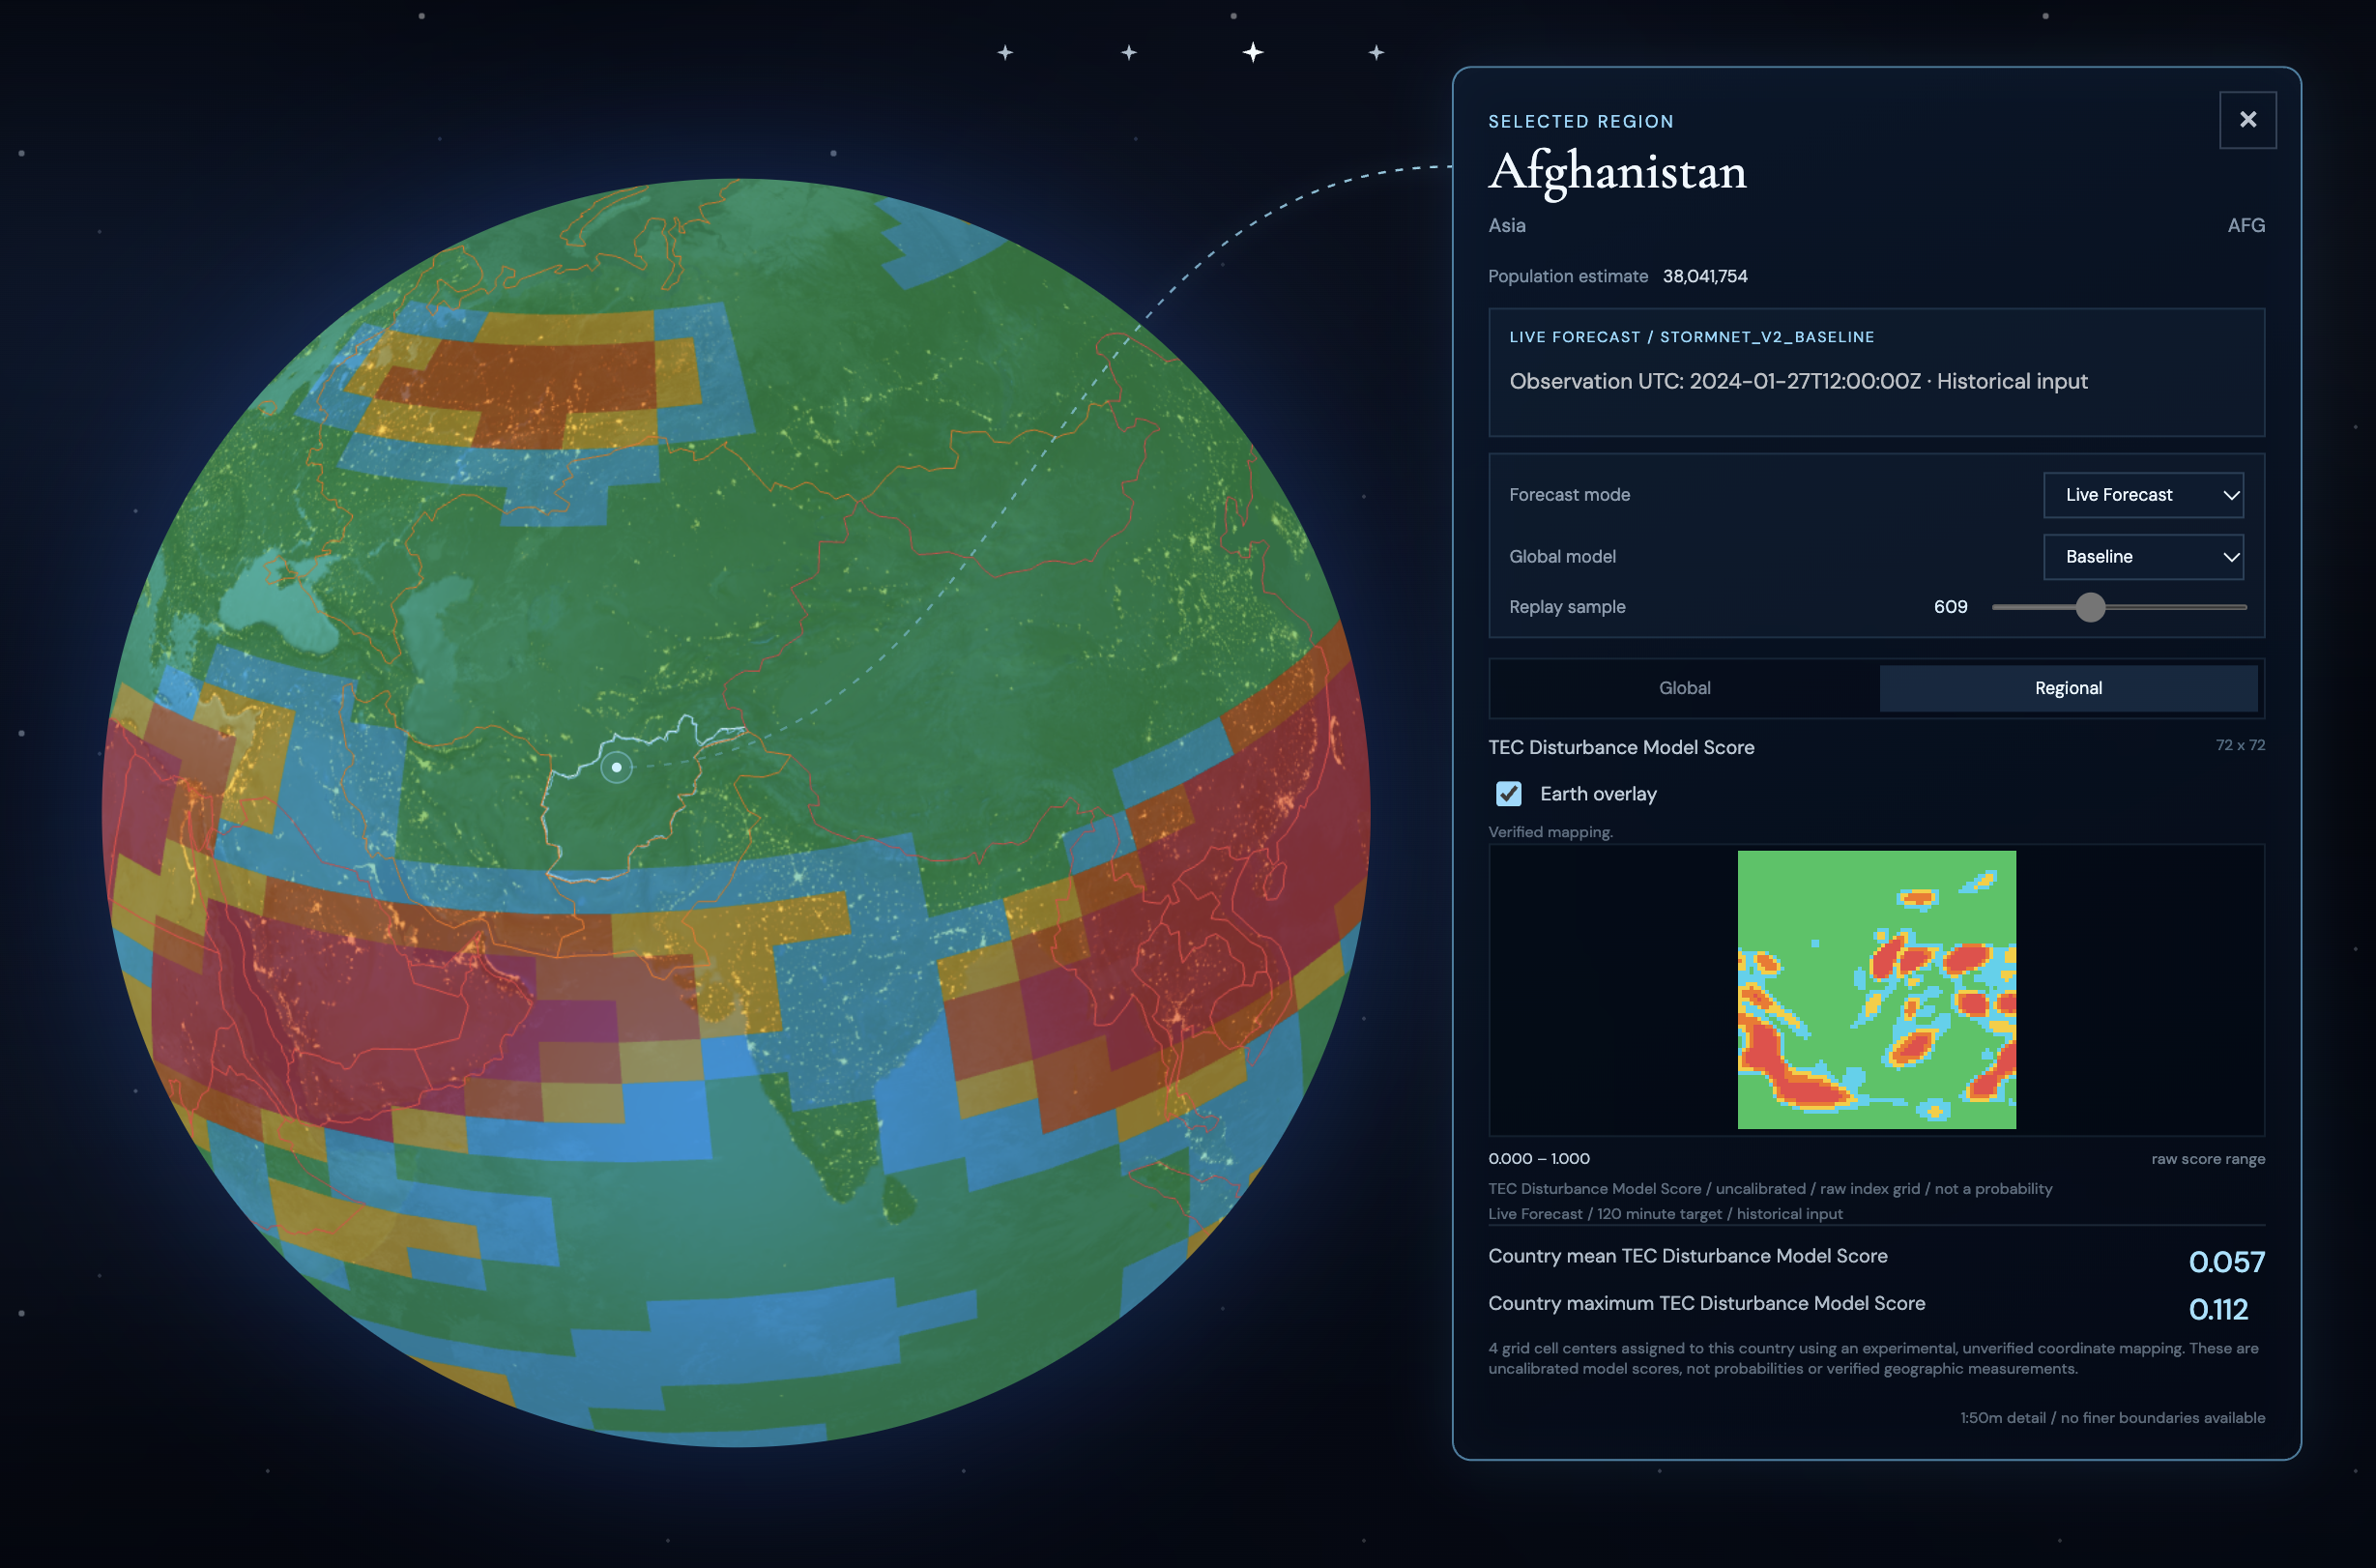
Unlike the first two models, which output a single future SYM-H value, the Regional Model generates a 72 × 72 prediction grid containing 5,184 individual disturbance scores.
Each score represents the model's estimate of whether a particular TEC grid cell will experience an unusually large change in normalized TEC over the next two hours.
We trained the models locally using an NVIDIA GPU with CUDA acceleration, which helped us process the large datasets and train the neural networks more efficiently.
3. Evaluating Model Performance
After training, we evaluated our models using chronological test data that was separated from the training process.
For our global geomagnetic forecasting models, we measured prediction errors using Mean Absolute Error (MAE) and Root Mean Squared Error (RMSE).
| Model | Test MAE | Test RMSE |
|---|---|---|
| StormNet V2 Baseline | 3.591 nT | 5.895 nT |
| StormNet V2 Fusion | 3.578 nT | 5.948 nT |
For our Regional Model, we used Binary Cross-Entropy and Brier Score to evaluate the predicted TEC disturbance scores.
| Metric | Validation | Test |
|---|---|---|
| Binary Cross-Entropy | 0.1112 | 0.3441 |
| Brier Score | 0.0334 | 0.1076 |
These results helped us understand the performance and limitations of our models. We also discovered that the regional model performed differently on validation and test data, showing us the importance of testing AI systems on different time periods.
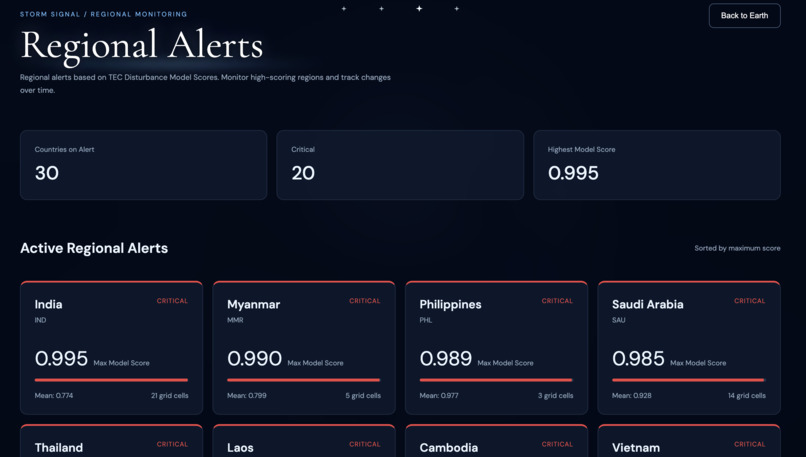
The regional model's outputs are currently uncalibrated scores rather than verified probabilities of local geomagnetic storms or power outages.
4. Building the Backend with FastAPI
Once our models were trained, we needed a way to connect the machine learning results to our website.
We built a REST API using FastAPI, a Python framework that allows applications to exchange information through HTTP requests.
Our backend reads saved prediction results and returns them in JSON format. This allows the frontend to access predictions without having to run the machine learning models directly in the browser.
We deployed our backend on Render, making the API accessible online and allowing our team members to develop and test the frontend independently.
Our API provides several features:
- Global Forecast: Returns predicted SYM-H values 60 minutes into the future.
- Regional Forecast: Returns a 72 × 72 grid of TEC disturbance scores for the next two hours.
- Model Metrics: Provides evaluation results for our trained models.
- System Status: Checks whether the forecasting data is available.
- Historical Replay: Provides endpoints for navigating through historical prediction frames and timestamps.
We also developed a historical replay system that allows the website to retrieve predictions from different points in time. This makes it possible to demonstrate how predicted geomagnetic and ionospheric conditions change throughout a historical period.
5. Developing the Interactive 3D Earth Website
For our frontend, we used HTML, CSS, JavaScript, and Three.js.
We chose Three.js because it allows us to create interactive 3D graphics directly in a web browser using WebGL.
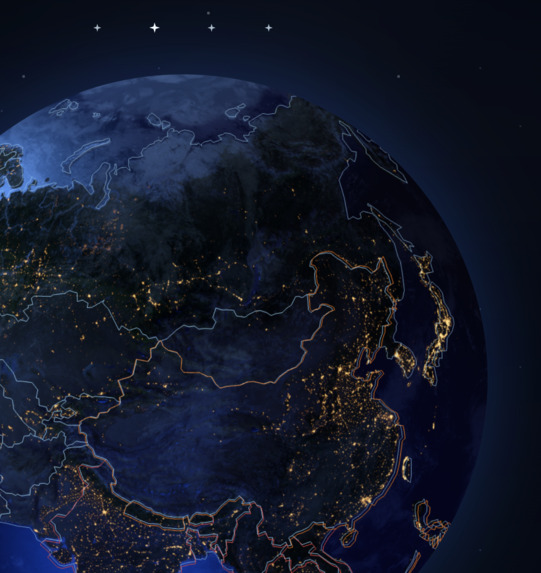
We built a realistic 3D Earth featuring day and night textures, cloud layers, atmospheric lighting, and interactive camera controls. Users can rotate the globe, zoom in and out, and explore different parts of the world.
To support geographic interaction, we integrated Natural Earth GeoJSON country boundaries. This allows users to select countries, highlight geographic regions, and view additional information such as country names, continents, and population.
We also developed rendering logic for a 72 × 72 TEC heatmap, designed to display the Regional Model's predicted ionospheric disturbance scores on the Earth.
The geographic mapping between IonoBench grid cells and real-world coordinates still requires verification before the heatmap can be positioned accurately.
Our frontend is designed to connect to the FastAPI backend so that model predictions can eventually update the 3D visualization and information panels. At the tested frontend stage, the interactive Earth and geographic controls were implemented, while forecast API integration and replay controls remained in development.
6. Connecting the AI Models to the Website
One of our biggest technical challenges was connecting locally trained machine learning models to a website developed by other team members.
We solved the backend side of this problem by separating our system into independent components:
Machine Learning → Saved Predictions → FastAPI → Frontend Visualization
The AI models generate predictions from historical scientific observations. These predictions are saved and made accessible through our FastAPI backend.
The frontend can request global and regional forecasts using HTTP endpoints and receive the results as JSON.
For example, a global forecast returns a predicted SYM-H value, while a regional forecast returns a 72 × 72 matrix of TEC disturbance scores.
This separation allows us to develop and improve the AI models without having to rebuild the entire frontend. It also makes it easier for our four-person team to work on different parts of the project simultaneously.
7. Historical Forecasting and Future Development
Storm Signal currently uses historical data replay, rather than live space weather forecasting.
Our trained models and backend can provide predictions for historical observations, allowing us to evaluate model performance and demonstrate how the forecasting system works.
We plan to continue improving the accuracy of our models, verifying the geographic coordinates of regional TEC predictions, and developing more reliable regional warning systems.
In the future, we hope to support real-time space weather observations and provide clearer information about potential geomagnetic disturbances.
Through this project, we learned how to work with large scientific datasets, train neural networks, deploy machine learning results through web APIs, and create interactive scientific visualizations. Most importantly, we learned how to combine these technologies into one collaborative project.
Challenges we ran into
One of our biggest challenges was working with NASA's large datasets and training AI models, since both were completely new to us. We also struggled with figuring out how to connect our locally trained AI models to the interactive visualization website we were building.
As first-time hackers, working in a team of four was another challenge. We had to learn how to communicate effectively, divide tasks, and work together to solve problems. Although we faced many difficulties during development.
Accomplishments that we're proud of
NASA's complex space datasets were completely new to us, we worked together, learned new skills, and overcame challenges to complete our project. Through this experience, we not only improved our skills in our own fields but also gained knowledge in areas we had never explored before.
What we learned
By working with NASA's large datasets, we learned a lot about space and astronomy that we had never explored before. Through conversations with AI, we also learned how to train machine learning models and better understand how AI works.
Most importantly, working as a team helped us improve our communication, teamwork, and leadership skills. We learned how to lead a team, share ideas, and solve problems together. This experience also taught us how to combine artificial intelligence, scientific research, and interactive design into one project.
What's next for Storm Signal
Our next goal is to improve the prediction accuracy of our three AI models and add more specific solar storm warnings for cities and locations based on their latitude and longitude. We also hope to include real-time space weather data, more detailed regional predictions, and clearer warning notifications to help people better understand potential risks in their area.
Authors
Storm Signal was developed by a team of four:
Yuxin Liu — Team Lead & Design
Yubo Sun — Backend
Lorisa Li — Frontend
Zora Cheng — Design
