Store Pulse
Inspiration
Retail organizations rarely receive perfectly structured data. Real-world datasets are fragmented, inconsistent and constantly evolving. Rather than building a simple AI wrapper we focused on solving the complete analytics workflow:
$$ \text{Raw Data} \rightarrow \text{ETL} \rightarrow \text{Validation} \rightarrow \text{Database} \rightarrow \text{Dashboard} \rightarrow \text{AI Insights} $$
Our goal was to combine reliable data engineering with AI-assisted decision support so that every insight is grounded in validated business data.
What it does
Store Pulse is an end-to-end retail analytics platform that transforms raw Walmart sales data into actionable business insights.
The system ingests three independent data sources:
- Weekly sales by store and department
- Store metadata
- External economic indicators (fuel price, CPI, unemployment, holidays)
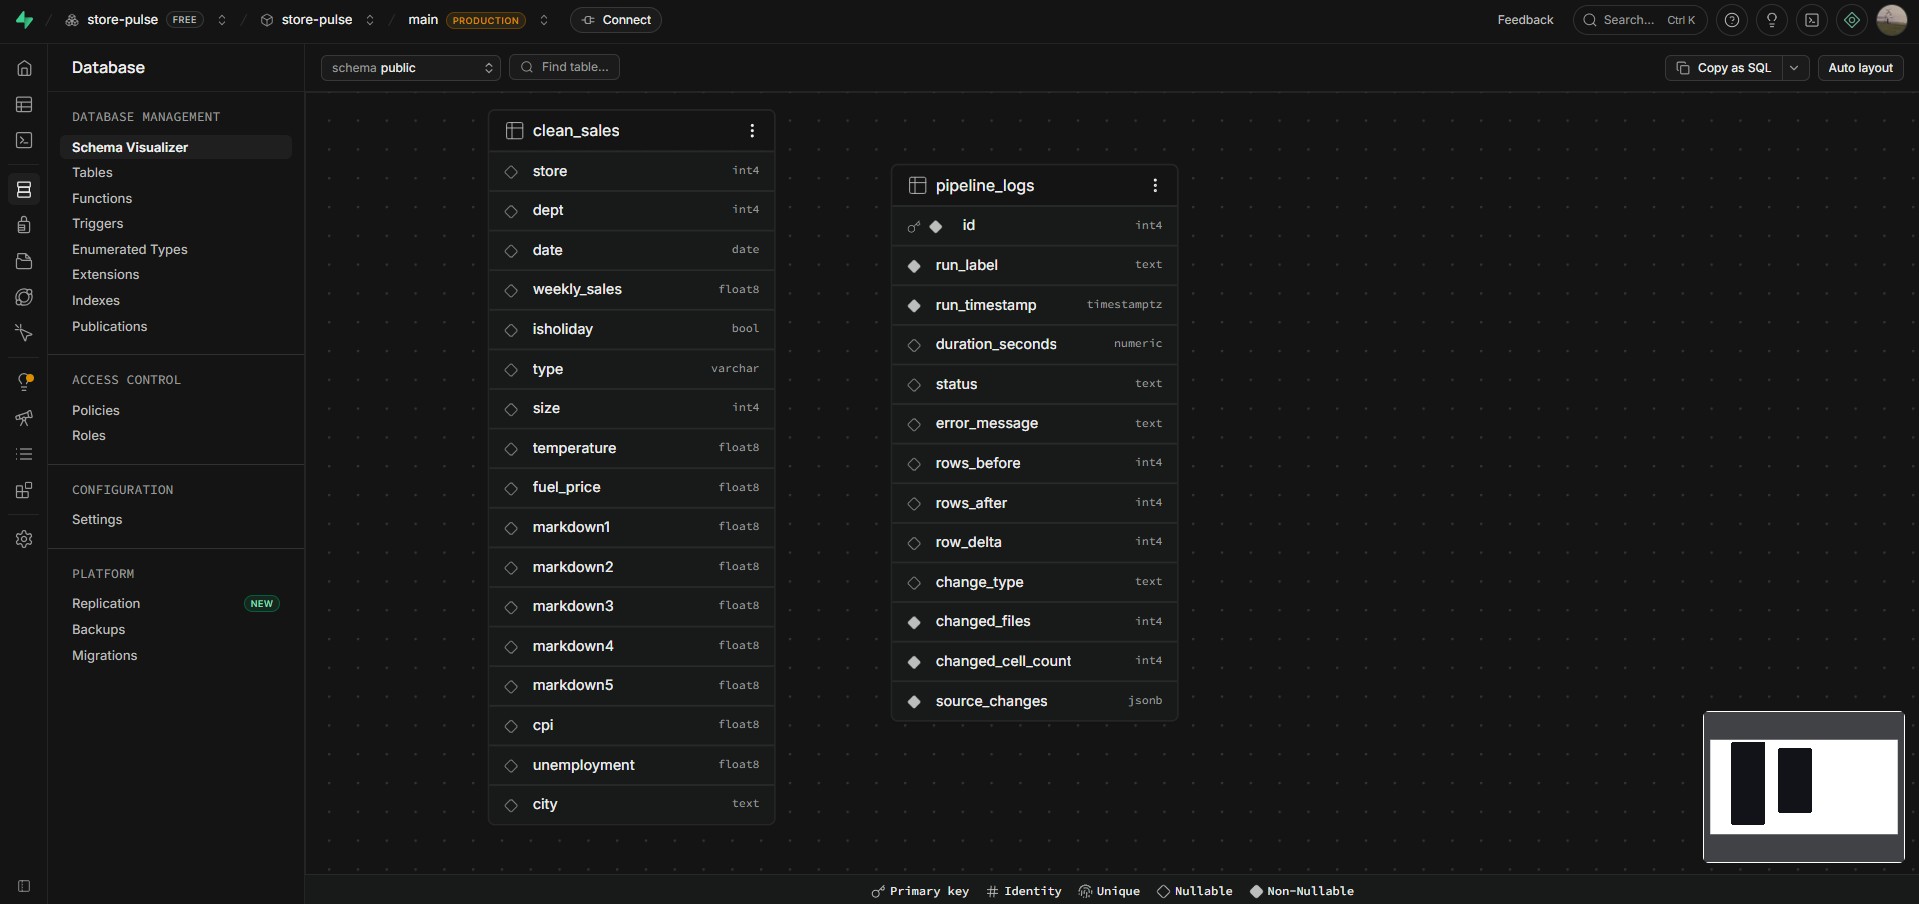
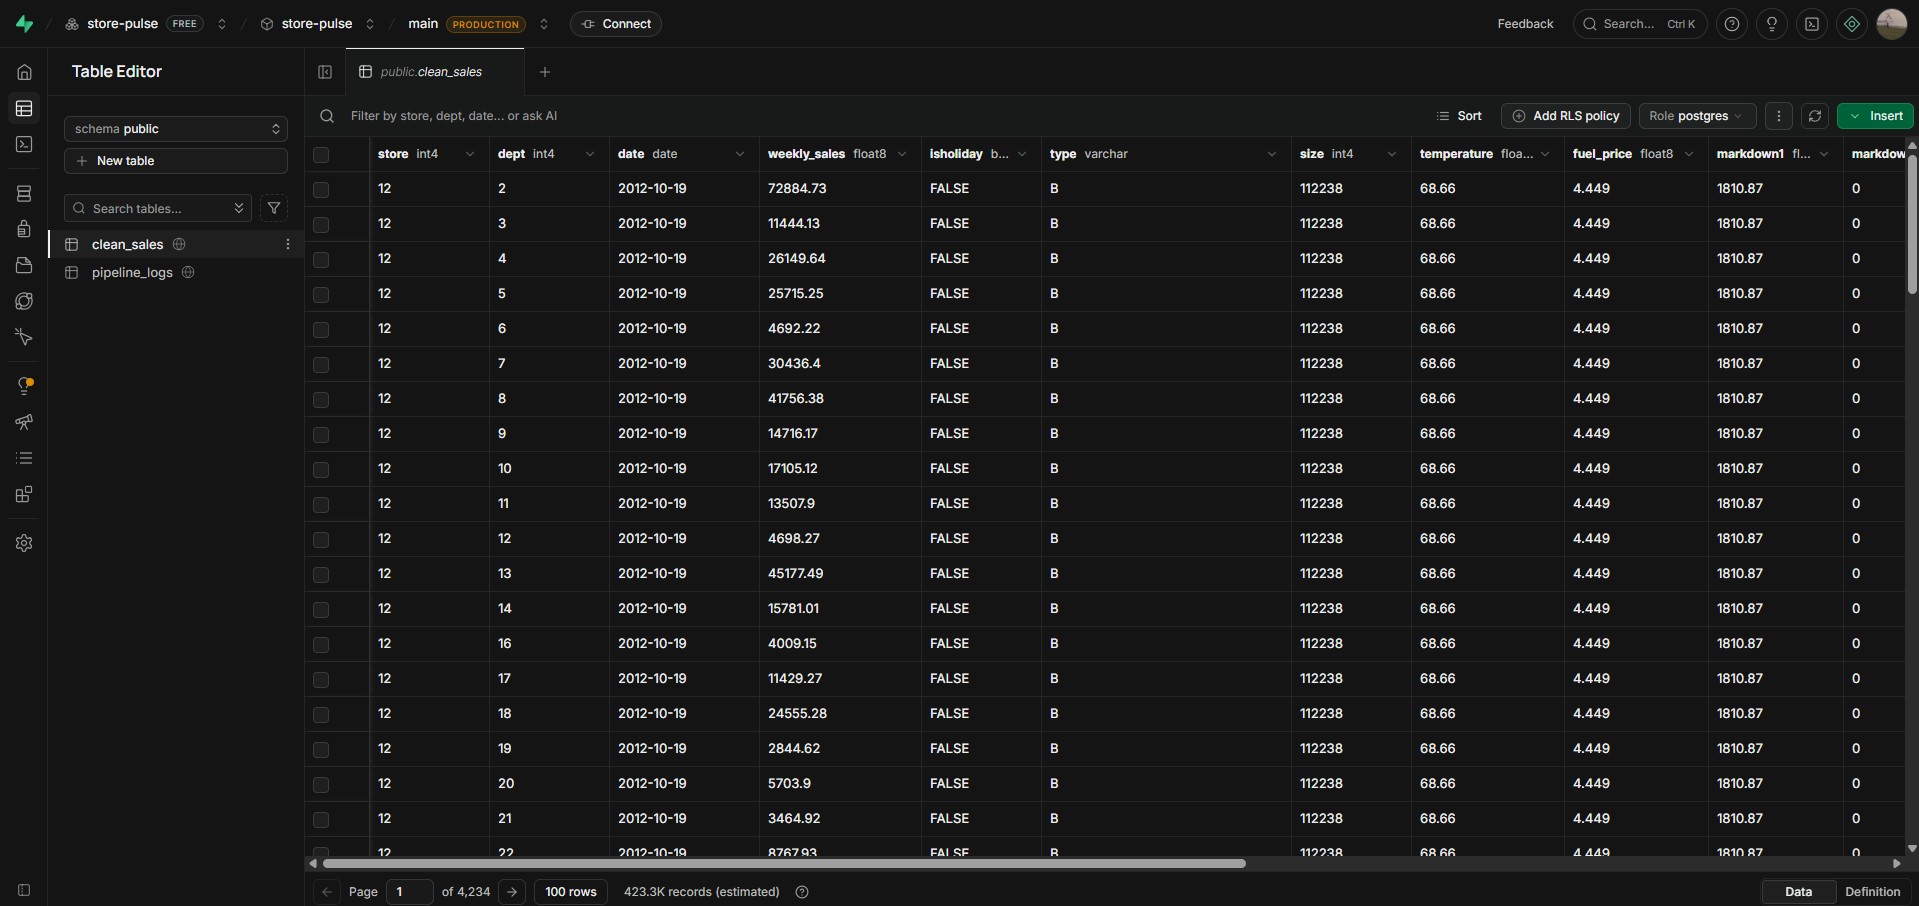
An automated ETL pipeline extracts, validates, transforms and loads the data into a live PostgreSQL database, producing a single trusted analytical dataset.
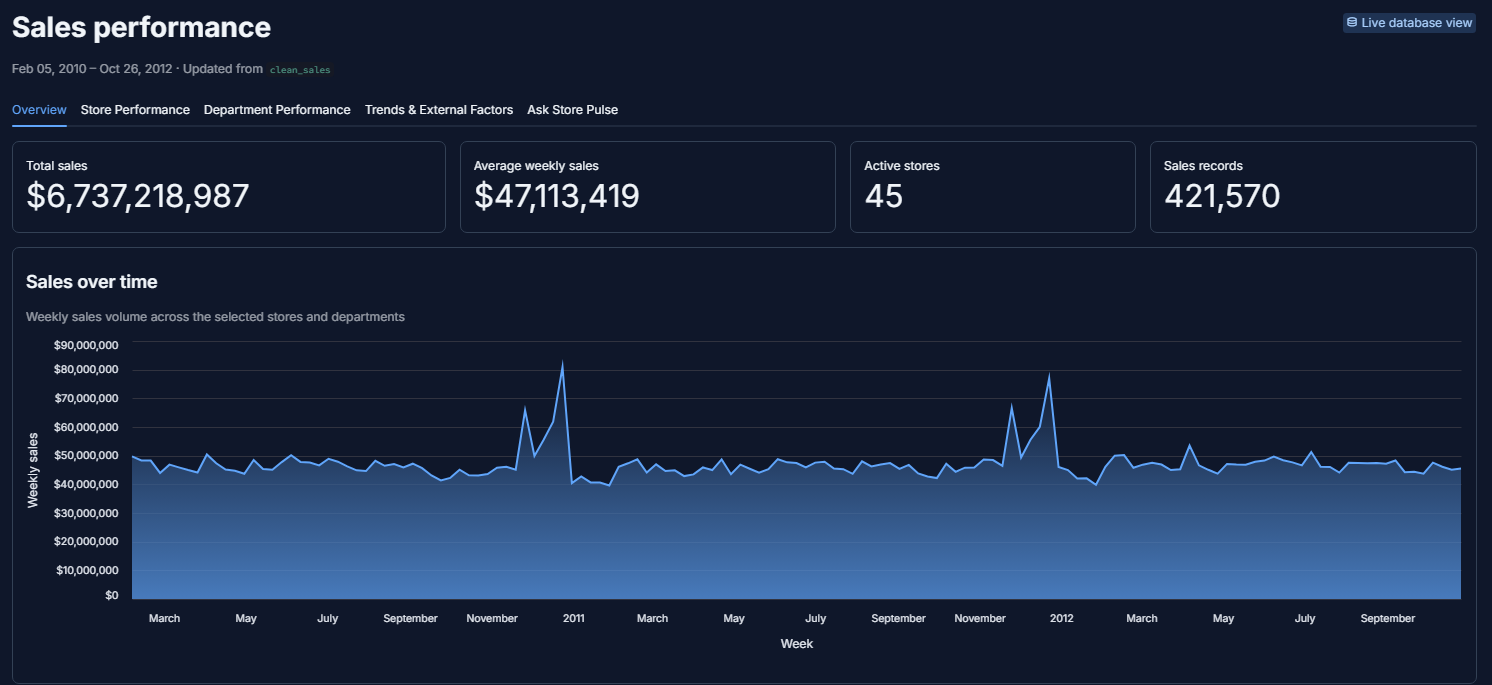
The platform provides a 5-tab interactive dashboard:
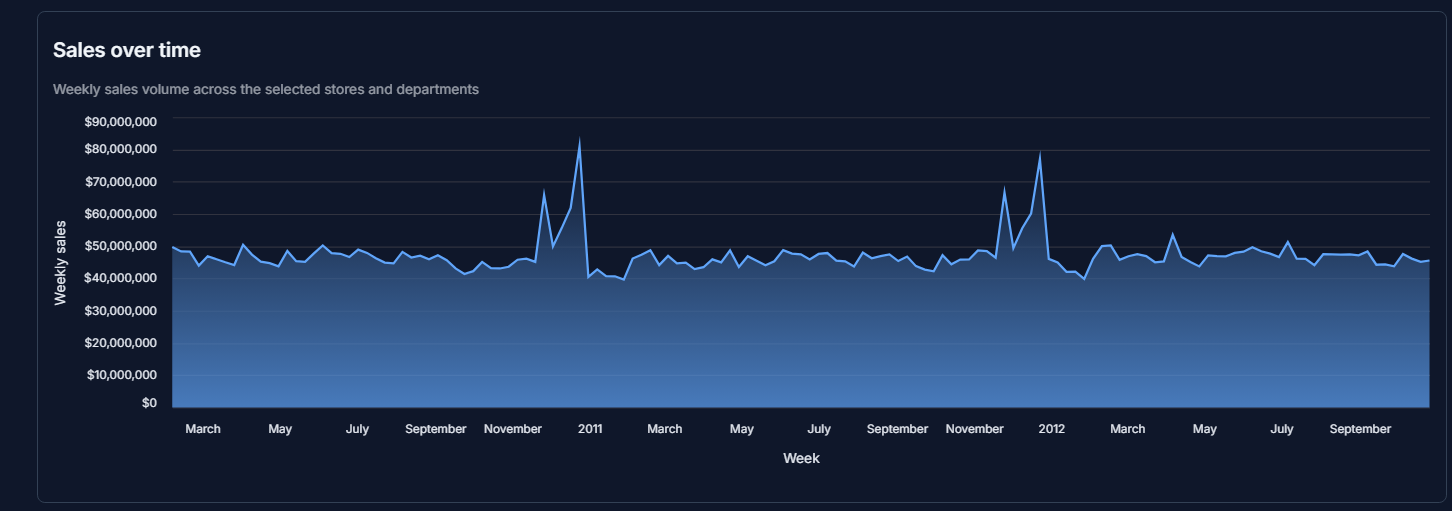
- Overview — Executive KPIs and weekly sales trends
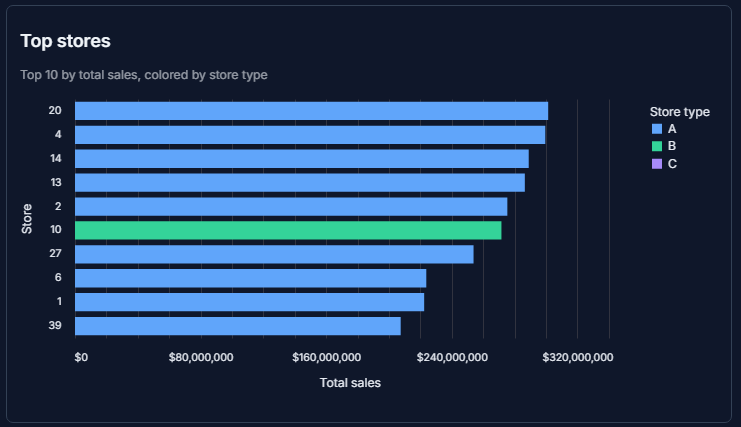
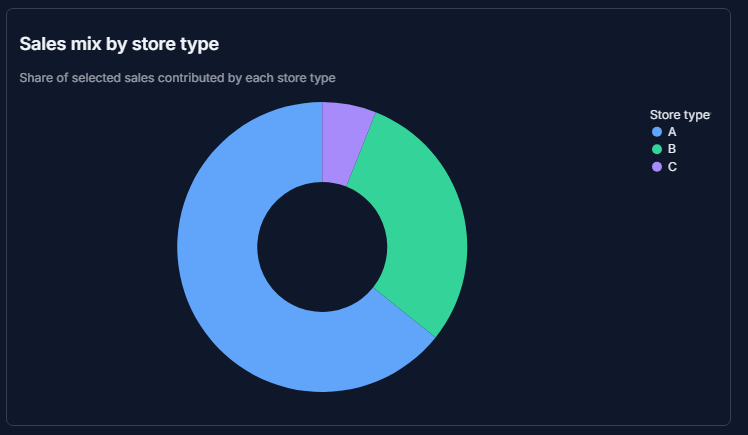
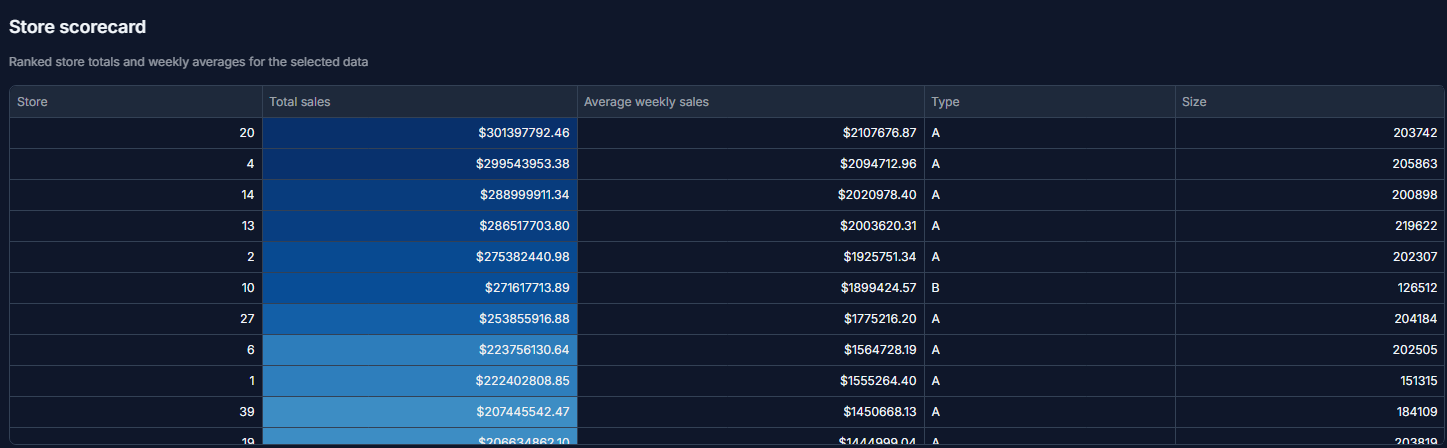
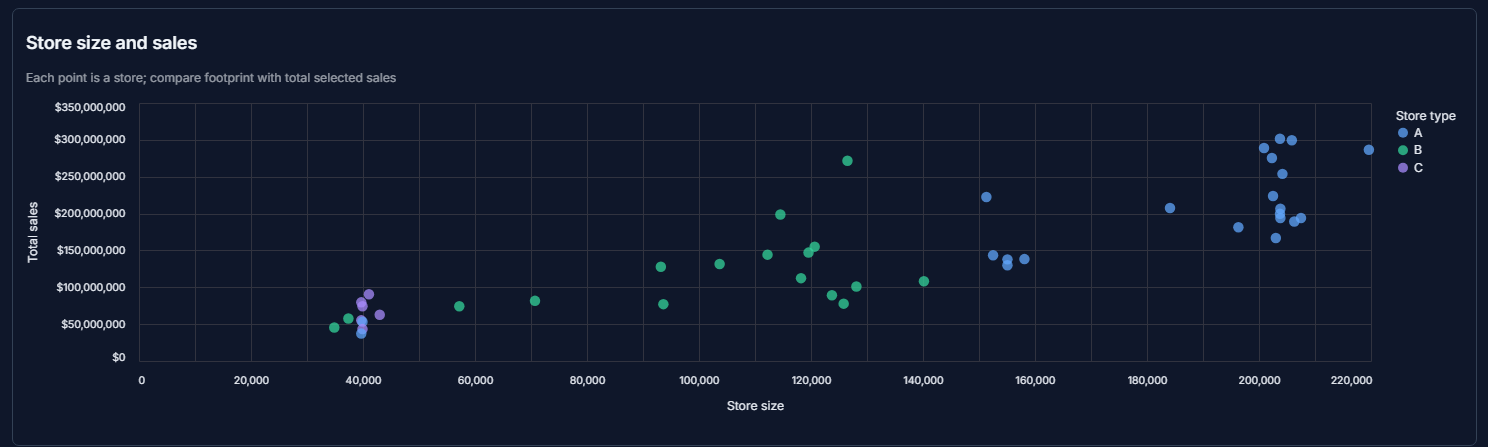
- Store Performance — Store rankings, sales distribution, size vs. sales analysis and performance scorecards
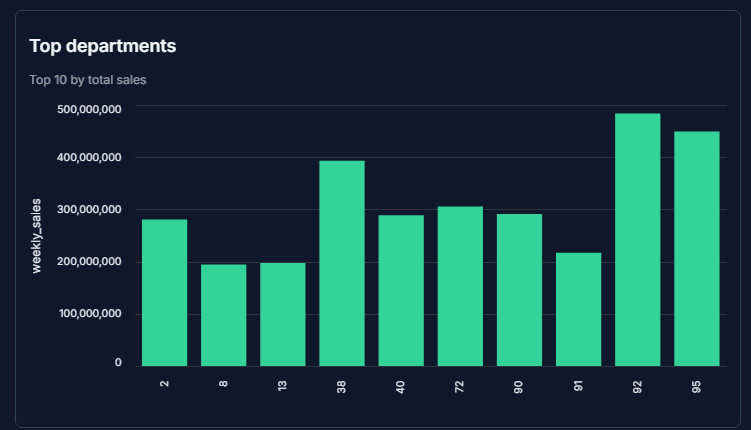
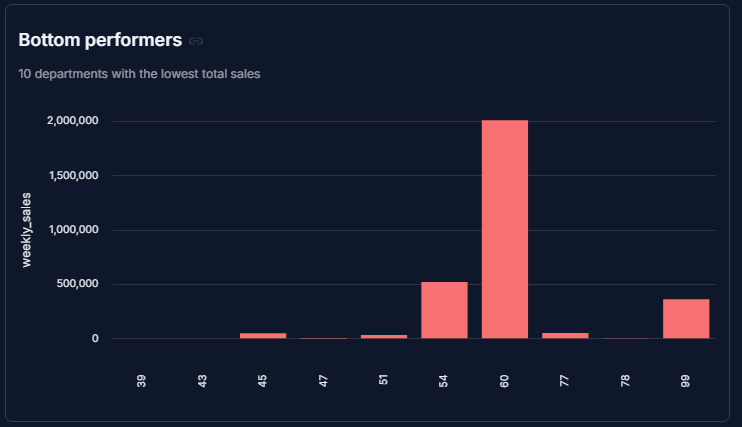
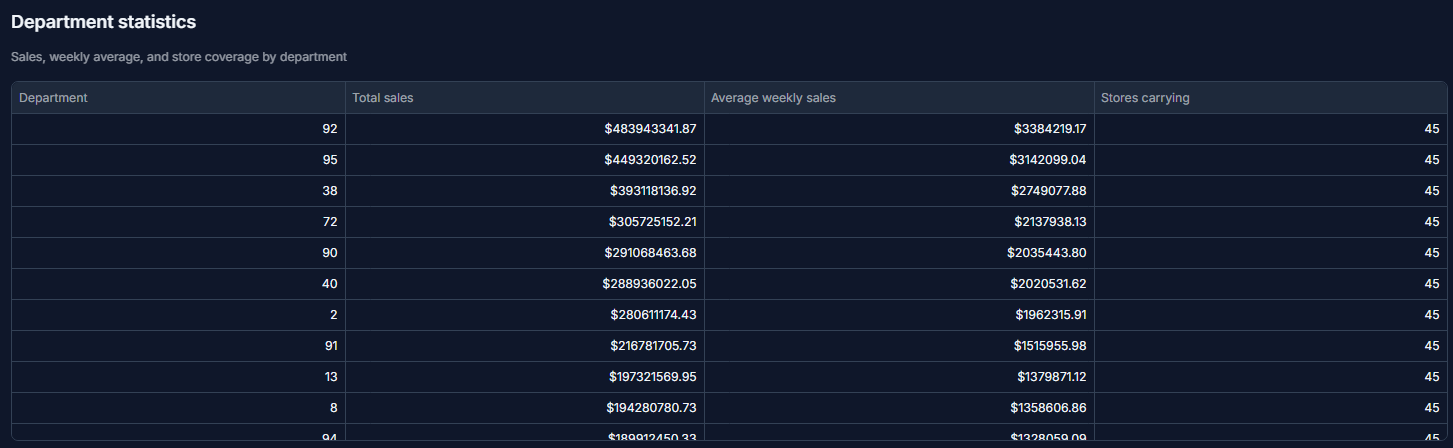
- Department Performance — Top and bottom-performing departments
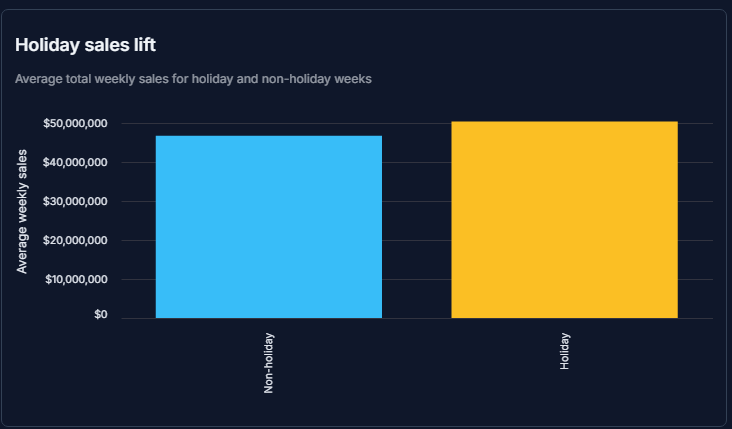
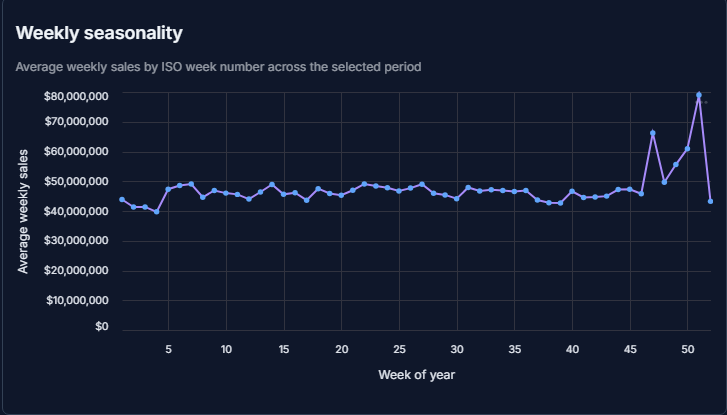
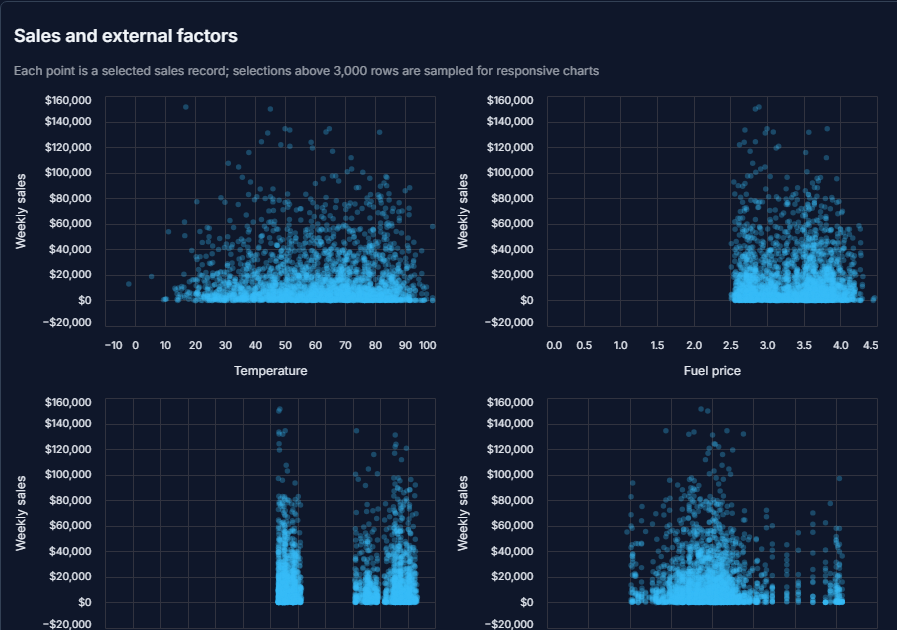
- Trends & External Factors — Seasonality, holiday impact and relationships between sales and macroeconomic variables
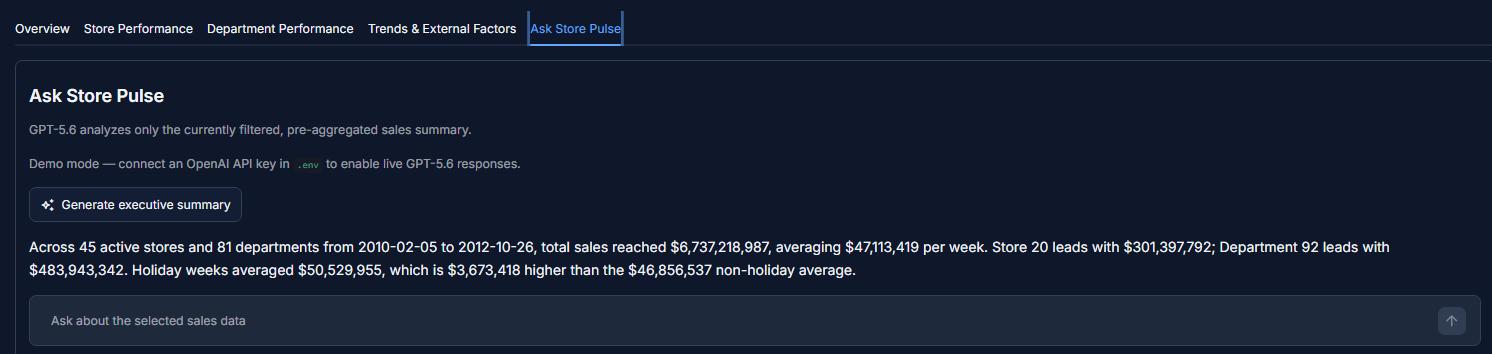
- Ask Store Pulse — GPT-5.6-powered natural language analytics that generates executive summaries and answers follow-up questions
How we built it
The project was developed using Codex (GPT-5.6) as the primary development environment.
Key components include:
- Automated ETL pipeline for extraction, transformation, validation and loading
- PostgreSQL database hosted through Supabase
- Interactive analytics dashboard built with Streamlit
- GPT-5.6 integration for natural-language business insights
Team responsibilities were divided across:
- Database architecture and Supabase setup
- ETL pipeline and validation framework
- Dashboard development, monitoring and AI integration
To improve scalability, the AI layer never receives raw transactional data. Instead, the application computes business aggregates (sales totals, top stores, department rankings, holiday comparisons, etc.) before sending a compact summary to the model.
This reduces token usage from approximately (O(n)) raw records to (O(1)) aggregated statistics, resulting in lower cost, faster responses and improved privacy.
A deterministic Demo Mode was also implemented. When no OpenAI API key is available, the application generates identical analytical summaries using precomputed aggregates, allowing the entire system to run without external API access.
Challenges
Building on real retail data introduced several engineering challenges:
- Inconsistent schemas and date formats across multiple source files
- Missing values requiring context-aware validation strategies
- Platform-specific issues between Windows and cross-platform environments
- Streamlit rendering bugs caused by DataFrame state management
- Cache invalidation and import conflicts during rapid development
- Markdown rendering issues where currency values containing
$were interpreted as LaTeX expressions - Session-state persistence problems causing AI summaries to disappear after user interactions
- Merge conflicts and data consistency challenges while collaborating on a shared GitHub repository
Each issue strengthened the robustness and maintainability of the final system.
Accomplishments
We successfully delivered a complete analytics platform rather than an isolated prototype.
Major achievements include:
- Automated multi-source ETL pipeline
- Schema-driven validation with row-level error reporting
- Incremental database loading with cell-level change tracking
- Interactive 5-tab business intelligence dashboard
- AI-generated insights grounded in validated analytical data
- Offline Demo Mode enabling full evaluation without OpenAI API credentials
The resulting system is reproducible, scalable and suitable for real-world analytical workflows.
What we learned
This project reinforced that successful data engineering depends far more on handling edge cases than implementing ideal workflows.
Key lessons included:
- Designing resilient ETL pipelines for imperfect data
- Building reliable validation and monitoring processes
- Collaborating effectively on shared databases and codebases
- Optimizing AI systems through intelligent data aggregation instead of transmitting raw datasets
- Improving application reliability with graceful fallback mechanisms
What's next
Future enhancements include:
- Sales forecasting using historical demand patterns
- Automated anomaly detection for stores and departments
- Scheduled ETL execution for continuous data refresh
- Expanded AI capabilities with proactive business recommendations
- Additional forecasting and operational KPI dashboards
Built With
- ai
- api
- artificial
- business
- codex
- csv
- data
- engineering
- etl
- generative
- git
- github
- gpt-5.6
- intelligence
- numpy
- openai
- pandas
- plotly
- postgresql
- python
- responses
- sqlalchemy
- streamlit
- supabase
- visualization

Log in or sign up for Devpost to join the conversation.