-
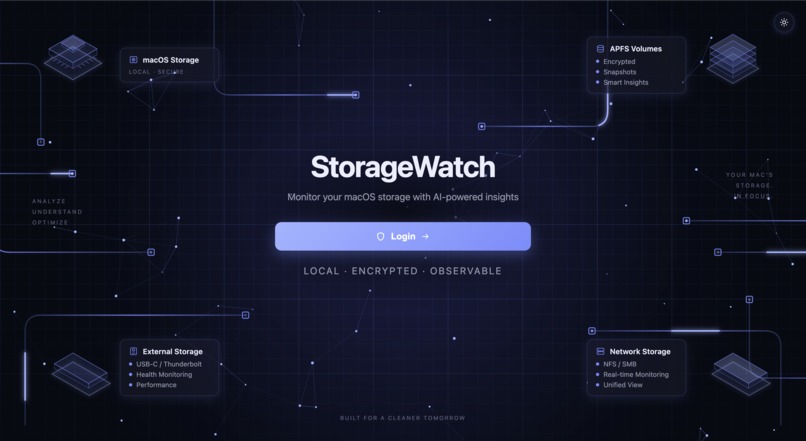
login page
-
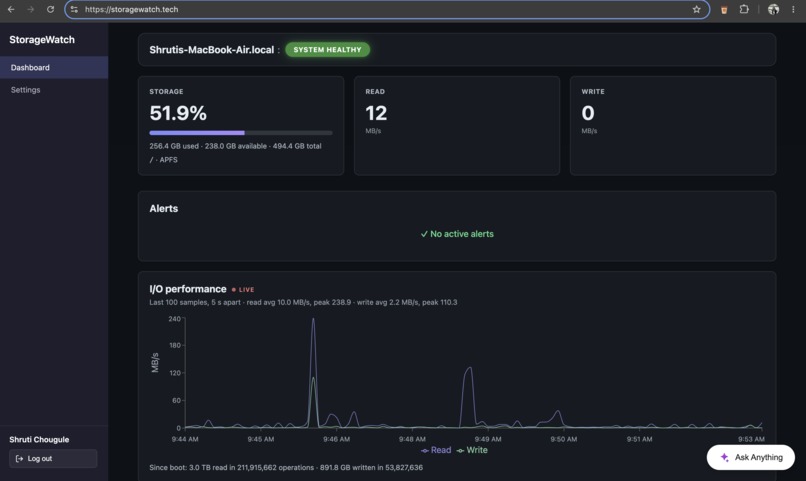
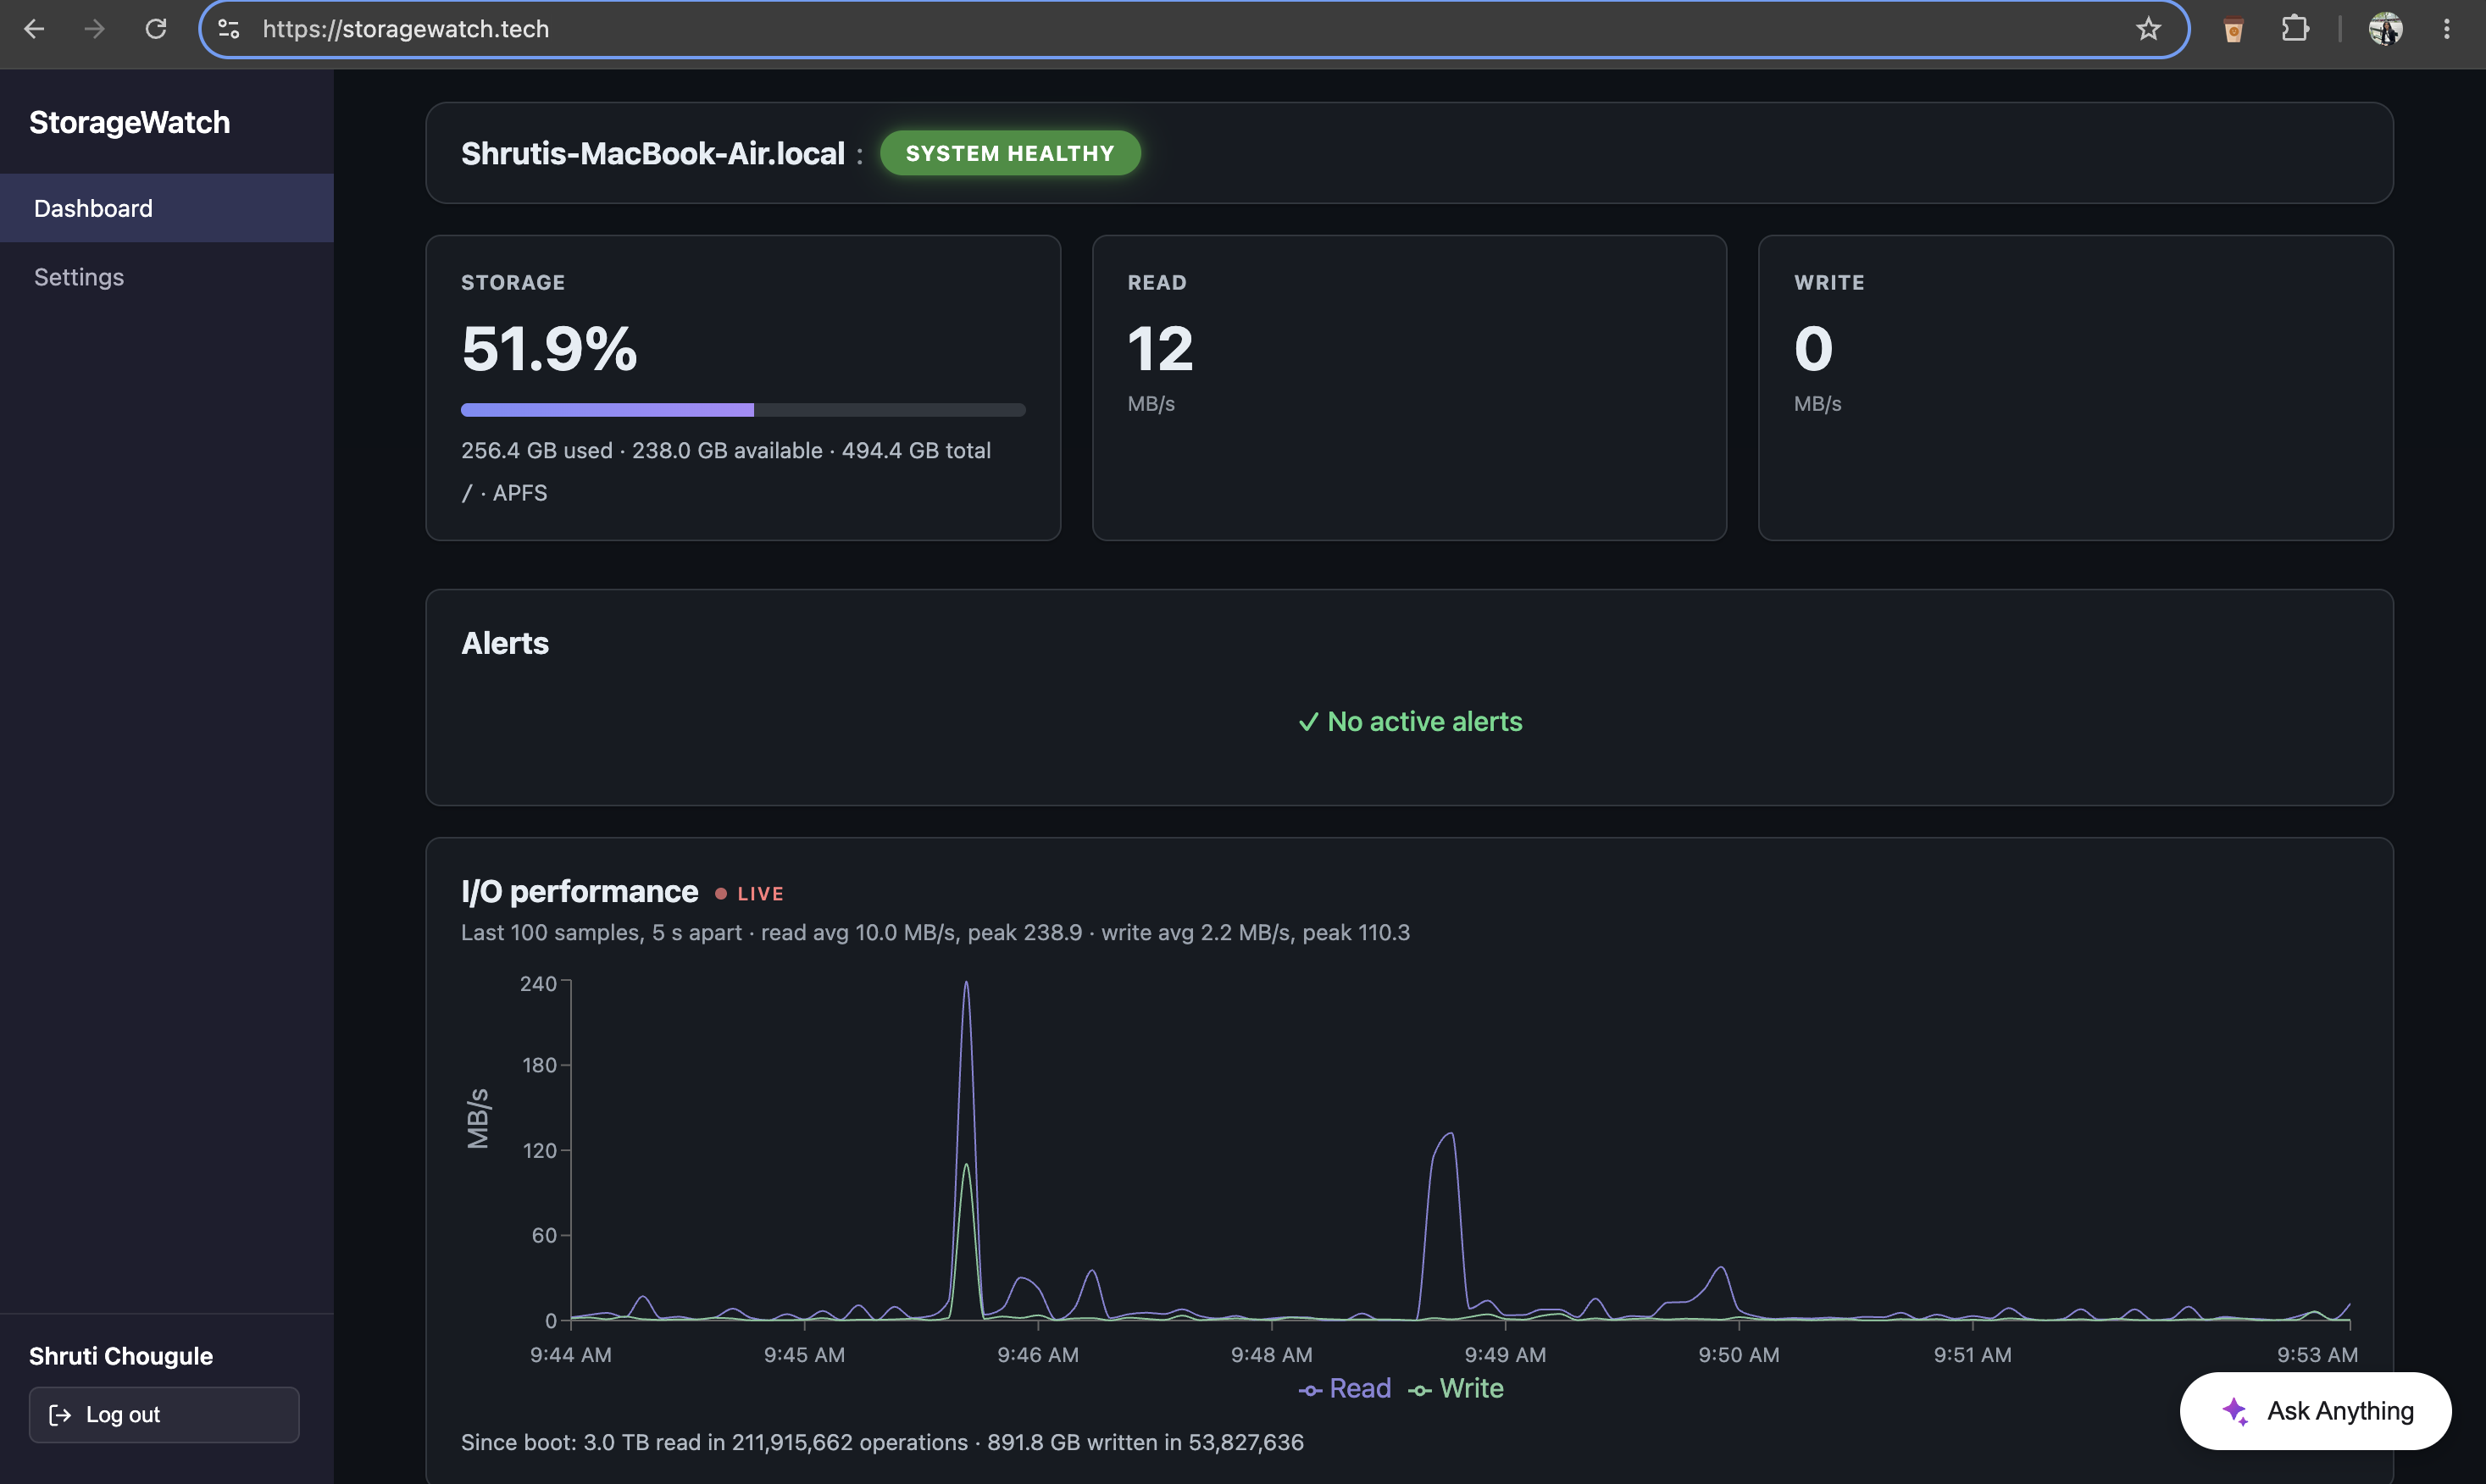
main dashboard
-
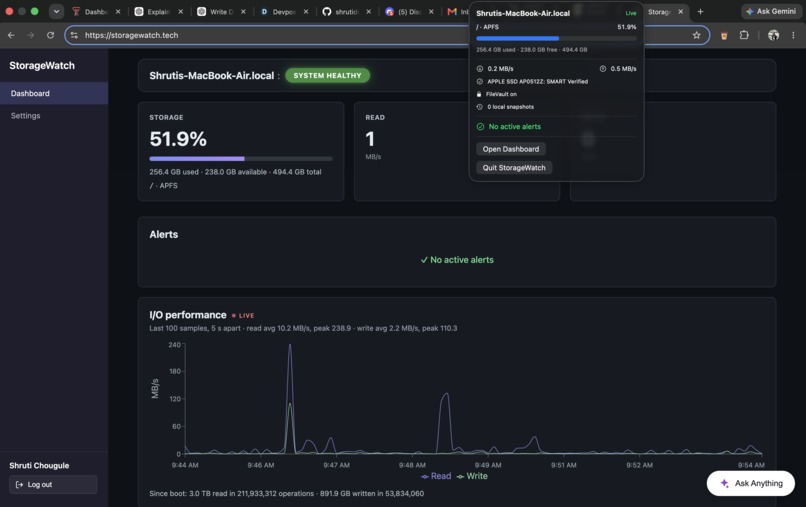
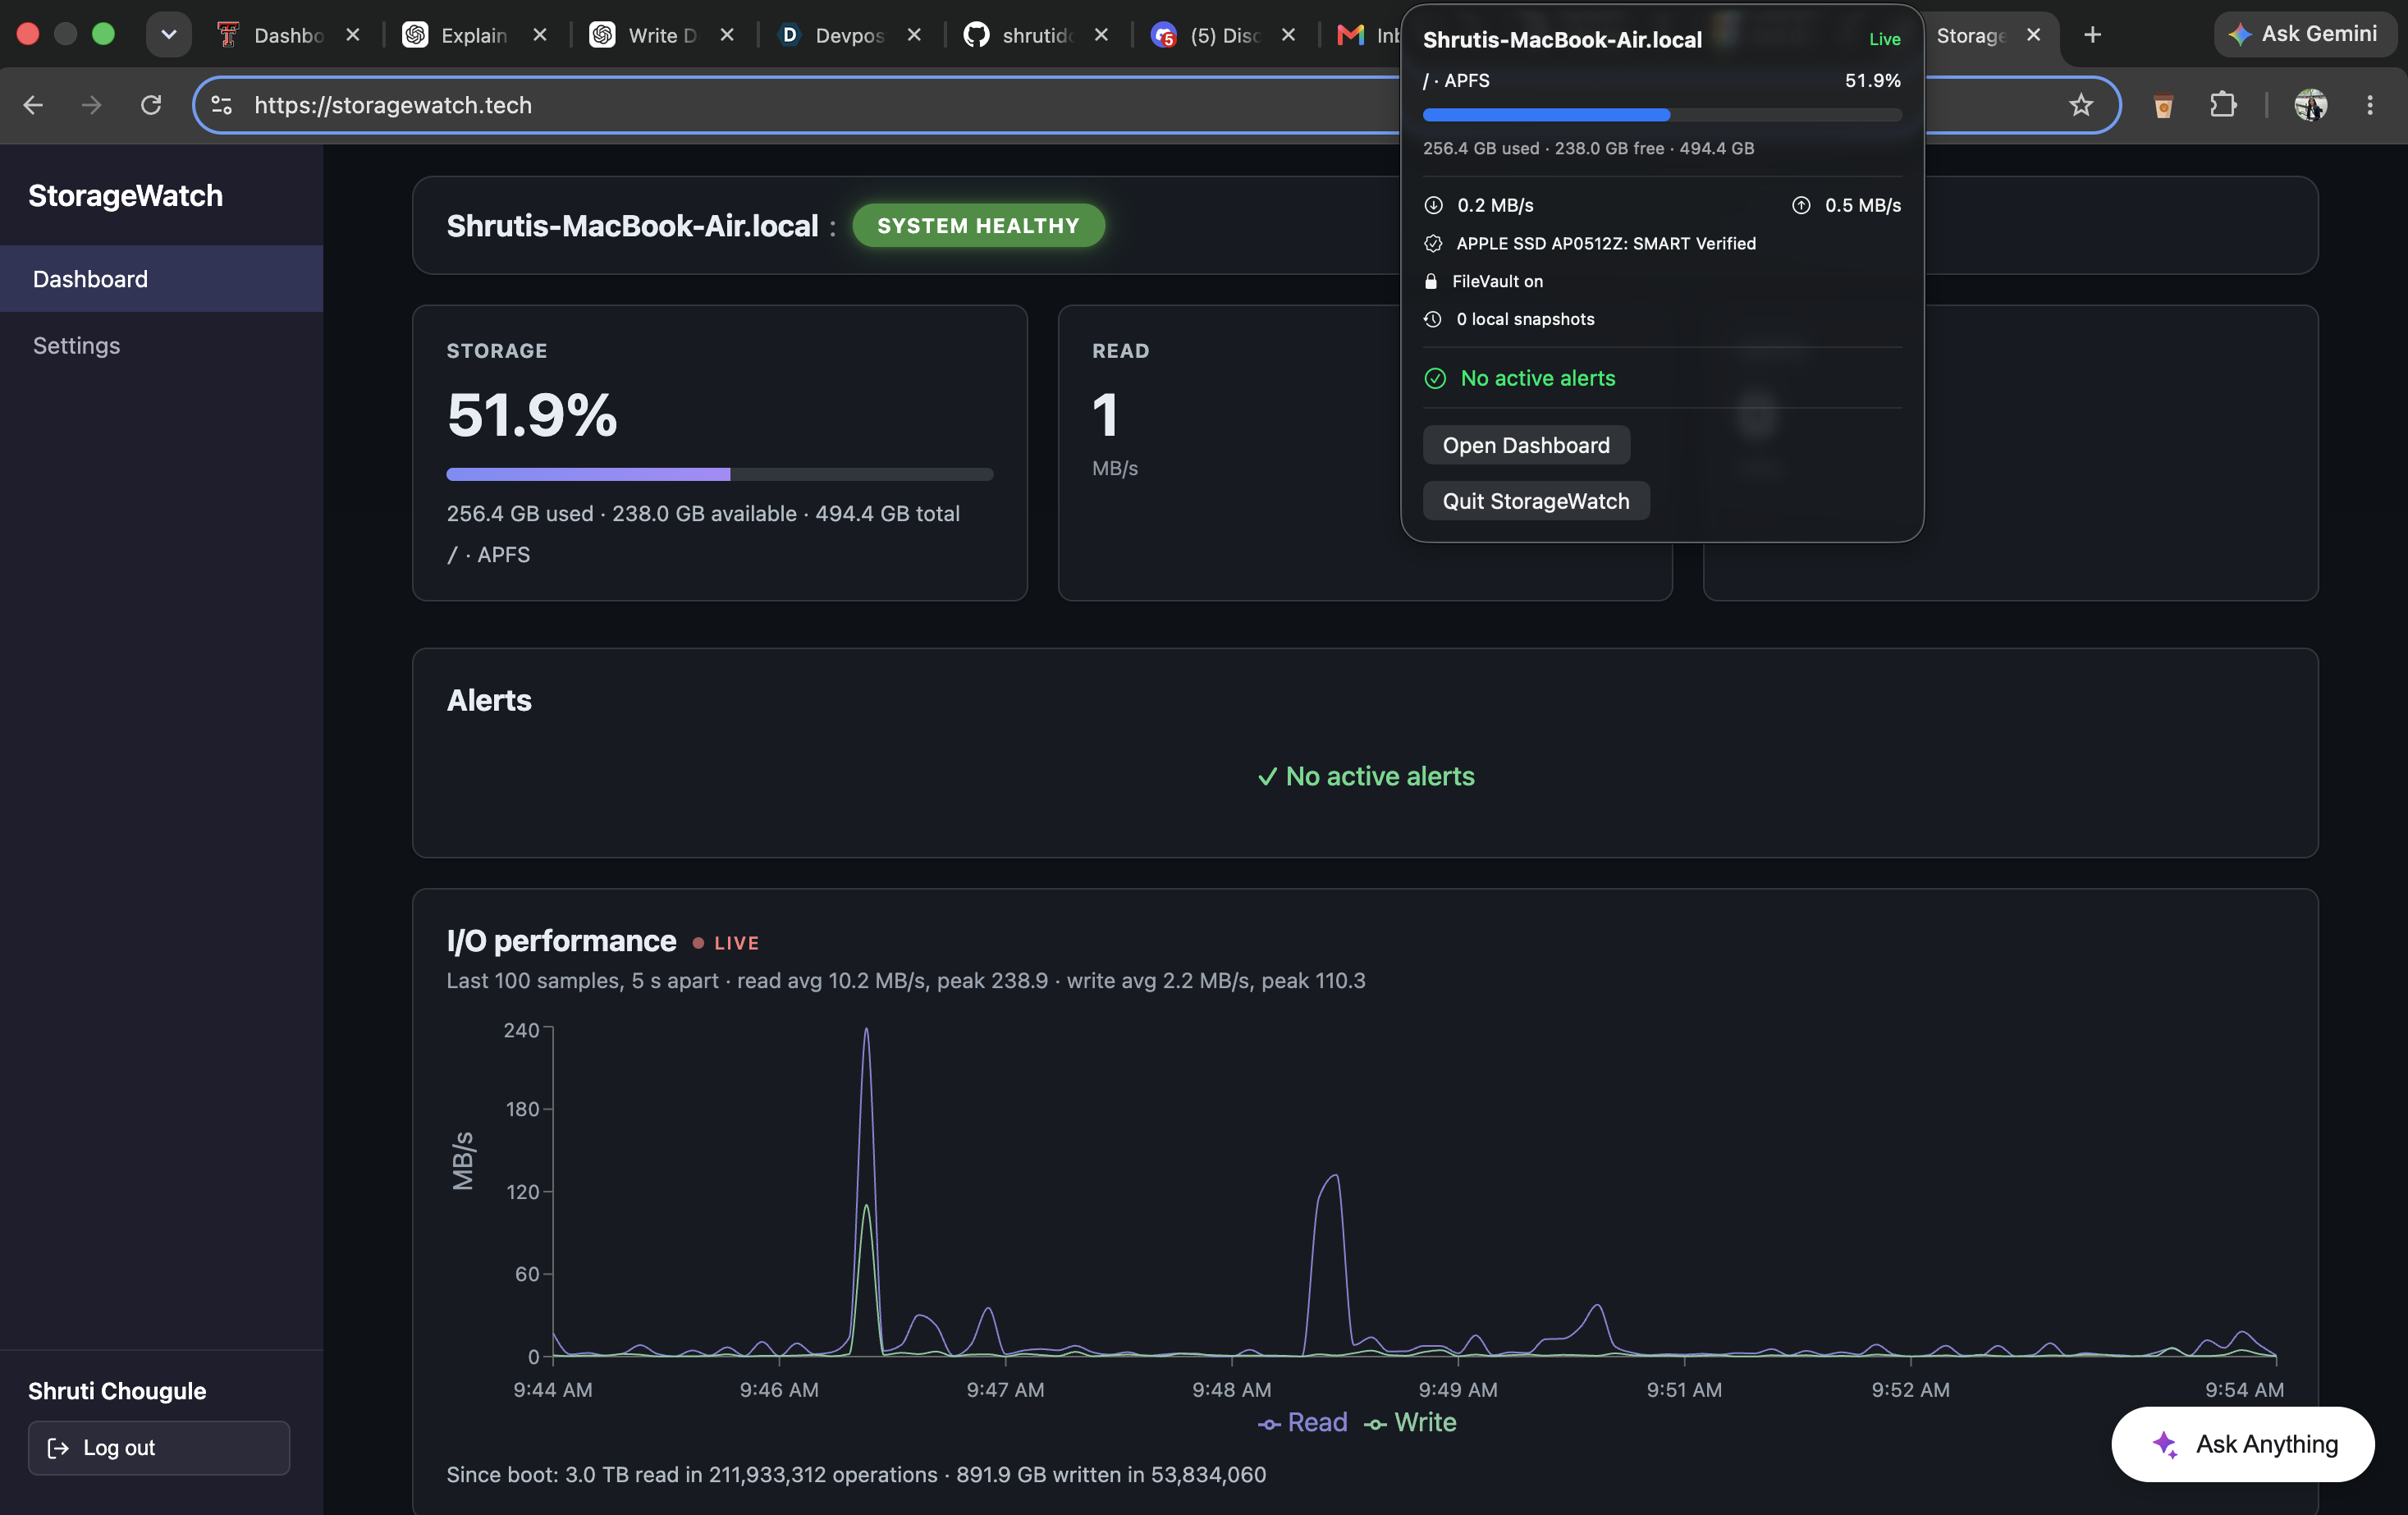
menu bar setting
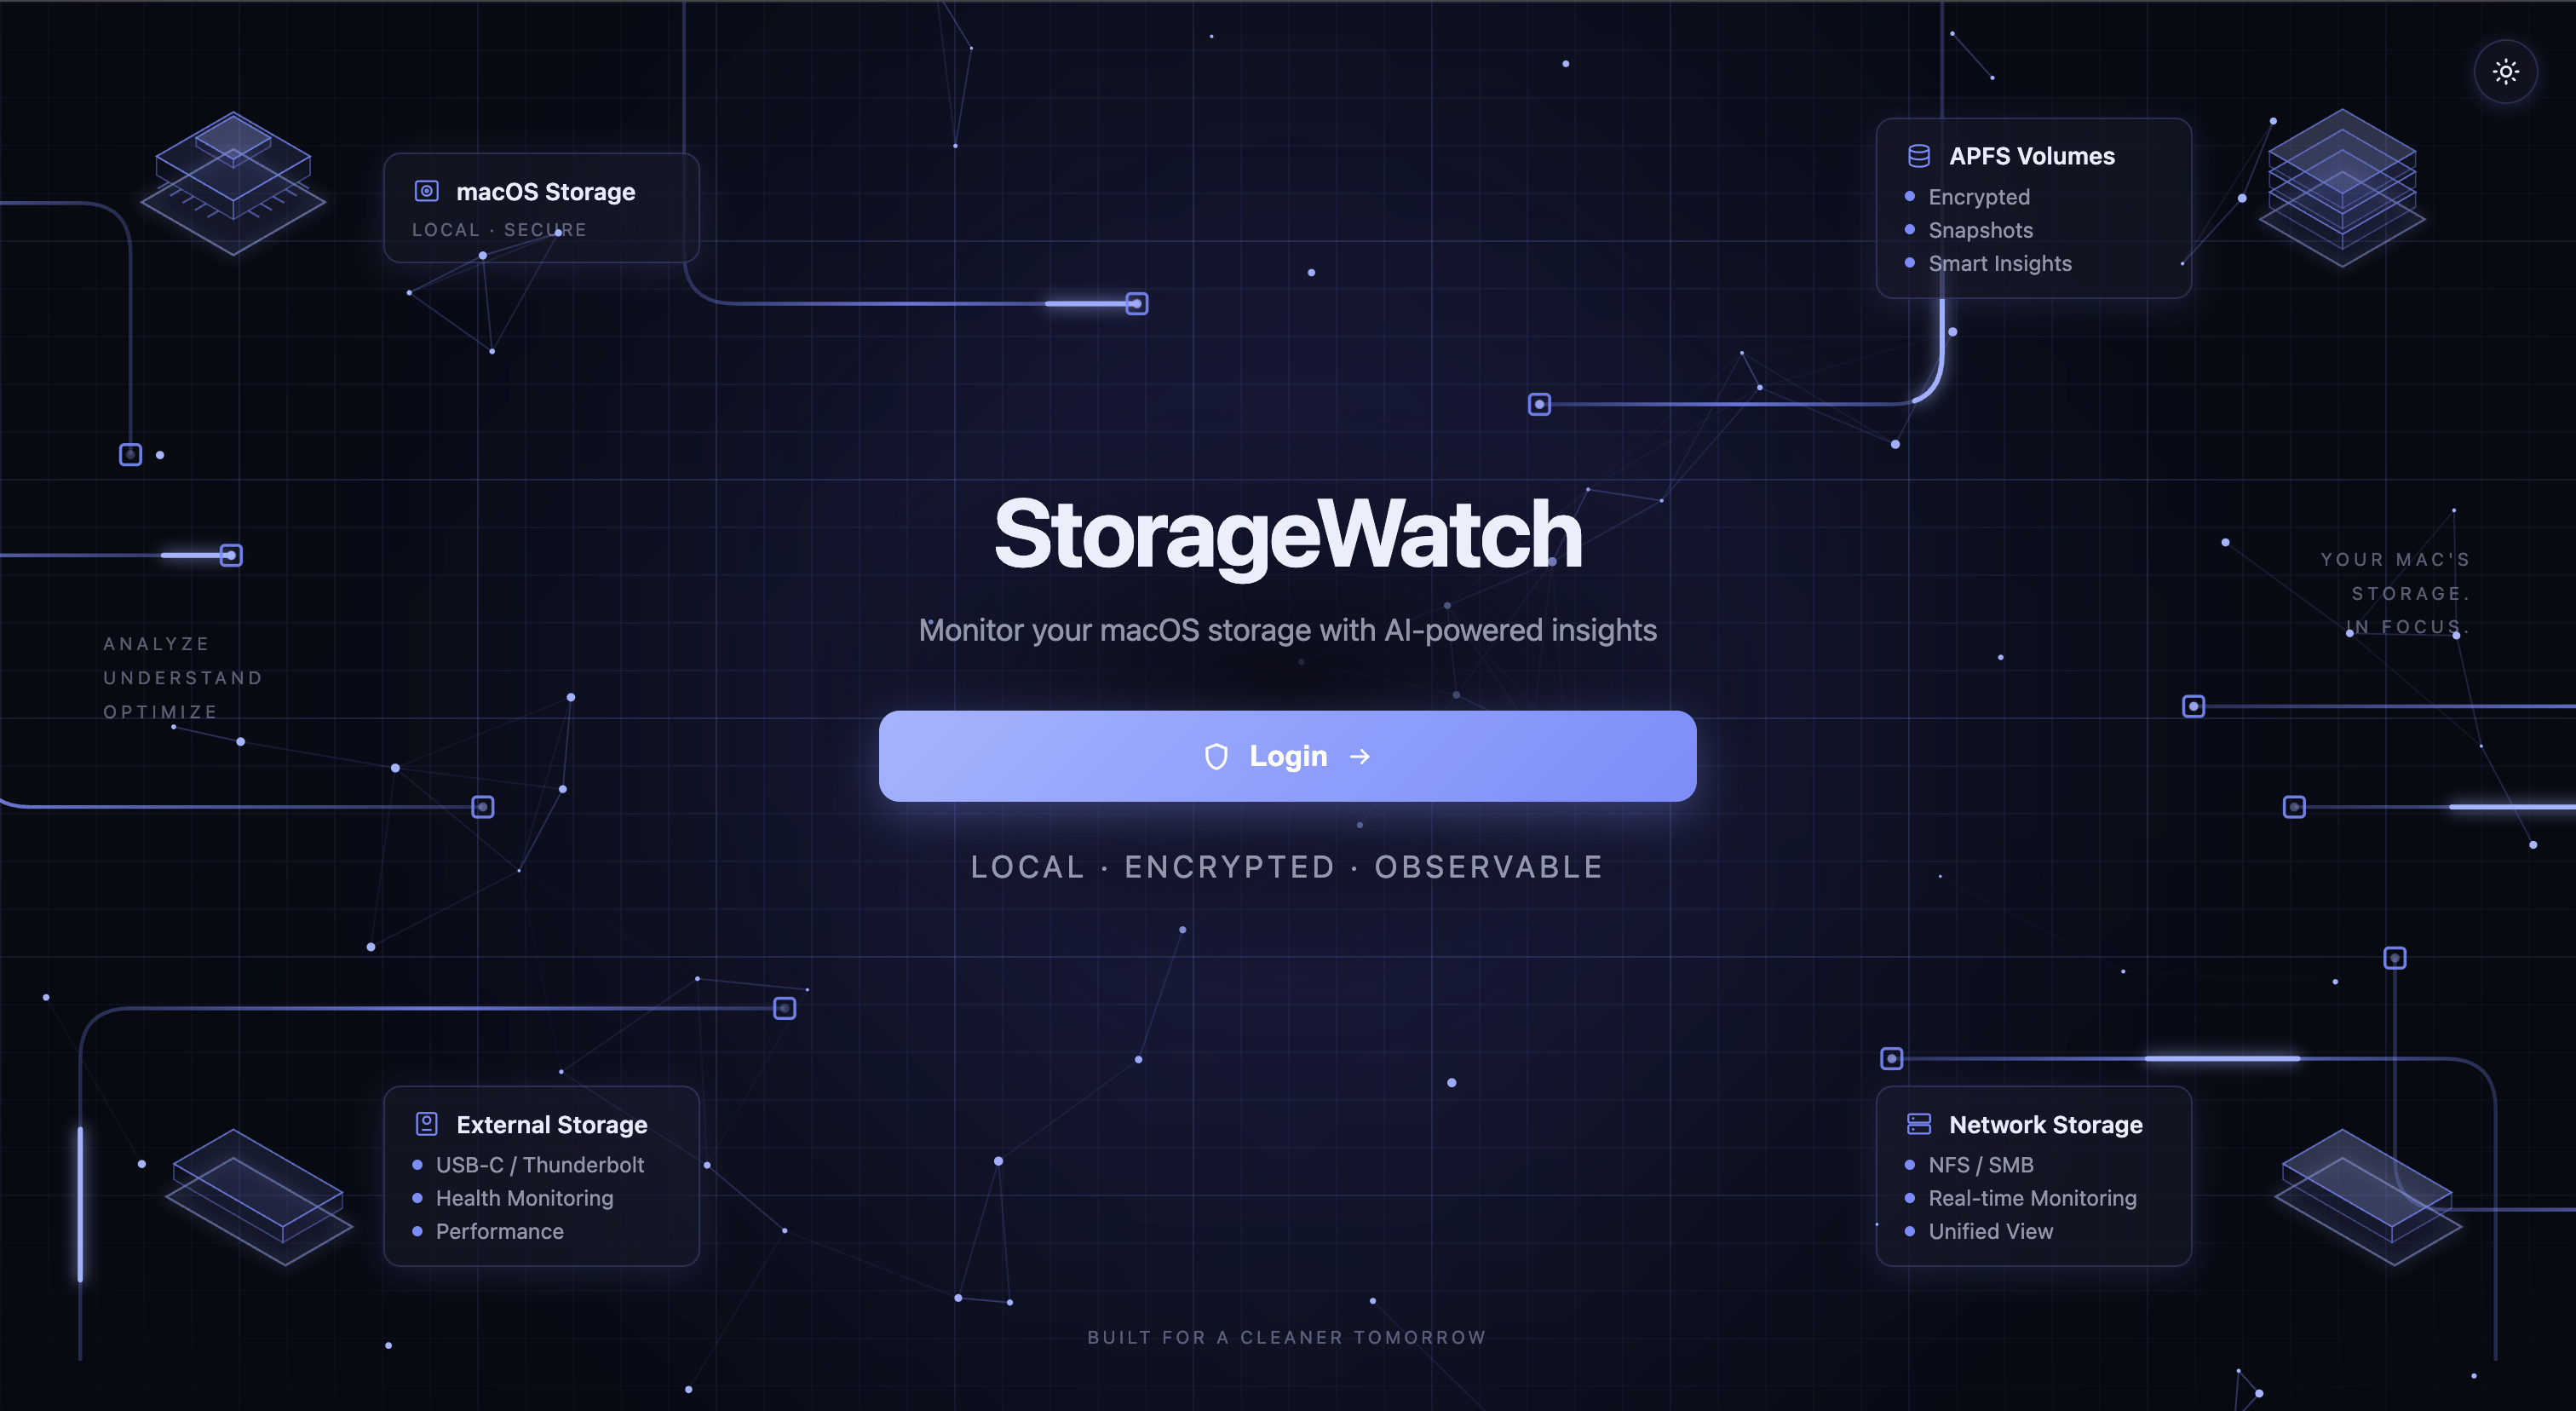
StorageWatch
Real-time storage observability for private AI on macOS.
StorageWatch is a macOS filesystem observability platform designed for organizations and developers running private or local AI workloads. It continuously monitors storage capacity, disk I/O, APFS volumes, disk health, shared network storage, users, and system activity, then turns that telemetry into real-time dashboards, alerts, historical analysis, and AI-assisted explanations.
Inspiration
Private AI is becoming increasingly practical on local hardware, especially Apple Silicon. However, local AI workloads can place significant pressure on storage. Models, vector databases, embeddings, documents, datasets, checkpoints, logs, and generated outputs can consume enormous amounts of disk space and create heavy read and write activity.
When something goes wrong, diagnosing the issue on macOS often means jumping between several command-line utilities and manually interpreting the results. A system administrator may know an AI workload is slowing down, but not immediately know whether the cause is low disk space, unusual write activity, a failing disk, or unavailable shared storage.
We built StorageWatch to bring those signals together in one place.
Our goal was to give administrators visibility into storage problems before those problems begin affecting private AI workloads.
What it does
StorageWatch uses a lightweight monitoring agent running directly on a Mac to collect storage telemetry.
It can monitor information such as:
- Storage capacity and remaining disk space
- Real-time disk read and write throughput
- APFS filesystems and volumes
- Physical disk information
- Disk health and I/O activity
- Shared storage
- Historical storage performance
- Abnormal write activity
- Storage-related alerts
The collected information is sent to the StorageWatch backend and displayed through a React dashboard.
StorageWatch evaluates incoming telemetry and can warn administrators when storage behavior becomes abnormal, such as when:
- A filesystem approaches its capacity limit
- Write activity suddenly increases
- Disk activity differs significantly from its recent baseline
- Storage-related problems may begin affecting AI workloads
Administrators can also use StorageWatch's AI functionality to understand unusual events. Instead of receiving only a warning or graph, the AI receives real infrastructure telemetry and explains what happened, possible causes, severity, and what the administrator should investigate.
How we built it
StorageWatch was designed as a distributed monitoring system rather than a monitoring script running entirely on one machine.
macOS monitoring agent
The first component is a lightweight Python collector that runs directly on the Mac being monitored.
This separation was important because the cloud backend cannot directly inspect storage that physically exists on a user's Mac. Instead, the local agent measures the machine and pushes telemetry securely to the remote service.
The collector gathers filesystem capacity, APFS information, and disk I/O performance using Python and native macOS system tools.
It periodically sends this information as JSON through HTTPS to the StorageWatch backend.
FastAPI backend
We built the API layer using Python and FastAPI.
The backend is responsible for:
- Receiving telemetry from Macs
- Validating incoming measurements
- Storing historical telemetry
- Serving current and historical data to the frontend
- Running alert and anomaly rules
- Communicating with the AI layer
- Managing authenticated access to infrastructure data
Tiger Data / TimescaleDB
Storage monitoring naturally produces time-series information.
A machine might report:
12:00:00 → 75 MB/s
12:00:05 → 120 MB/s
12:00:10 → 950 MB/s
Because these measurements are timestamped and continuously produced, we designed StorageWatch around Tiger Data / TimescaleDB for historical telemetry.
This allows us to compare current behavior with previous activity rather than looking only at the current state of the machine.
React dashboard
The frontend is built using React and Vite.
The dashboard translates raw infrastructure measurements into an interface where administrators can quickly understand:
- Current storage utilization
- Available storage
- Read throughput
- Write throughput
- Historical I/O behavior
- System status
- Alerts
- AI-generated explanations
Backboard and AI analysis
We integrated Backboard as the AI analysis layer.
Rather than building a general-purpose chatbot into StorageWatch, our goal was to ground the model using real telemetry from the monitored system.
For example, StorageWatch can provide the AI with:
- Current storage utilization
- Current write throughput
- Recent average throughput
- The detected anomaly
- Filesystem information
The AI can then explain the event and tell the administrator what they should investigate.
How we planned to use Vultr
Vultr was an important part of our original deployment architecture.
Our plan was to provision an Ubuntu virtual machine on Vultr and use it as the publicly accessible cloud layer for StorageWatch.
The planned architecture was:
Mac → Python Collector → HTTPS → Vultr → FastAPI → Tiger Data → React Dashboard
On the Vultr VM, we planned to run:
- The FastAPI backend
- The React production frontend
- Nginx as the reverse proxy
Nginx would serve the React application while forwarding requests beginning with /api to the FastAPI backend.
The local monitoring agent would remain on the Mac. This distinction was important: running the collector directly on Vultr would only monitor the Linux cloud server, not the actual Mac whose APFS storage supported the private AI workload.
Instead, the Mac would send telemetry to the Vultr-hosted API over HTTPS.
The planned network flow looked like:
macOS Agent
↓
HTTPS POST /api/metrics
↓
Vultr + Nginx
↓
FastAPI
↓
Tiger Data
The browser would then access the dashboard through our .tech domain, with authenticated API requests flowing back through the same Vultr-hosted infrastructure.
This architecture would have allowed StorageWatch to separate three concerns cleanly:
Local monitoring stayed close to the hardware.
Historical data lived in a purpose-built time-series database.
Application infrastructure lived remotely on Vultr so administrators could access StorageWatch from anywhere.
Vultr therefore wasn't meant to replace the monitored Mac. It was designed to be the bridge between locally collected telemetry and the remotely accessible monitoring dashboard.
Our original product requirements specifically called for the FastAPI backend to run on Vultr, with the Mac pushing measurements to that server rather than the server attempting to inspect the Mac remotely.
The deployment design used a Vultr Ubuntu VM with Nginx serving the React frontend and routing /api traffic to FastAPI.
Challenges we ran into
One of the biggest challenges was discovering that filesystem monitoring on macOS is not as straightforward as it initially appears.
Modern macOS systems use APFS, where multiple volumes can share space inside the same container. This means something as simple as calculating how much storage is actually available requires understanding the structure underneath the filesystem rather than blindly displaying a single value.
Disk I/O presented another challenge. We needed to convert cumulative system counters into meaningful throughput values that could be compared over time.
Monitoring also created an architectural challenge: the machine being observed and the infrastructure serving the application could not be treated as the same system.
That became especially important when designing our Vultr deployment. The collector had to stay on the Mac because moving it into the cloud would mean monitoring the cloud VM instead of the user's Apple hardware.
We therefore designed the application around push-based remote telemetry: the Mac observes itself and sends those measurements to the cloud.
Another challenge was making anomaly detection understandable.
For the hackathon version, we intentionally avoided calling our detection system machine learning. Instead, we designed a simple baseline-based approach that compares current activity against recent measurements.
For example, if recent writes average around 100 MB/s and suddenly reach 700 MB/s, StorageWatch can identify that the current activity is approximately seven times higher than normal.
This makes the alert easy for both administrators and judges to understand.
Accomplishments that we're proud of
We're proud that StorageWatch became more than a storage-usage widget.
We designed a complete observability pipeline:
Mac filesystem activity ↓ Local monitoring agent ↓ Remote telemetry ingestion ↓ Time-series history ↓ Real-time visualization ↓ Anomaly detection ↓ Administrator alert ↓ AI-assisted diagnosis
The goal throughout the project was to ensure this pipeline operates on actual machine telemetry rather than manually entered demo values. This end-to-end real-data flow was one of the primary success criteria in our product plan.
We're also proud of the way the architecture combines several technologies that each solve a different part of the problem:
- Python for local monitoring
- FastAPI for telemetry ingestion
- Tiger Data for time-series information
- React for visualization
- Auth0 for authentication
- Backboard for AI-assisted diagnosis
- Vultr as the planned cloud application infrastructure
.techfor the public application domain
What we learned
The biggest technical lesson was that observability requires understanding the system underneath the metrics.
At first, questions like “How full is the disk?” or “How fast is the disk writing?” seemed simple.
Once we started working with real macOS storage, we had to think about APFS, physical disks, cumulative I/O counters, historical baselines, remote telemetry, authentication, and failure scenarios.
We also learned a great deal about distributed-system architecture.
The machine collecting the data does not necessarily need to be the machine displaying or storing it.
That insight led to our Mac-to-cloud architecture: perform hardware-specific monitoring locally, transmit only the telemetry, store historical information remotely, and make the results securely accessible through a web application.
Planning the Vultr deployment helped us think through networking, reverse proxies, API routing, HTTPS communication, and the separation between the monitored infrastructure and the monitoring infrastructure.
Finally, we learned that AI becomes much more useful when it receives real context.
Instead of asking a model a vague question such as:
“Why is my computer slow?”
StorageWatch can give it measurable context such as:
“Storage is 82% full, write throughput is 820 MB/s, the recent baseline is 105 MB/s, and current activity is 7.8× above normal.”
That turns AI from a generic chatbot into an infrastructure troubleshooting assistant.
What's next for StorageWatch
StorageWatch began with one administrator monitoring one Mac, but the architecture can grow much further.
Future versions could include:
- Fleet-wide monitoring for multiple Macs and Mac Studios
- Team and organization accounts
- NFS and pNFS monitoring
- More advanced shared-storage monitoring
- Long-term behavioral baselines
- Capacity forecasting
- Process-level I/O attribution
- Machine-learning-based anomaly detection
- Slack, email, Teams, and PagerDuty alerts
- Configurable alert policies
- Historical incident summaries
- Self-hosted deployment options
- Automated Vultr infrastructure provisioning
- Multi-region deployment for organizations monitoring geographically distributed Mac infrastructure
The long-term goal is to turn StorageWatch into a lightweight observability platform for organizations building private AI infrastructure on Apple hardware.
Built With
Python · FastAPI · React · Vite · Swift · SwiftUI · PostgreSQL · TimescaleDB · Tiger Data · Auth0 · Backboard · Gemini · Vultr · Nginx · Docker · macOS · APFS

Log in or sign up for Devpost to join the conversation.