-
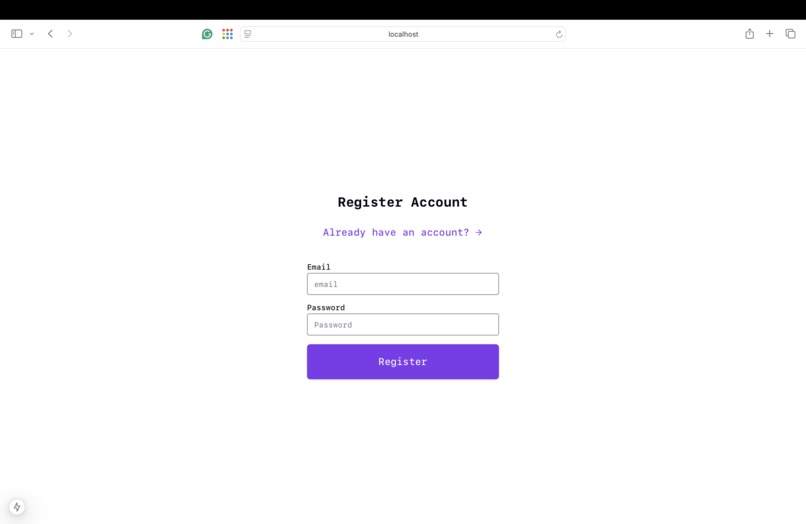
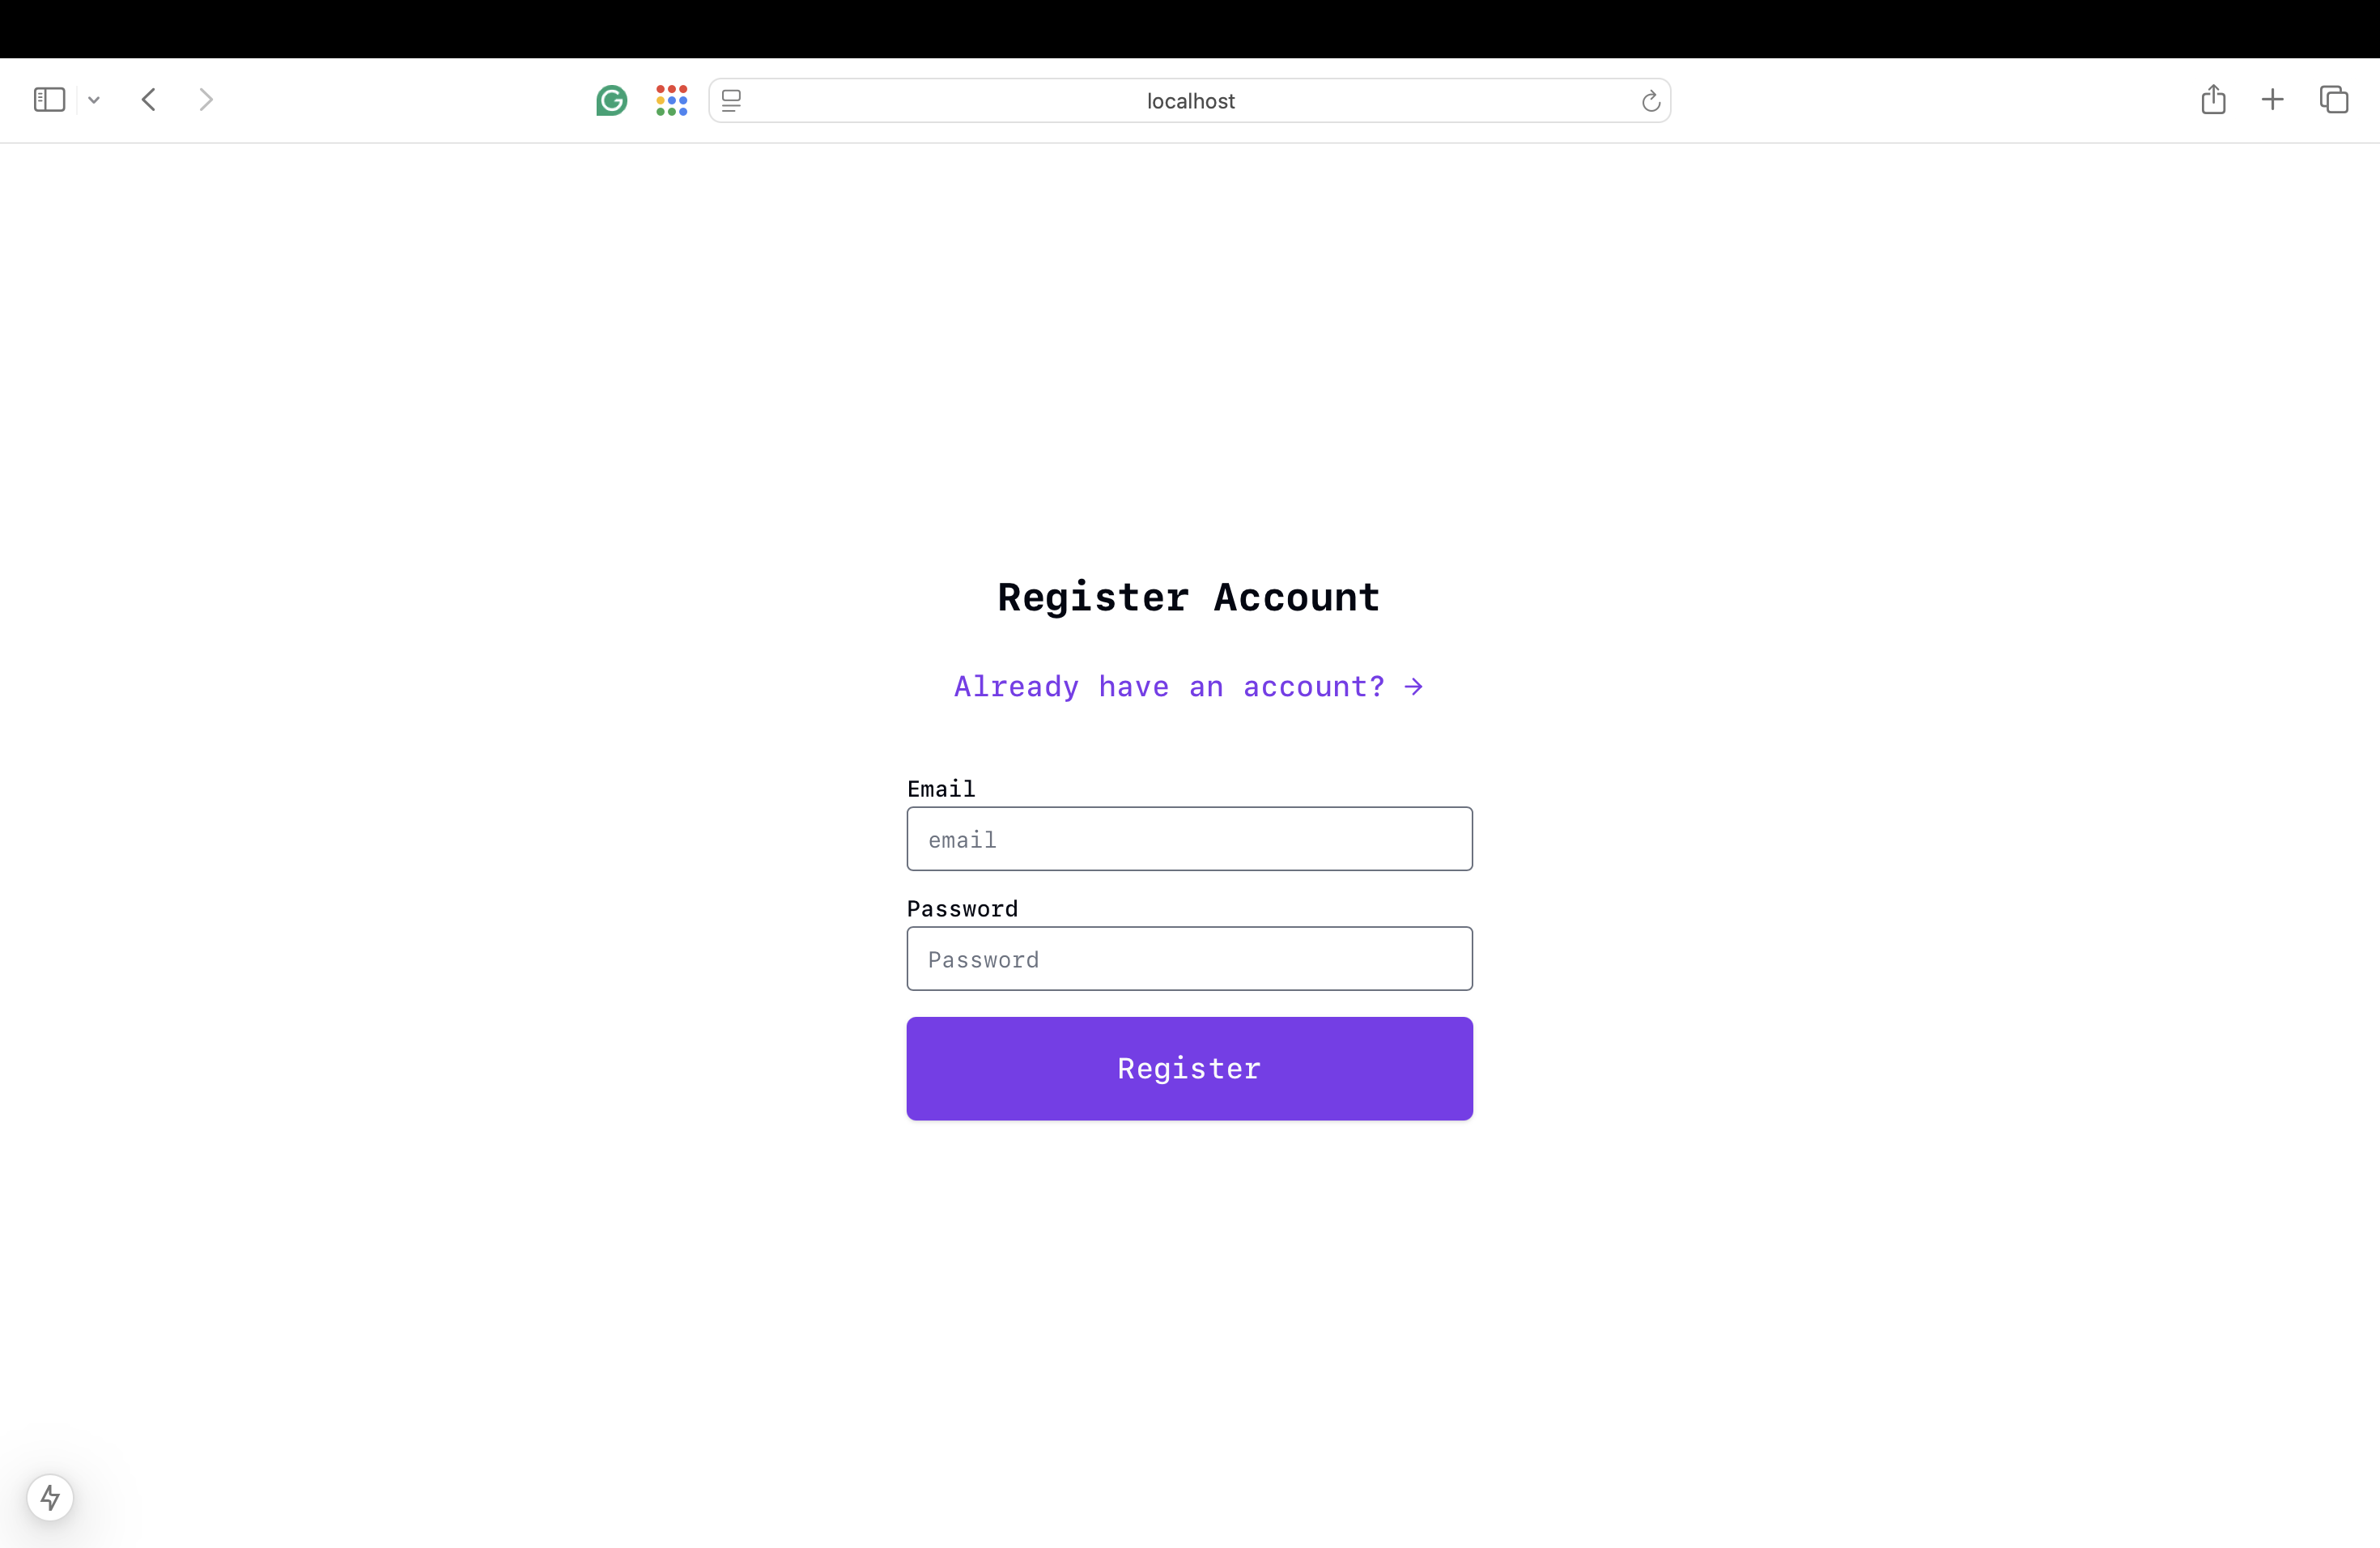
Registration page
-
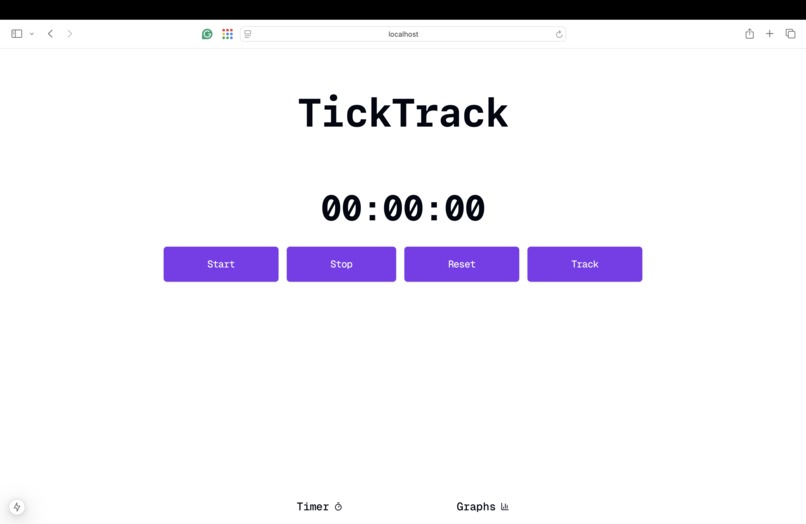
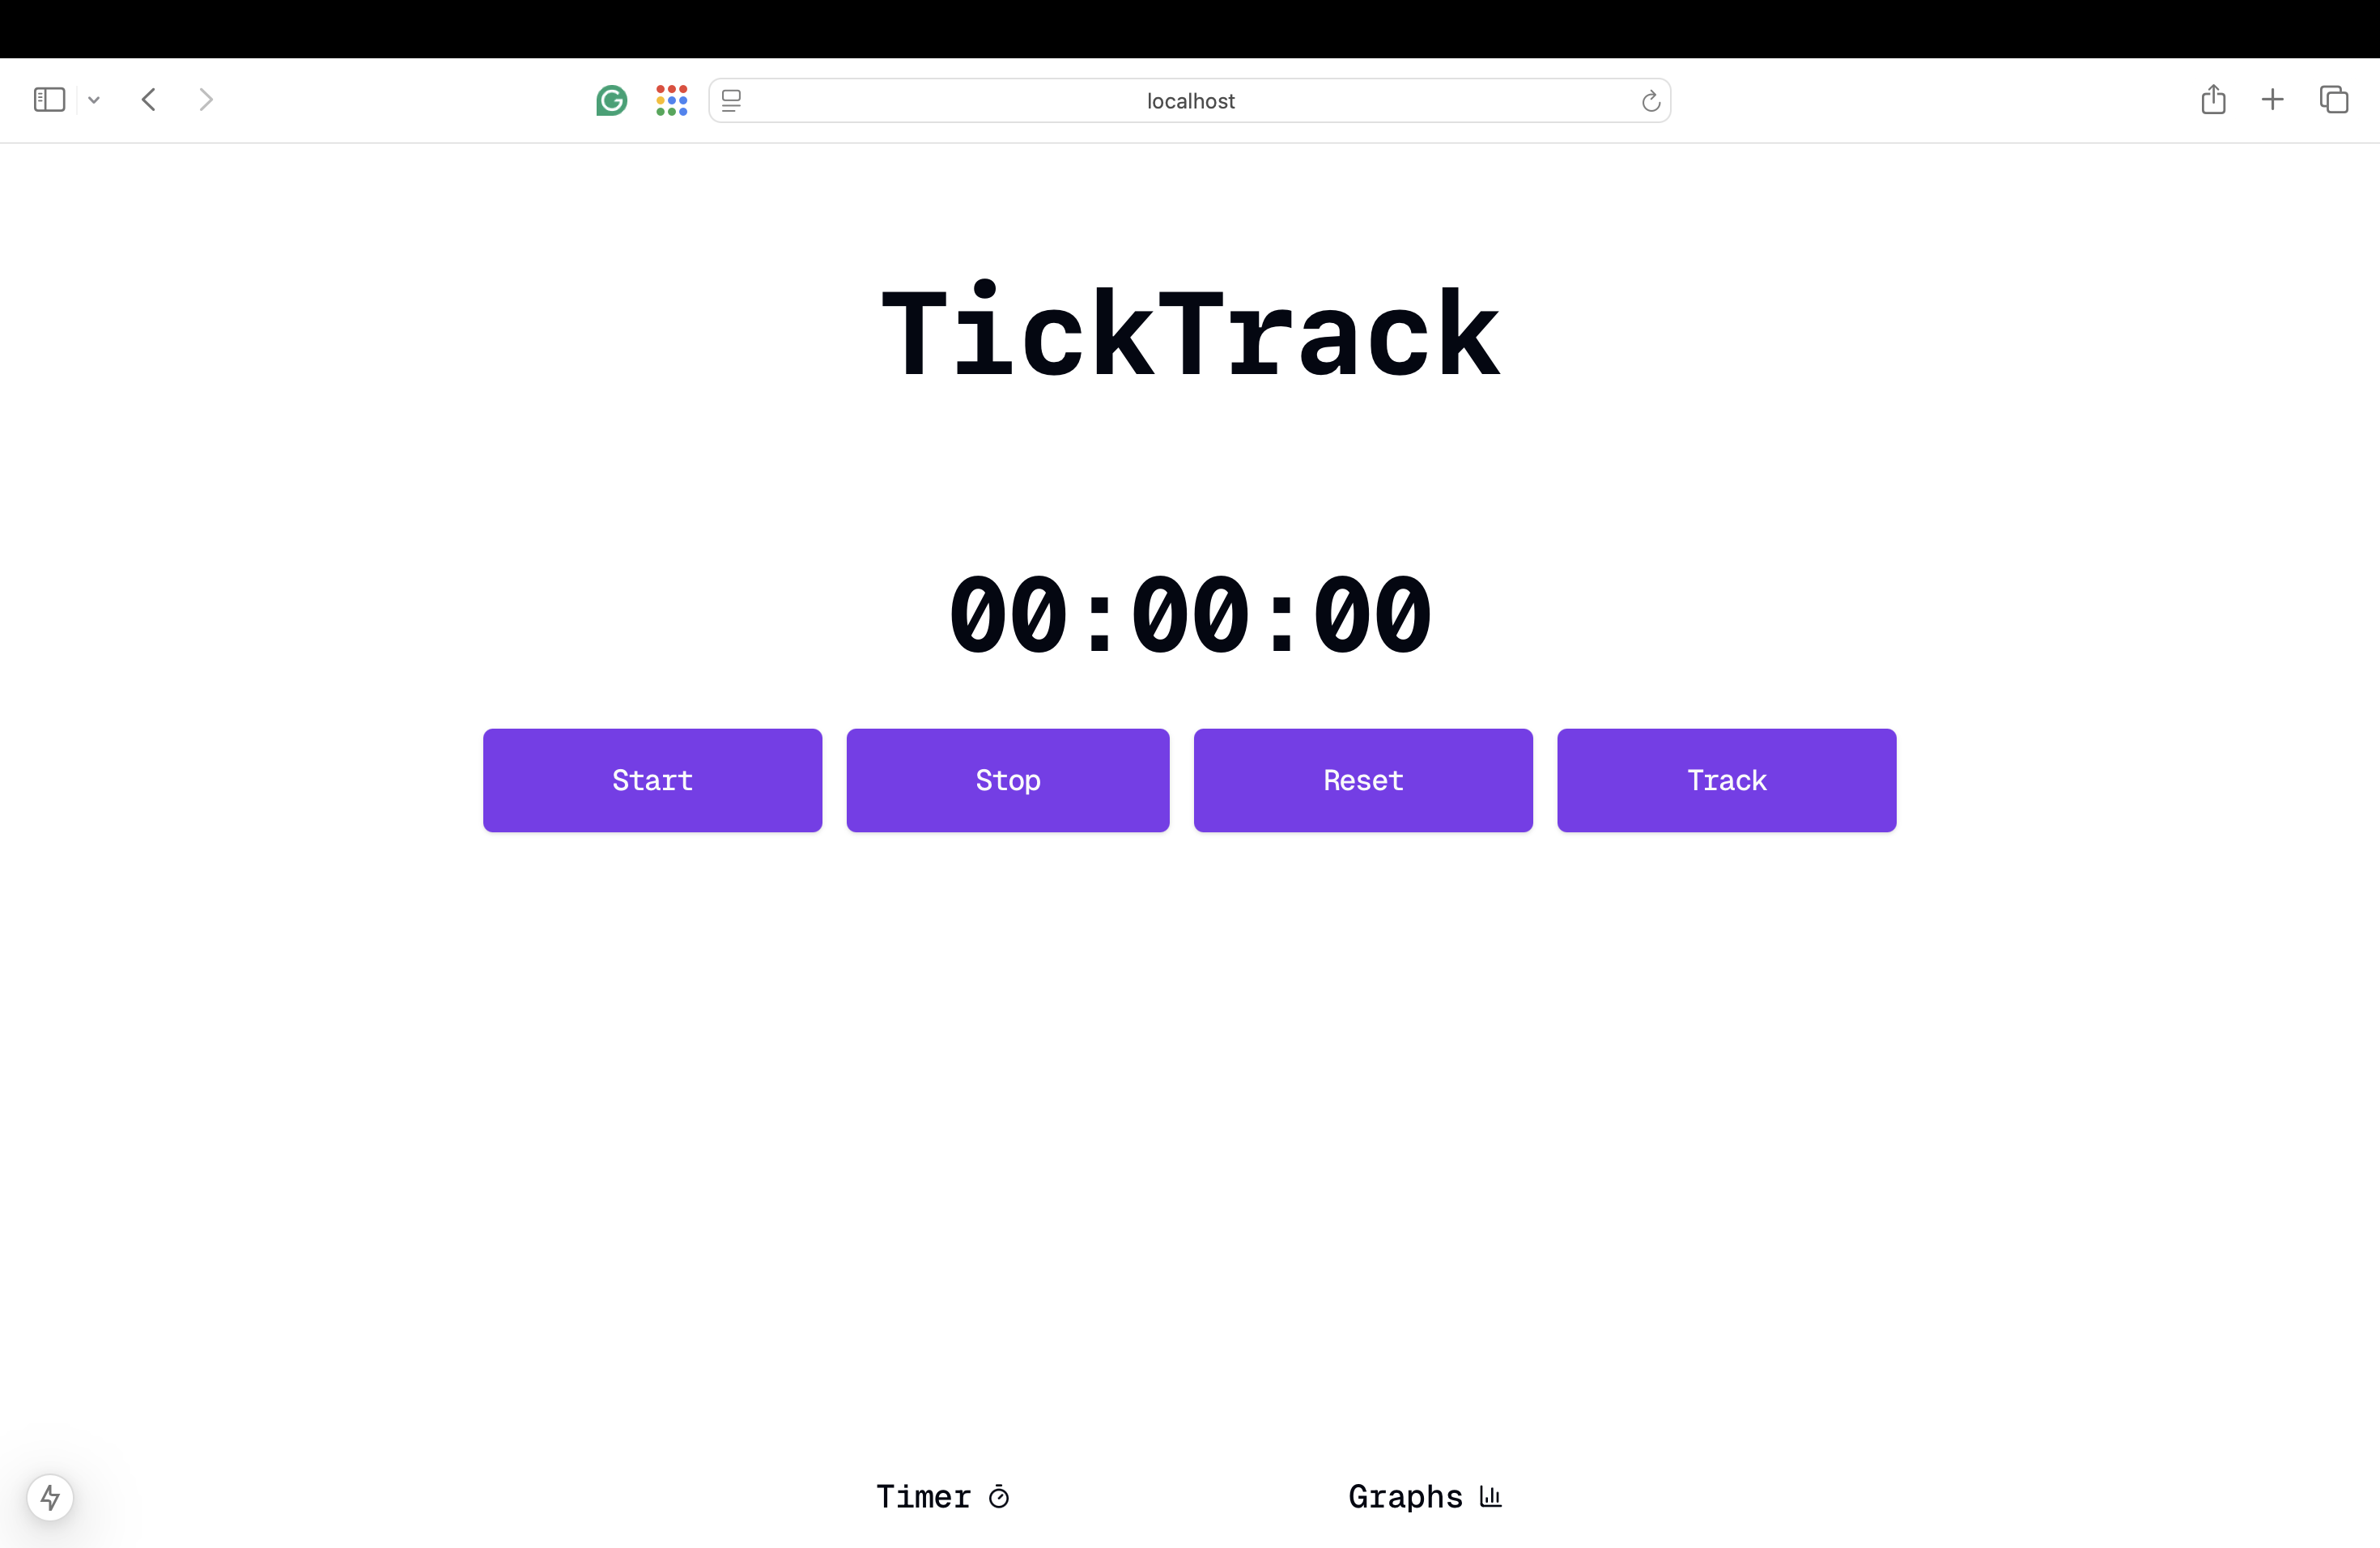
Timer tab
-
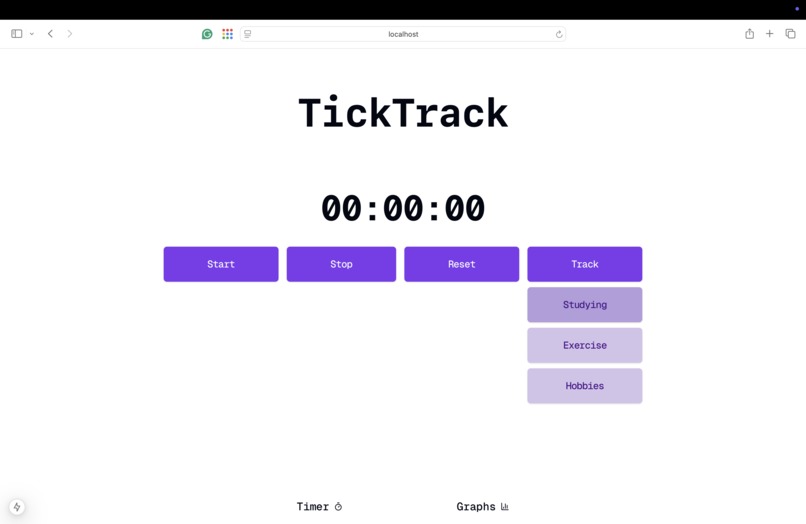
Drop down menu with different activities
-

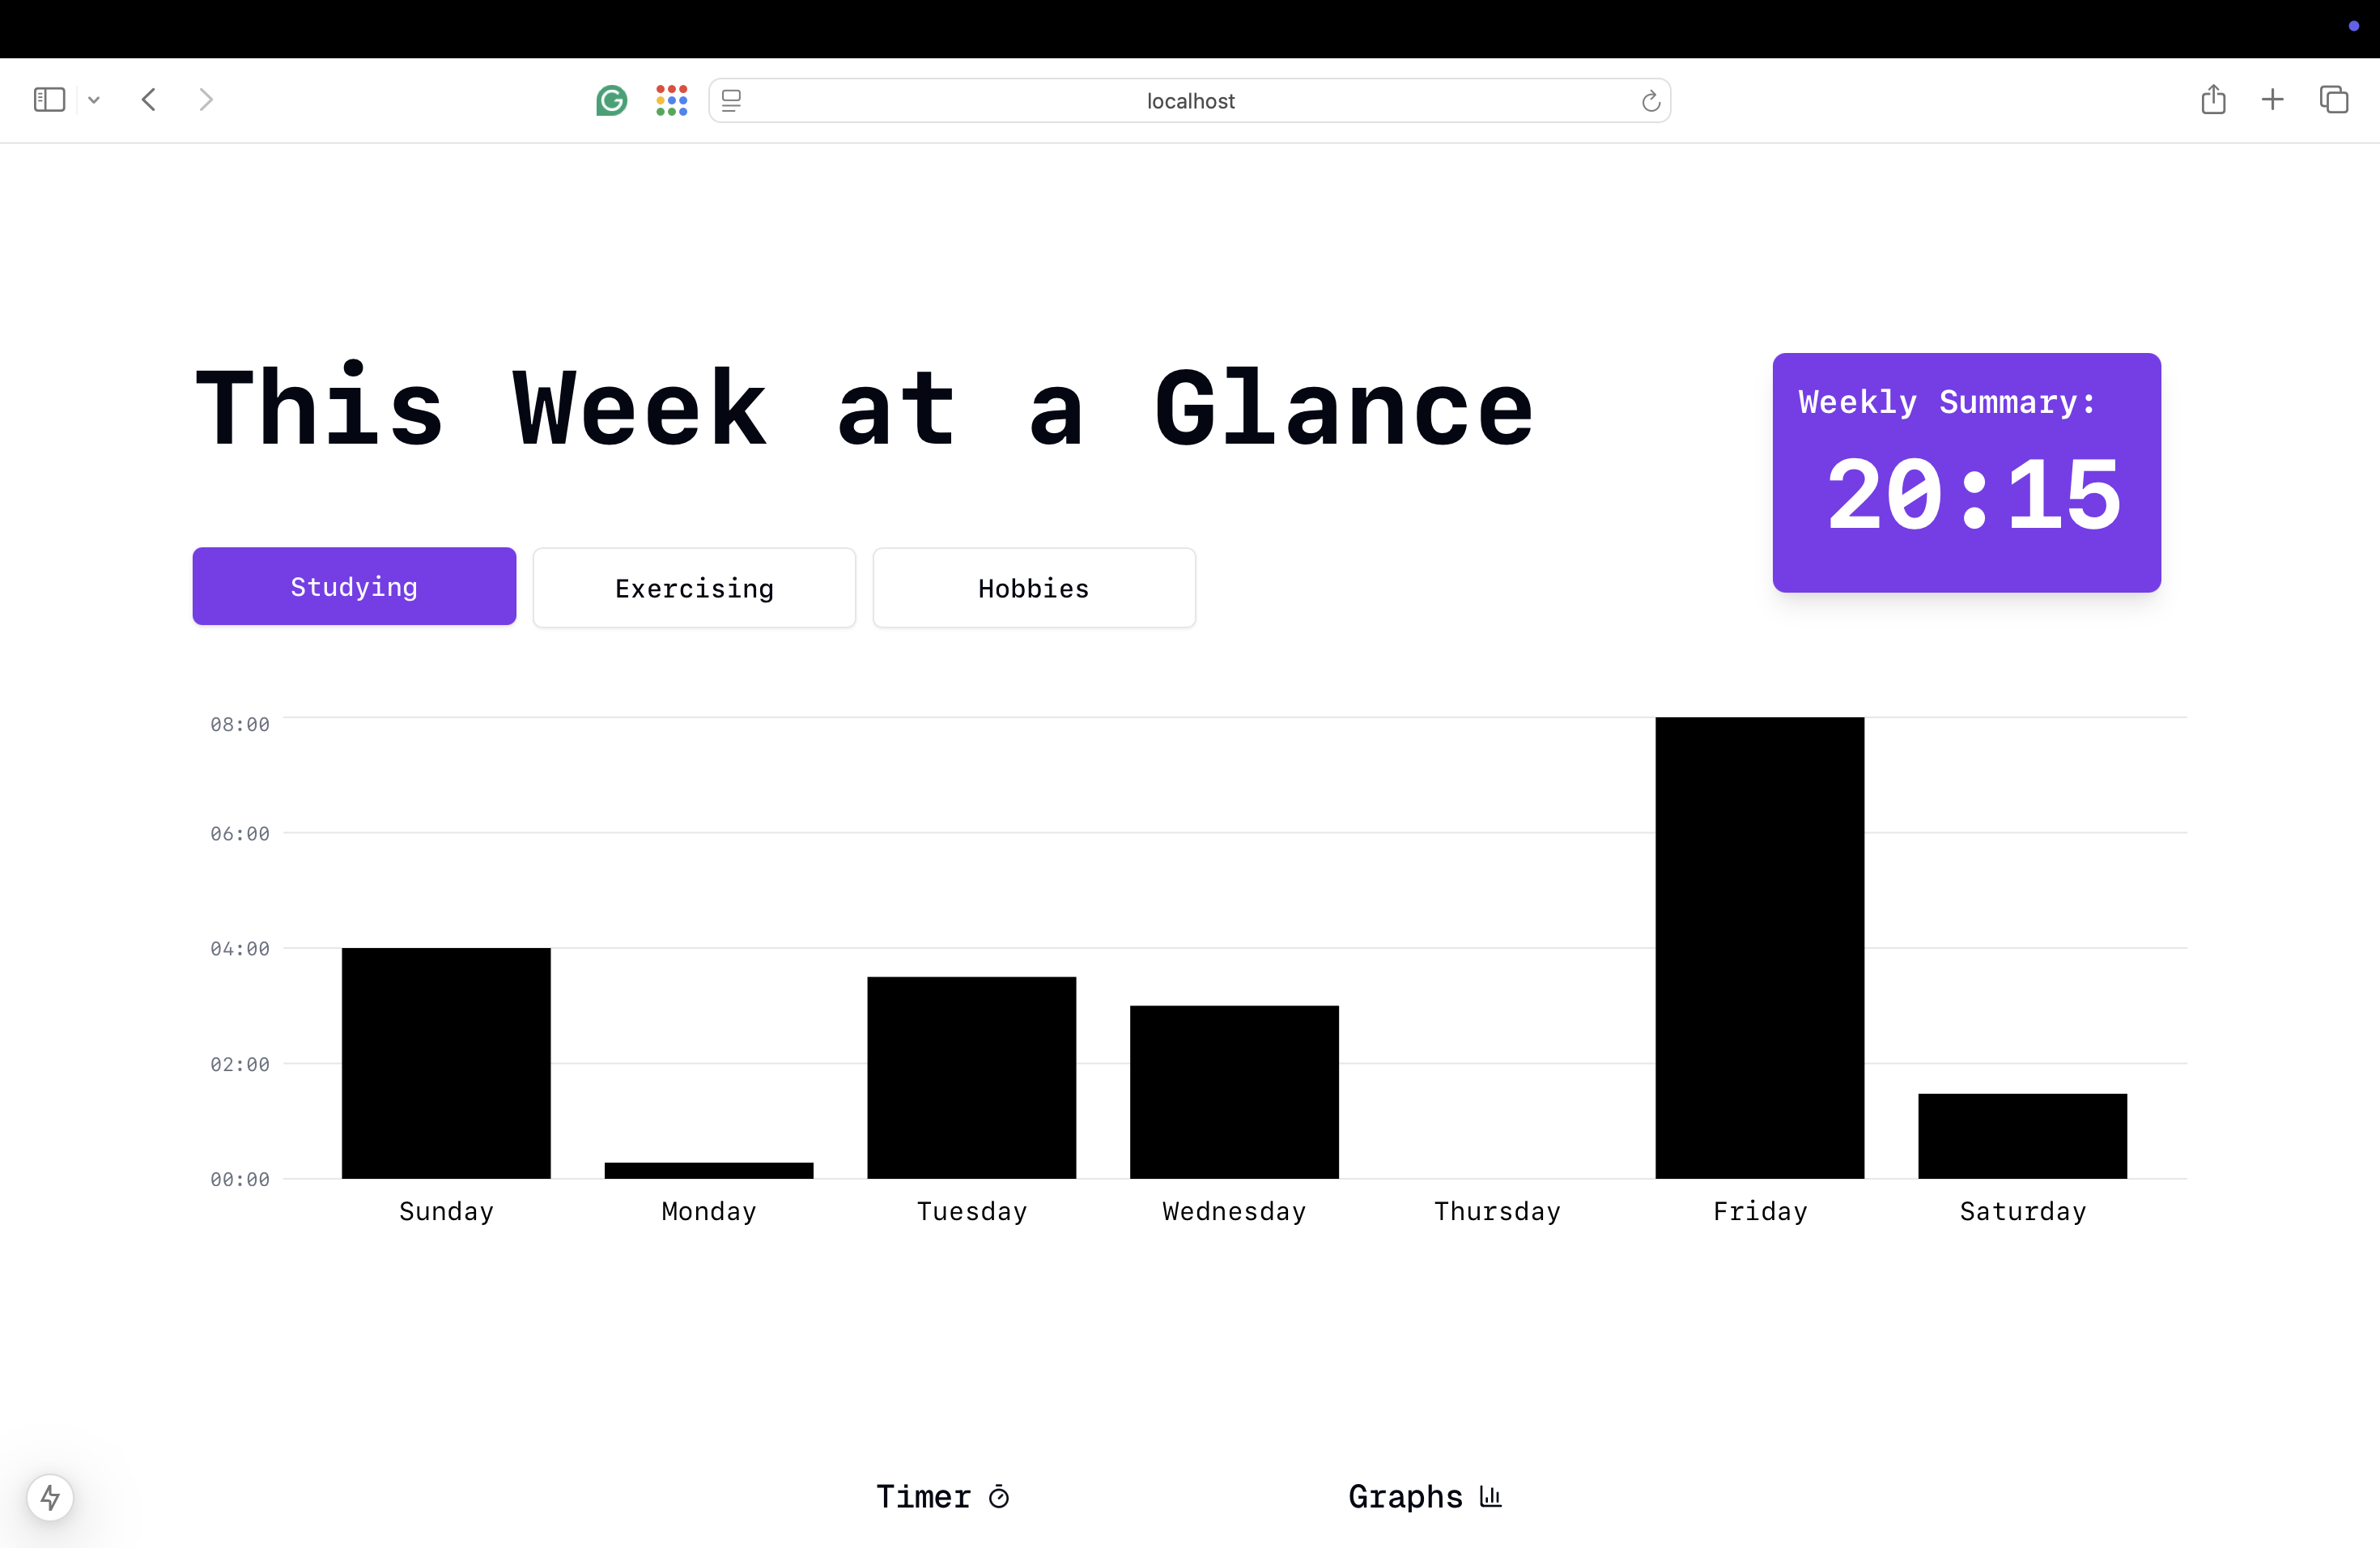
Week at a glance with total weekly time
-
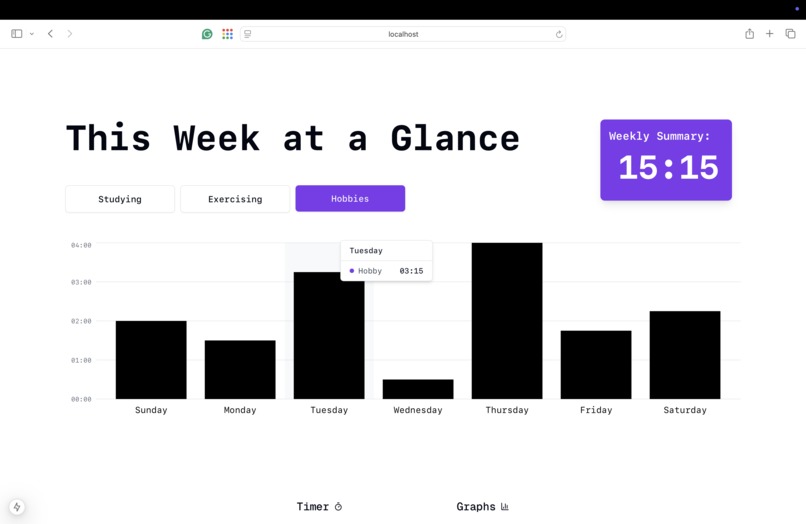
Week at a glance with total weekly time with interactive label


Inspiration
Our dear friend wanted an application to track how he allocates his time throughout the week across different activities.
What it does
Our project helps you track the time you spend on different tasks throughout the week. While working on something, you can use our timer to keep track of the time spent. When you're done, you can save the time under a specific category. For example, you can log how much time you spend each week studying, exercising, or enjoying hobbies. On the graphs page, you’ll see a daily breakdown and can easily compare how your time is divided among your activities.
How we built it
We used Next.js as our framework which gave us the foundation to implement our website using React. Gabrielle and Ruben focused on designing the user interface for the timer and graphs, while Josh developed the database system using MongoDB; the database allows users to log in or register an account to securely store their unique "time spent" data.
Challenges we ran into
Our biggest challenge was figuring out how to store and access the user's "time spent" data in the database. With limited experience in website development, we had to learn the necessary languages and frameworks as we went. By reviewing each other's work and solving errors collaboratively, we successfully implemented features like tabs, functioning timer, and interactive graphs, despite the steep learning curve.
What's next for TickTrack
Our main goal is to finalize implementing the database to complete the website functionality, allowing cloud storage for "time spent". We’ll also add more visualizations, like pie charts and comparison bar graphs, to enhance the time visualization. Additionally, we plan to allow users to filter and analyze their activity logs by custom timeframes, such as daily, weekly, or monthly views.

Log in or sign up for Devpost to join the conversation.