-
Logo
-
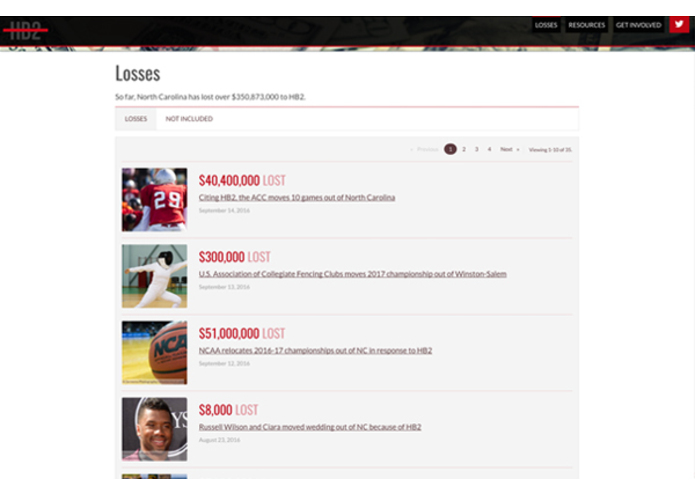
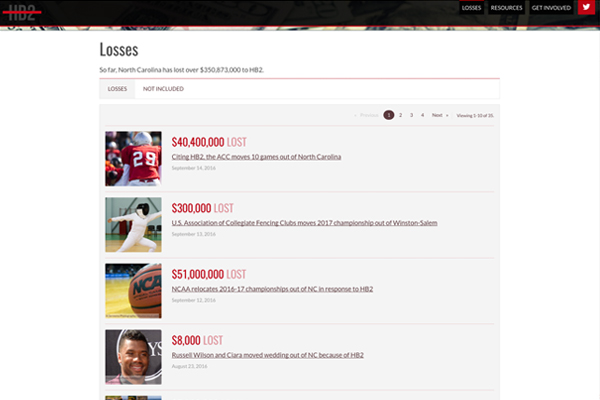
Losses index
-
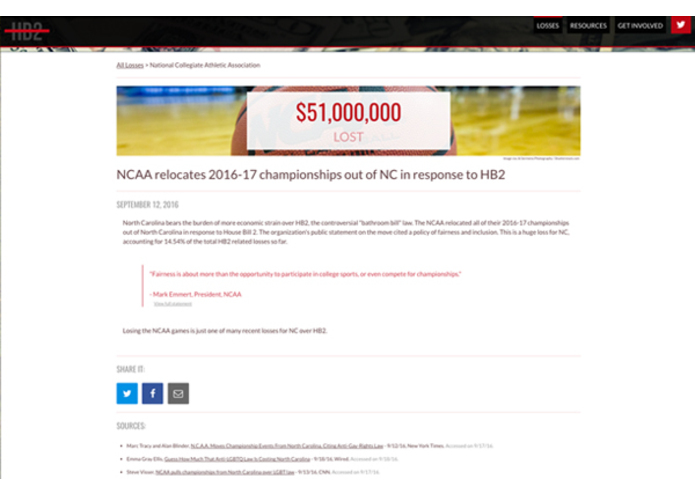
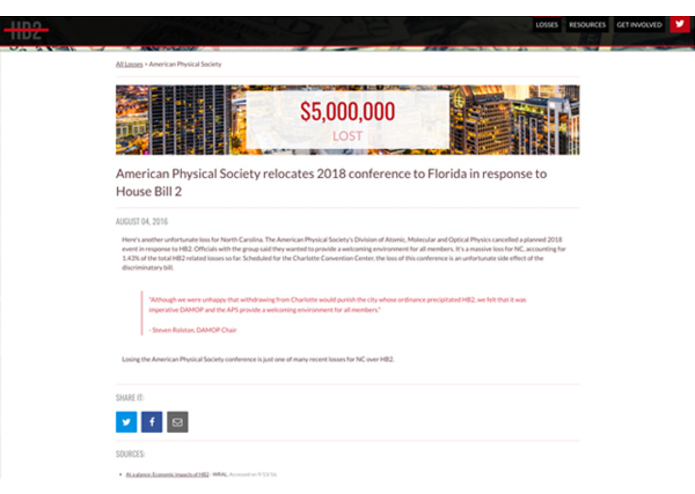
Sample losses page
-
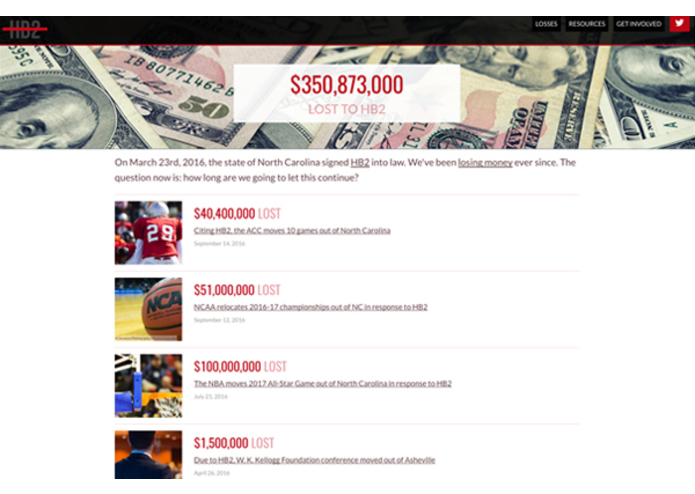
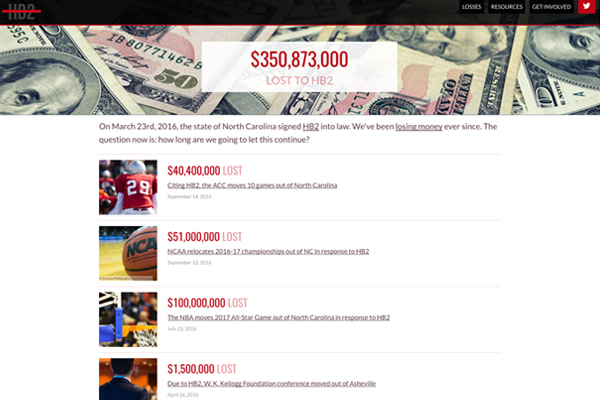
Homepage
-
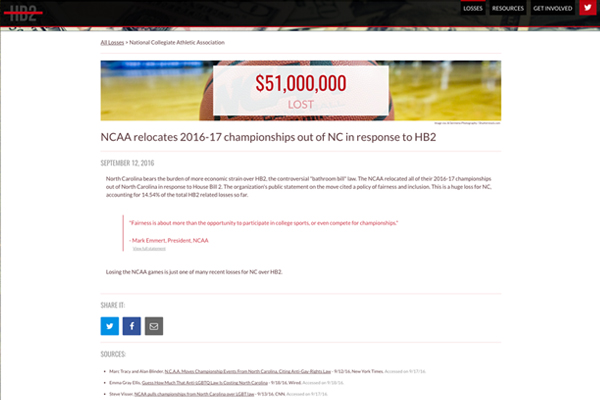
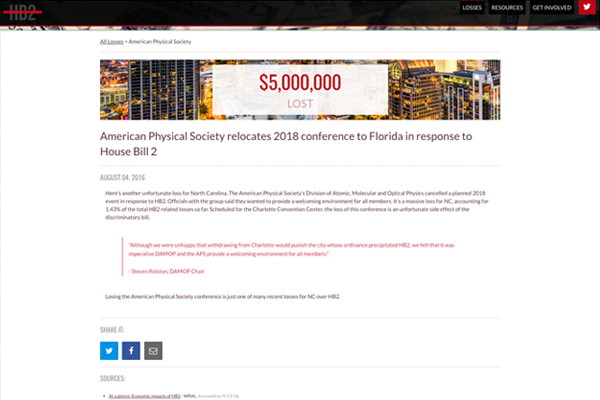
Sample losses page
Inspiration
As a lesbian living in North Carolina, I'm sensitive to issues concerning the LGBTQ community. When House Bill 2 was signed into law, I was sure it would be repealed in a matter of weeks. Well, it's been 6 months now, and still the bill exists. So I decided to try and do something about it. There's already a number of great projects and groups out there trying to tackle the issue from a civil rights standpoint, so I thought I'd try and attack the bill from the economic angle.
What it does
stophb2gether.com - This is a website dedicated to stopping HB2 in North Carolina. It's focused specifically on the economic toll the bill has taken on the state.
How I built it
The research
I realized when I set out to do this that it's actually quite hard to find economic impact figures for all the items that I needed. In fact, some of them didn't exist at all. I spent a lot of time deciding how to handle this, and detailed it fully on the about page of the site. I contacted many local officials and newspapers trying to collect as much data as possible. My goal with the site is to be as transparent as possible about how the figures are calculated, and/or where they come from.
The design
I designed the logo, and ran a Booster Campaign to sell shirts to help promote the site. I used Sketch, Illustrator and Photoshop for my design work. I'm using Google Fonts; the site fonts are Oswald and Lato.
The development
I spend my days working at an NLG provider, Automated Insights where I'm a front-end engineer. Because of this, I've gotten to play around with a tool to generate articles based on data, called Wordsmith. This project actually started as a hackathon project at my company, to build something cool using Wordsmith. I had so much fun with it that I wanted to continue, so I did.
I used Wordsmith specifically for the individual losses pages themselves, and set the site up so that it will generate new text content when I update a spreadsheet. Here's how that works:
- I have a Google Sheet where I'm keeping all the data.
- I used the scripts tool in Sheets to add some custom JavaScript that listens for change events to a specific cell in each row.
- When that change event happens, I package up the values from the row, and send it as JSON via a POST to an endpoint on my website.
- When my website gets a POST at this endpoint, the following happens:
- The request is first verified to be authentic using a token.
- The values are then parsed, and filtered: only certain values are accepted.
- I then send the values to the Wordsmith API, which returns a template to me. This template contains the text content that I want to use for the main portion of the individual losses page.
- When the template is returned from Wordsmith, I parse the values and save the stuff I care about to the DB.
That all might sound overly complicated, but it's actually pretty cool; I get to change the values of my live site just by updating a row in a spreadsheet. I can also add new losses this way (although the images aren't automatically added).
The main application is built using the following:
- Rails with a PostgreSQL backend
- Capistrano for deployment
- EC2 to host the site
- browserify and babelify so I can write ES6
- Foundation - mainly for their CSS grid system
- Font-awesome - icon fonts
Challenges I ran into
Debugging the JavaScript on the Google Sheets side was a tedious process. But far and away the hardest part of this project was the research side; it was a lot of work to compile all this data and come up with a strategy for calculating losses that didn't have public economic impact figures available.
Accomplishments that I'm proud of
I'm proud of getting the site up and running, and completing the research needed to get as many losses up there as I possibly could. I'm fairly new to EC2 as well, so I'm proud of wrangling that to the point where I've got SSL, etc.
What I learned
I learned that I could be a better marketer, and that there's a lot that I don't know about getting a public campaign up and running.
What's next for StopHB2gether
I'm going to keep working on the NLG side, because I'm having fun with it. I'm also going to start adding charts to further break down the data I've collected. I'll be adding in new losses as they occur, until(hopefully soon) the bill is repealed.

Log in or sign up for Devpost to join the conversation.