-

stonks.
-
Project Desc Part (one-page website)
-

Portfolio Optimizer Charts and 1 Optimizer Using News (Trend Signals) Chart
-
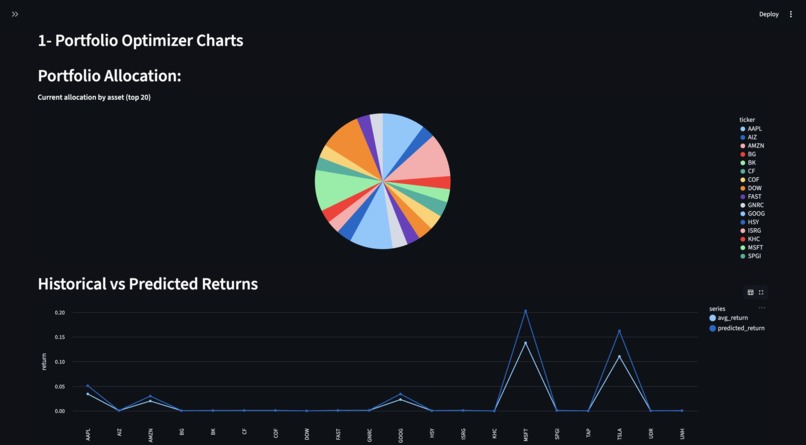
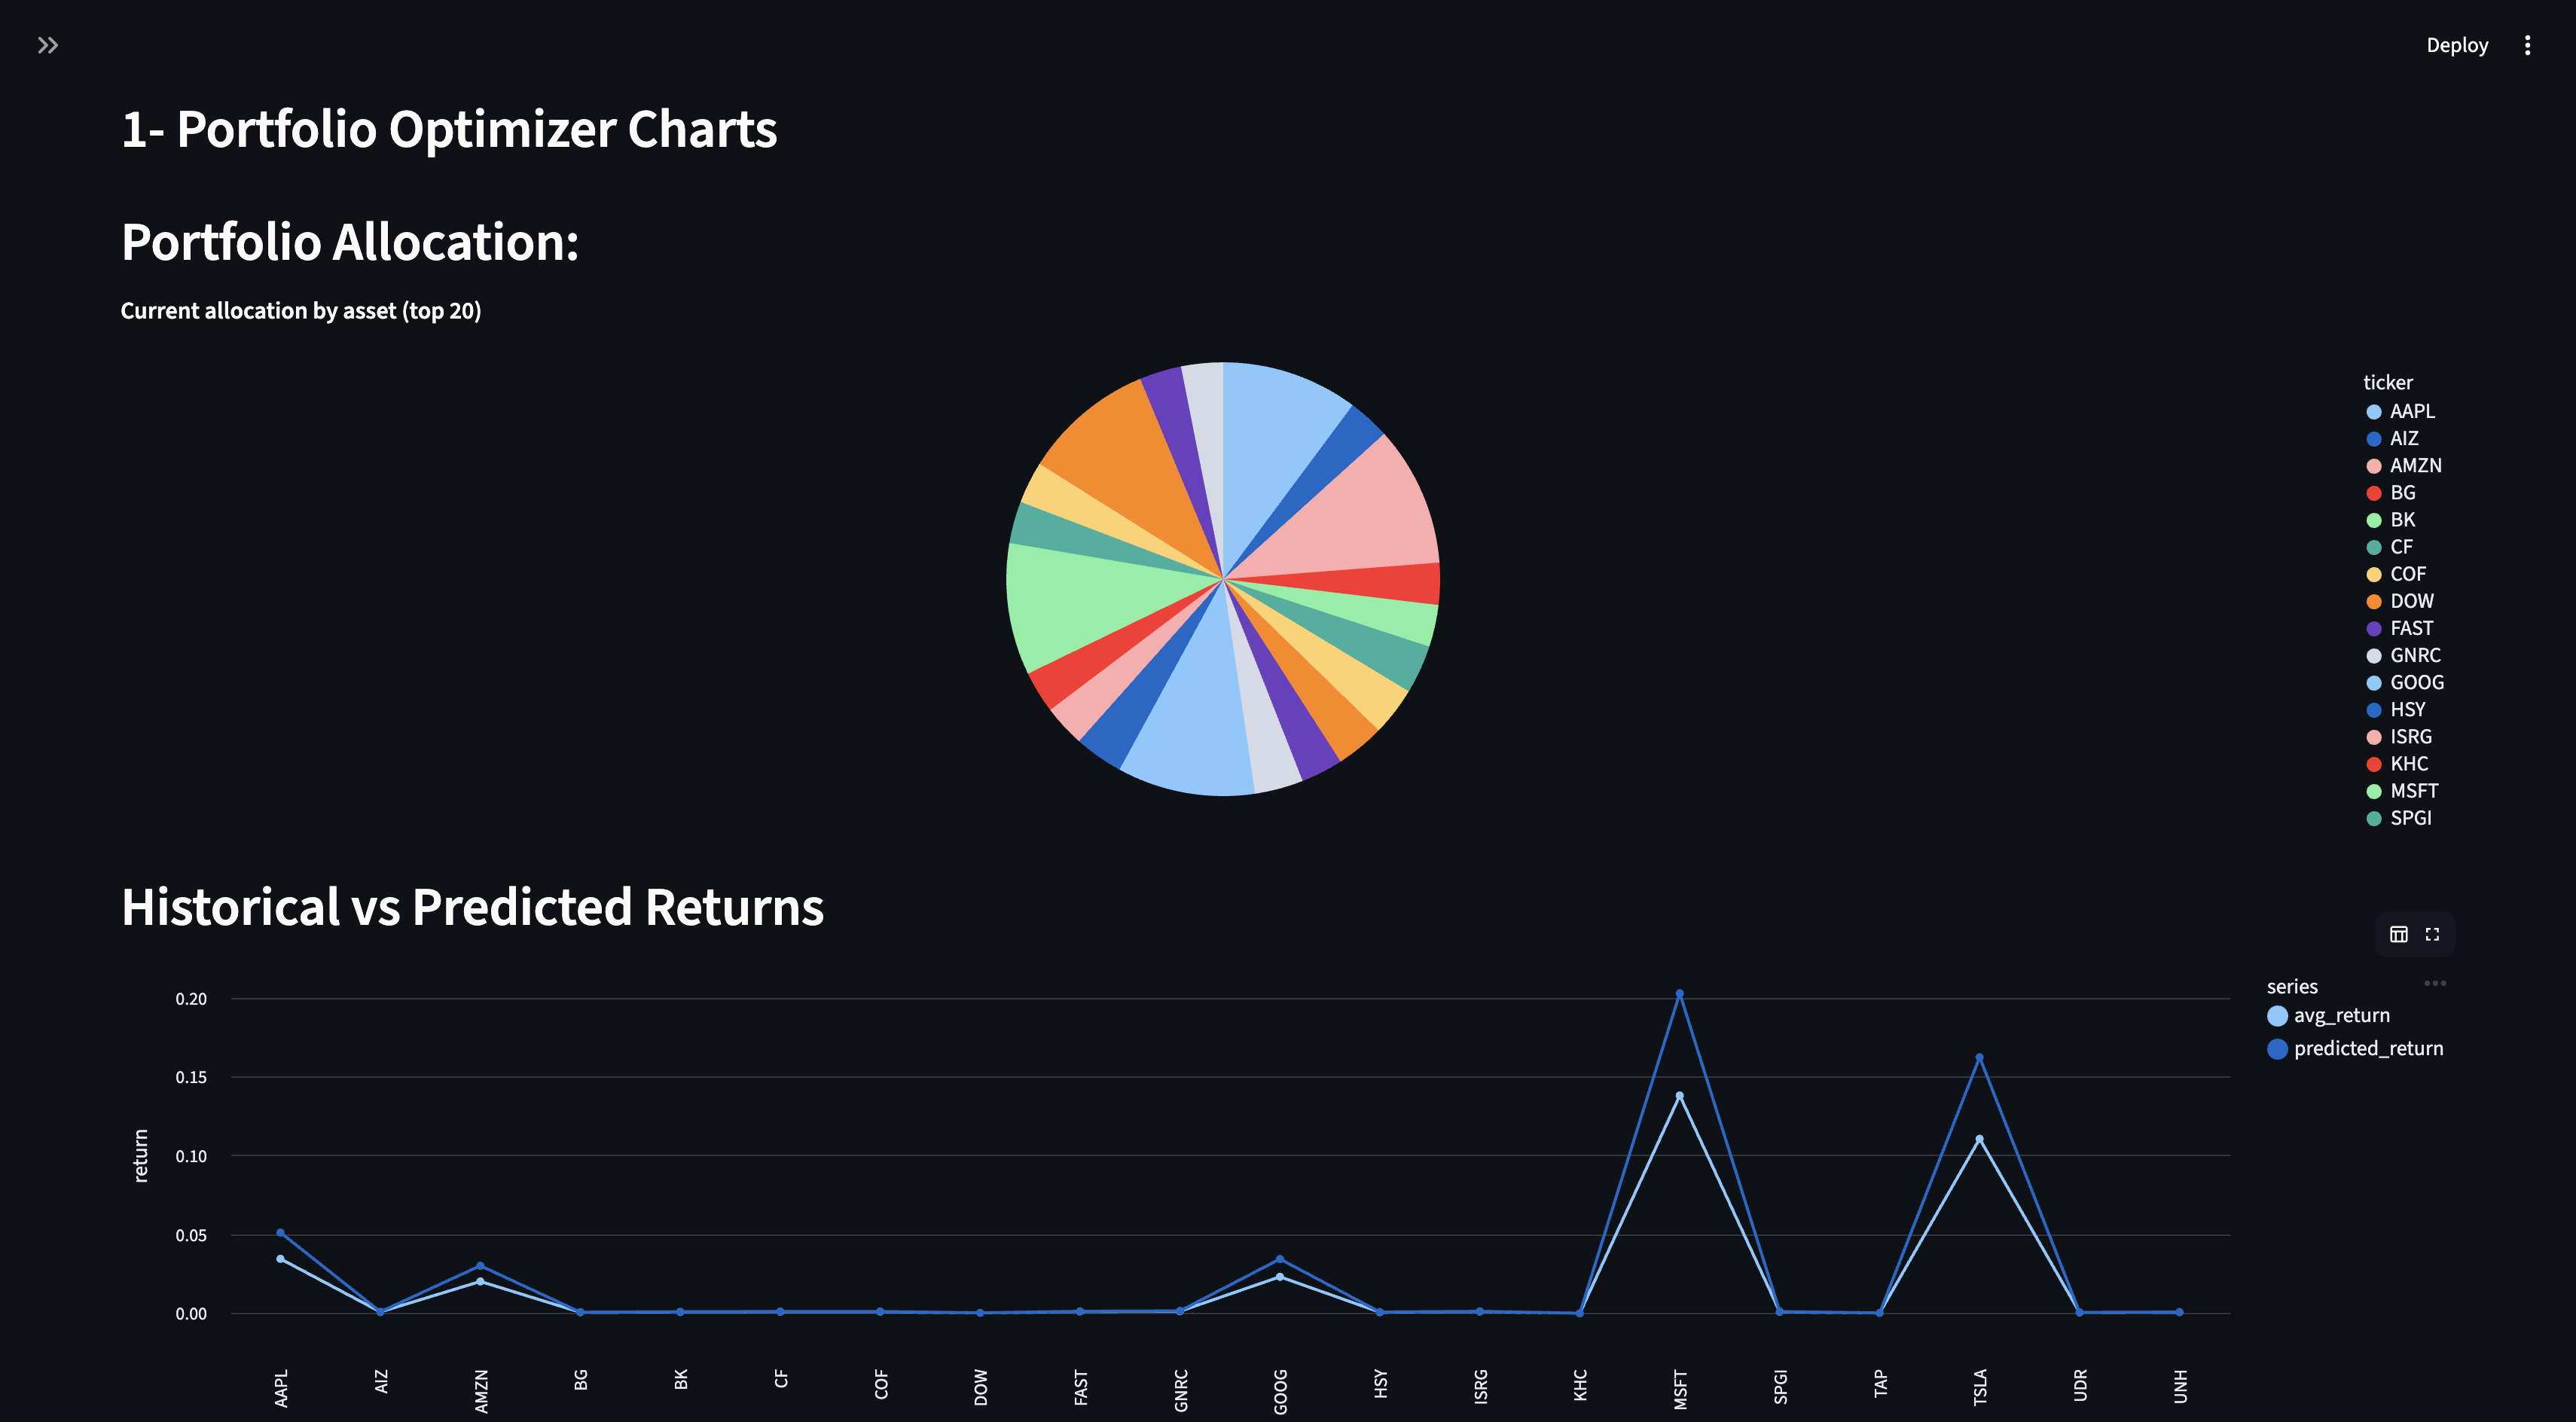
Portfolio Optimizer Charts
-
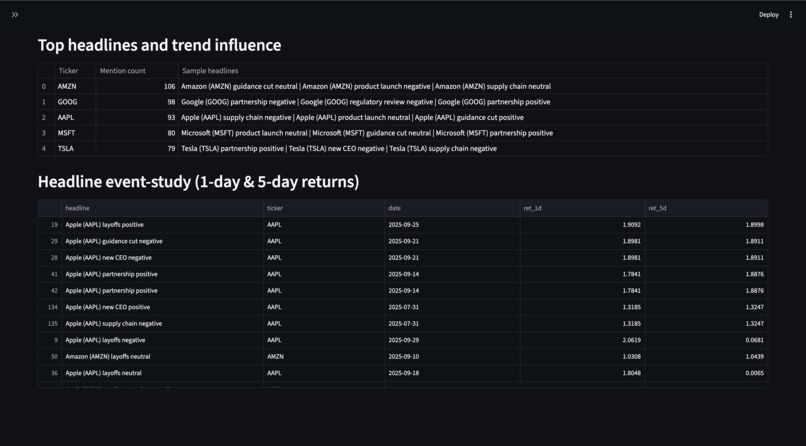
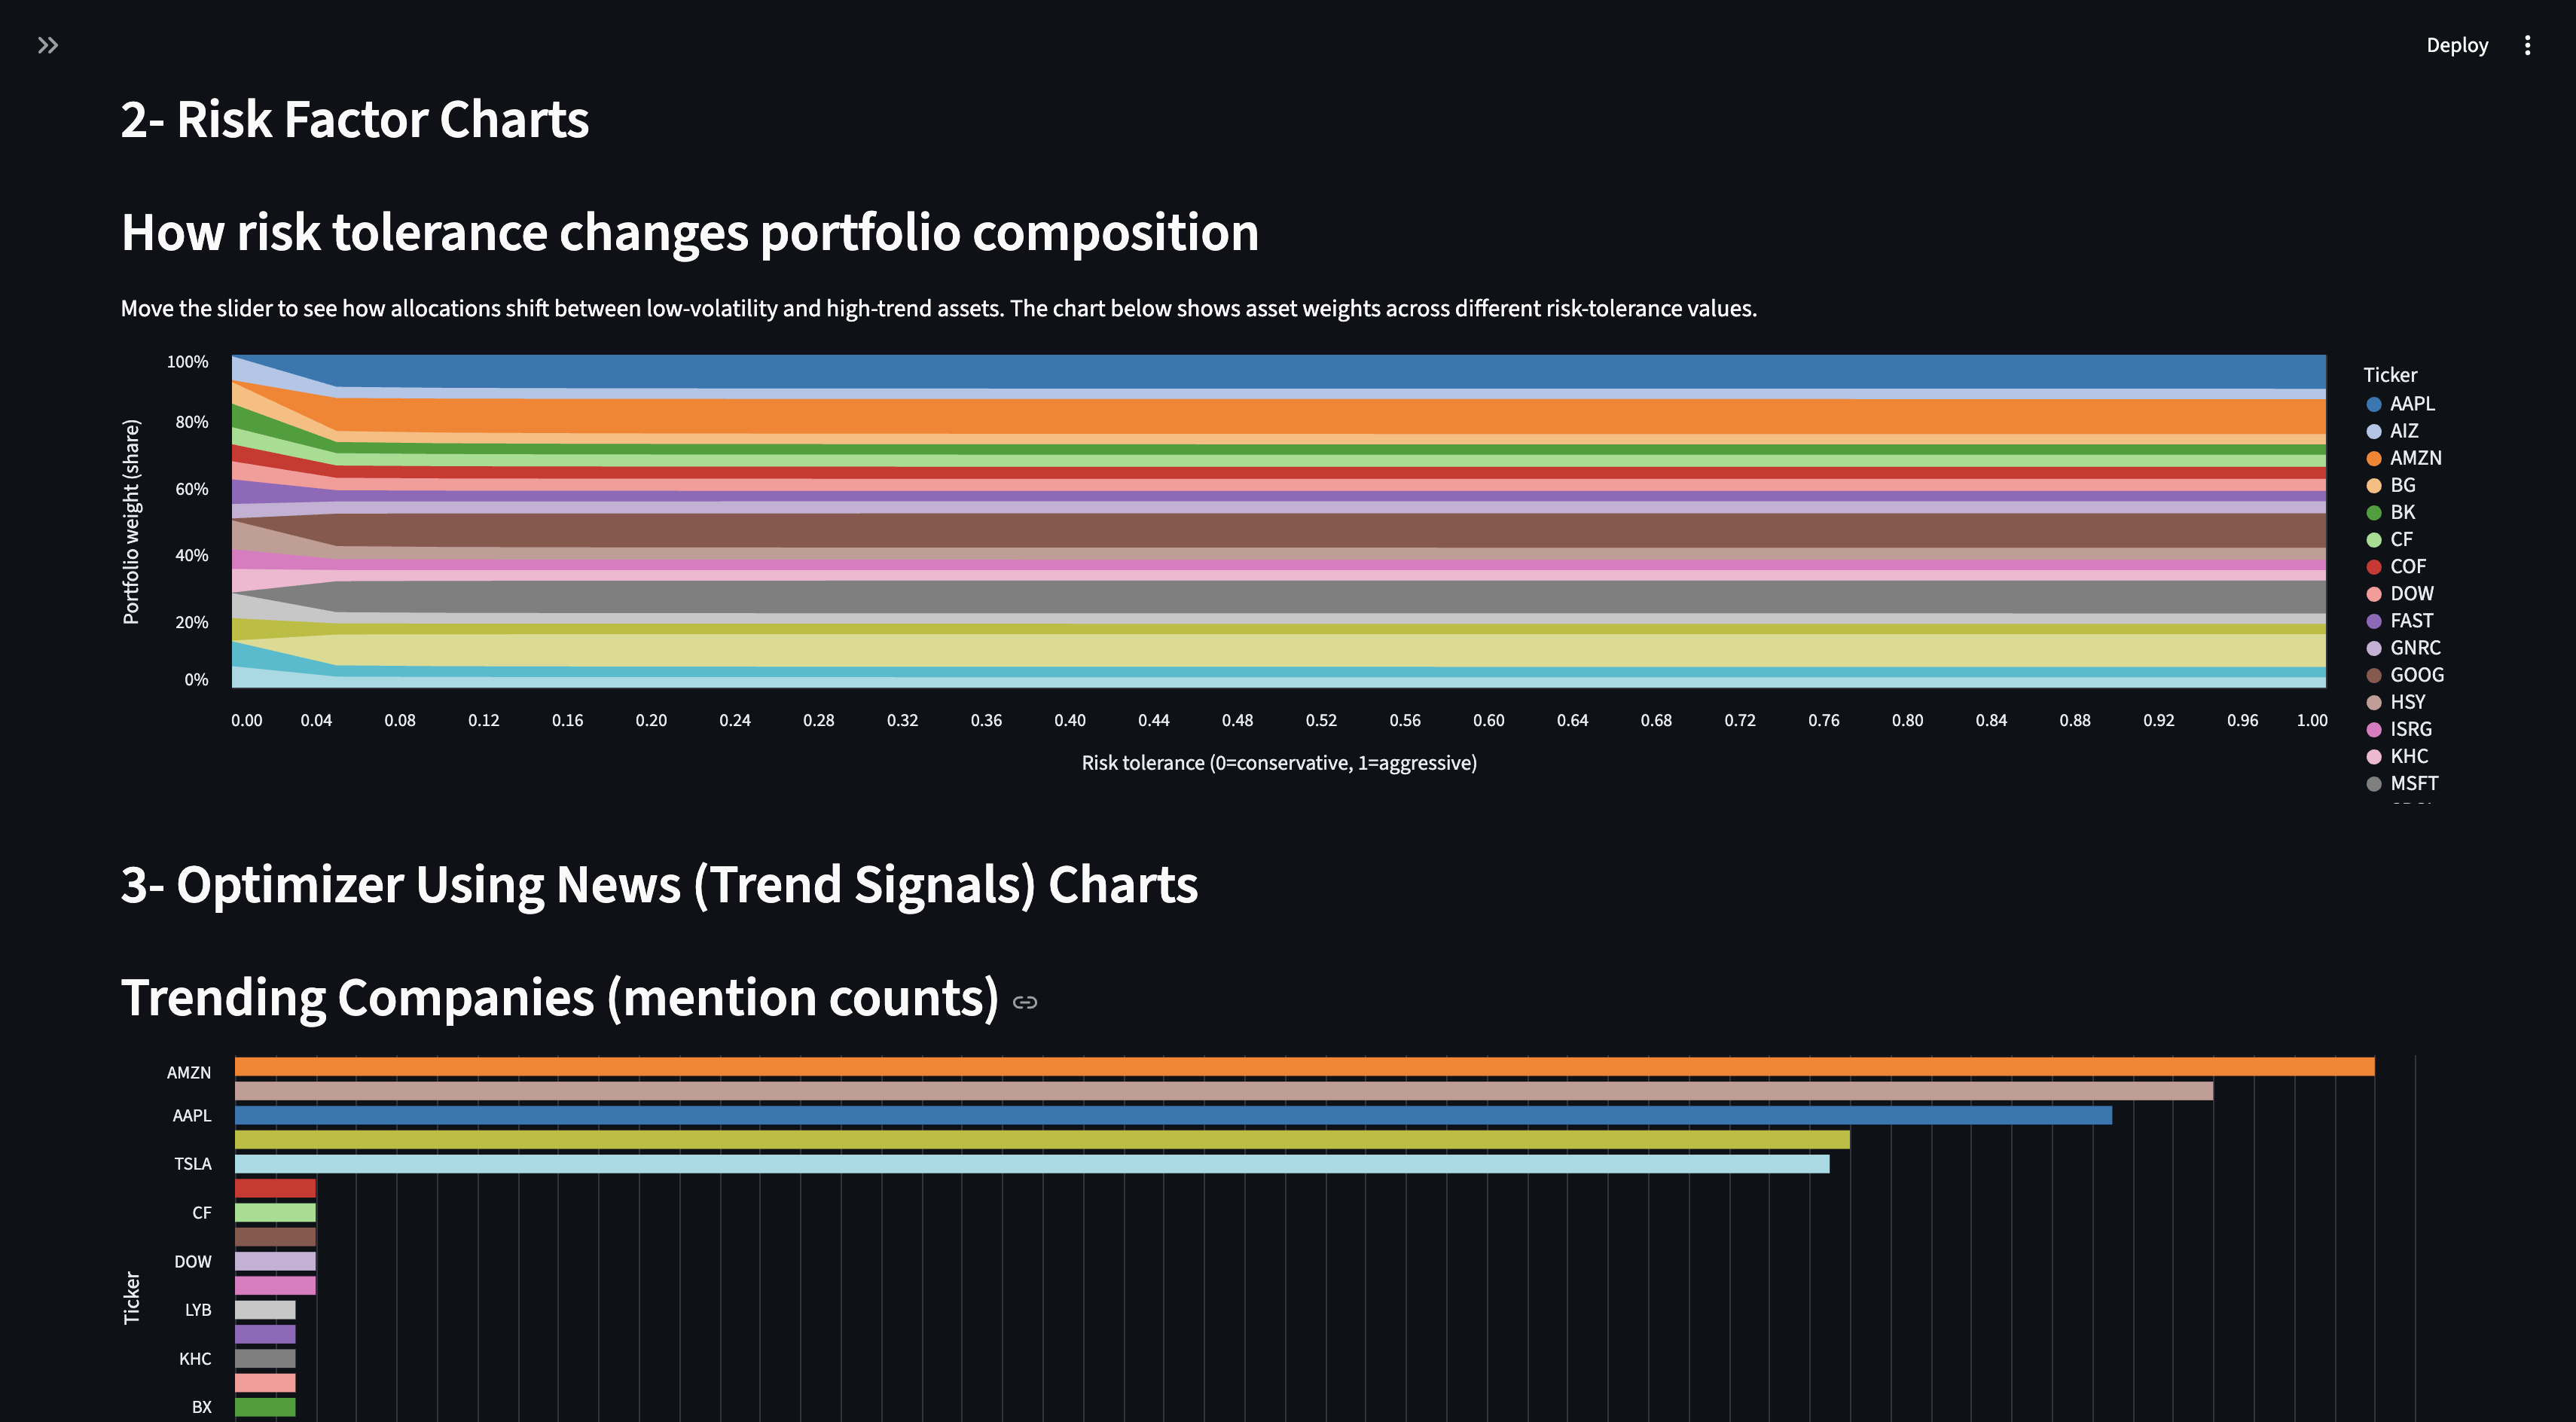
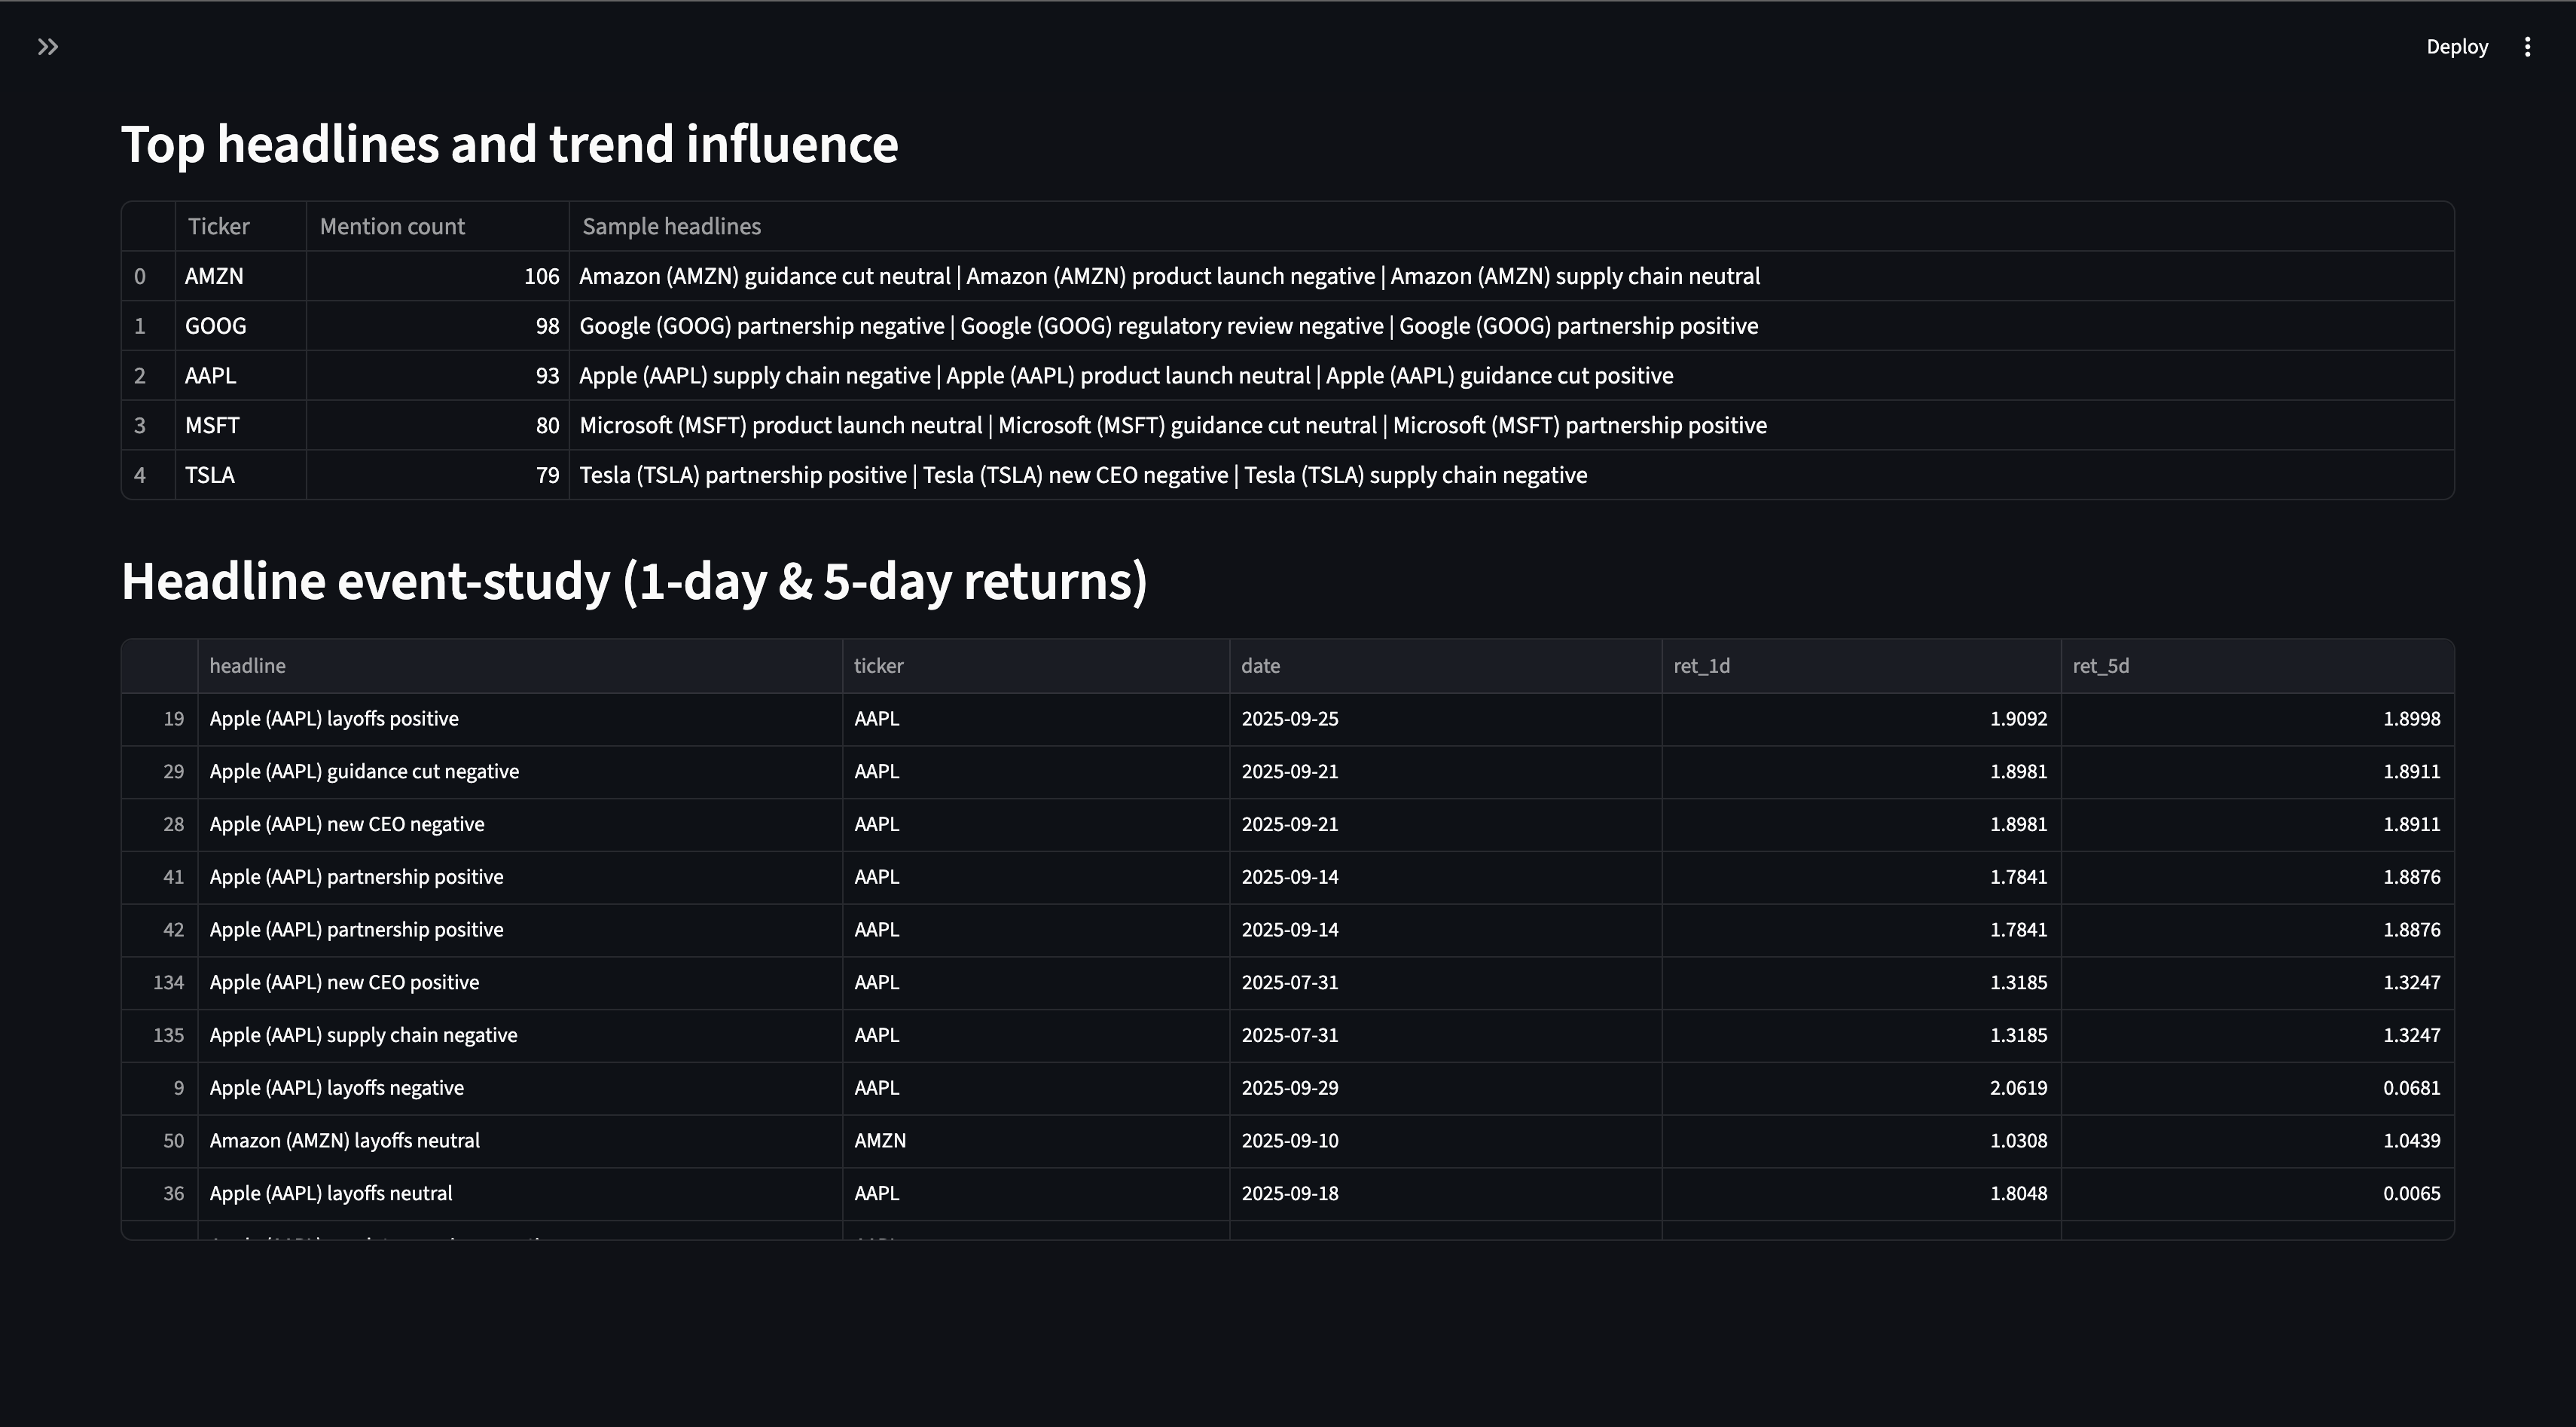
Some Optimizer Using News (Trend Signals) Charts

Inspiration
I’ve always been curious about how hype affects the stock market, especially with all the chaos and hype around AI, tech stocks, and the occasional Elon vs. Sam beef, or one Elon tweet, or one Elon speech (hm, I am seeing a trend here. Next hackathon project?). I wanted to see if that internet buzz actually shows up in market behavior. So I built Stoncs (“stonks”) as a solo hacker project. It uses S&P 500 data (but i am mainly interested in tech stocks) and Snowflake + Snowpark to see how hype might shift portfolio decisions.
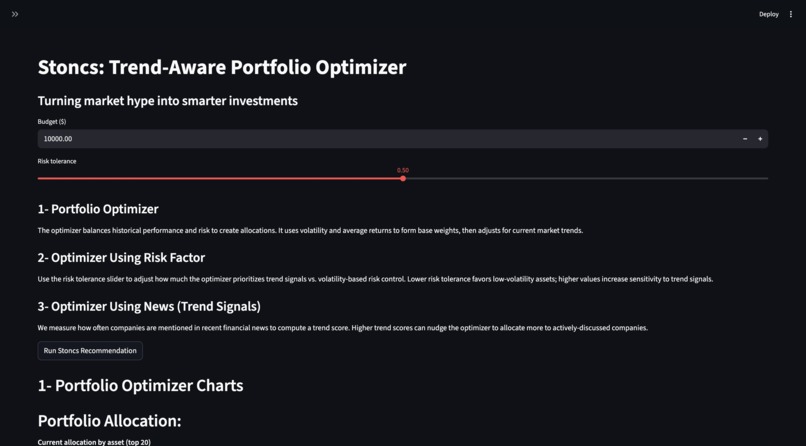
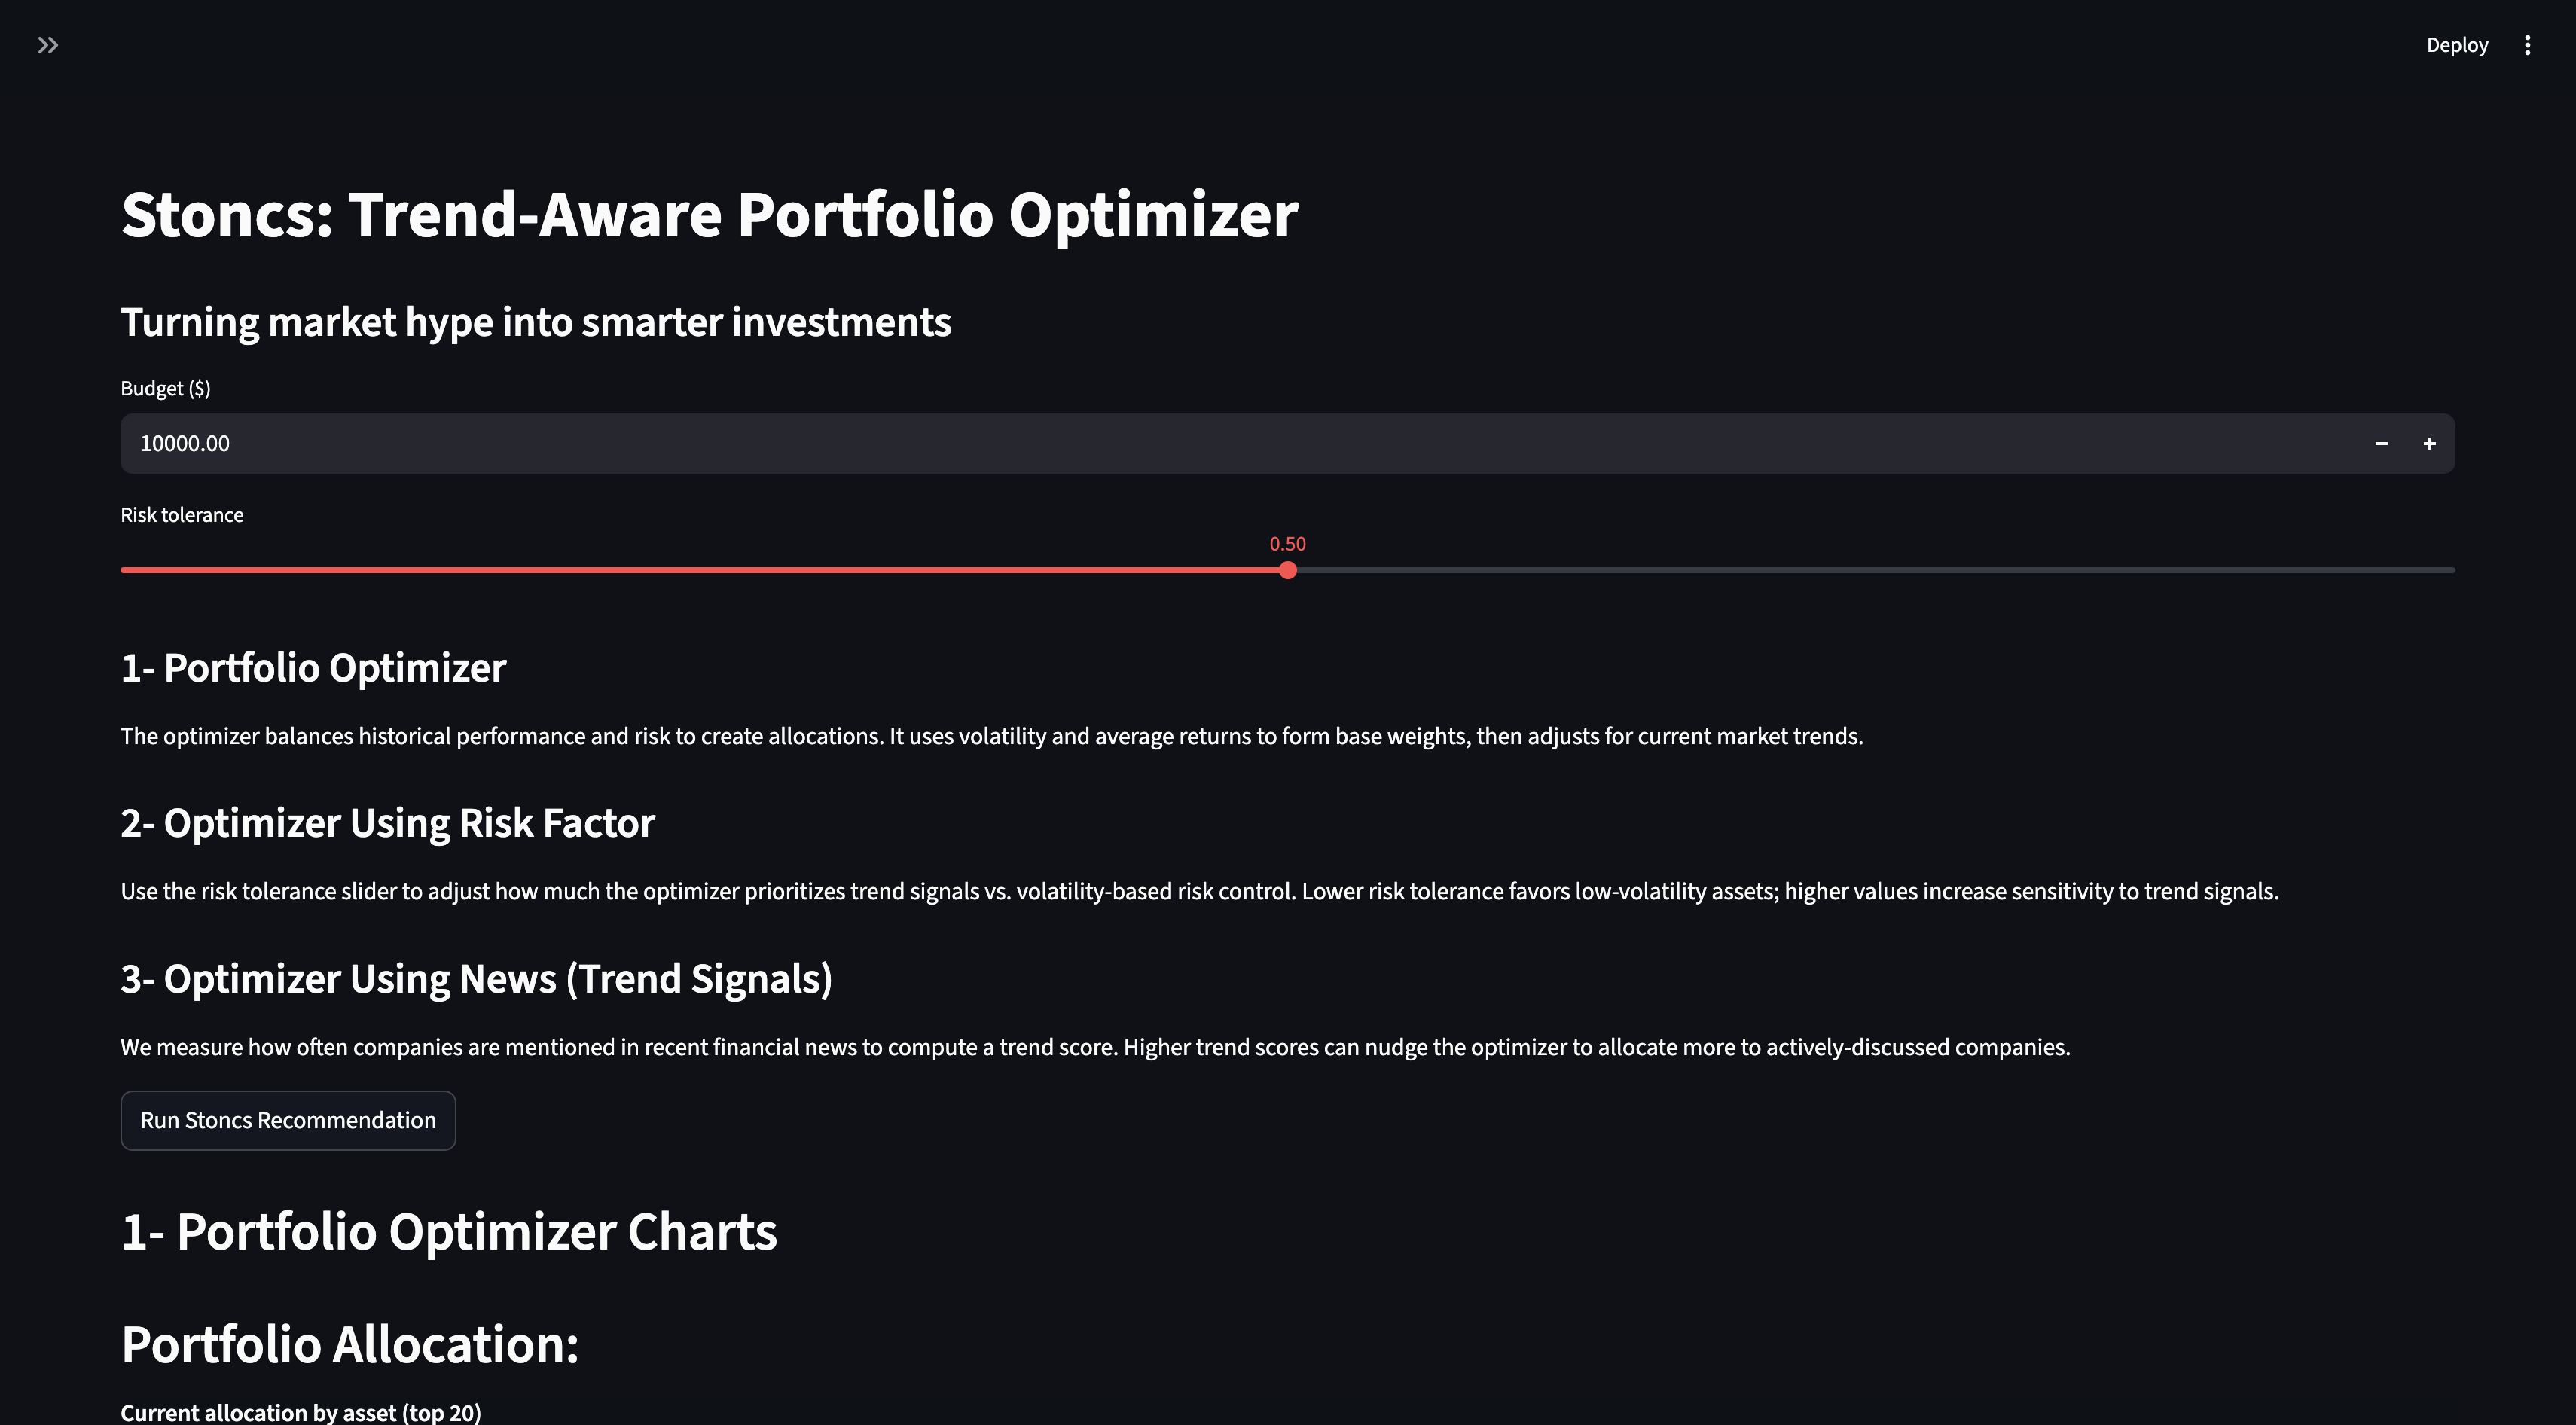
What it does
Stoncs looks at recent trends and news, finds which companies are getting the most “hype” (mentions in news), and runs a ML model to adjust portfolio weights based on that. You can tweak your risk tolerance and see how the portfolio changes, and how hype scores might mess with your strategy. It’s basically a small playground to see how internet energy and data interact in investing.
How I built it
At first, there were a lot of system design. there are many components so I had to be careful about how everything interacted. For the coding aspect, I used Streamlit for the interface, Python for the logic, and a data pipeline that pulls market data into Snowflake (with Snowpark, and K-cluster) for all the data stuff. Market and news data are also stored and processed in Snowflake, which keeps things fast and scalable. Then I used some ML to build a mini optimizer that balances risk and hype-driven opportunities. Everything’s pulled together through the Snowflake API and shown in clean charts, graphs and tables.
Challenges I ran into
System design was rough, there’s a lot happening between APIs, data cleaning, and visualization. I’m a solo hacker, so getting Snowflake, Snowpark, and Streamlit to talk nicely took time. Also, finding a good way to represent trend without it looking random was harder than it sounds.
Accomplishments that I am proud of
That it actually works. The app connects live Snowflake data, runs real ML logic, and turns all that into visual, understandable charts. It’s not just a bunch of random lines, you can actually see how news trends mess with portfolio weights (Stonks!!).
What I learned
Honestly, I wasn’t even planning to hack. I told myself I was just here for the vibe, but I couldn’t resist the voices :-) I ended up diving deep into Snowflake (and Snowpark) for the first time, which was super cool to work with. I solo-hacked for the first time, realized it makes me more social and more alone at the same time. I also picked up a few new things about how investing data actually works behind the scenes.
What's next for Stoncs
Next up: adding more historical data (it currently goes back to Jan 1, 2018), pulling live news through a real News API, and expanding beyond the S&P 500. I’d also love to visualize how “internet hype” directly shifts portfolio recommendations, especially in tech. Basically, more data, more graphs, and maybe more ML.
Built With
- api
- pandas
- python
- scikit-learn
- snowflake
- snowpark
- streamlit
- yfinance


Log in or sign up for Devpost to join the conversation.