Inspiration
As finance enthusiasts and tech innovators, we were frustrated by the overwhelming complexity of analyzing financial markets. We observed stock analysts struggling to synthesize vast amounts of data from disparate sources, often leading to delayed decisions and missed opportunities. This sparked our mission to create a tool that could revolutionize how financial professionals interact with market data.
What it does
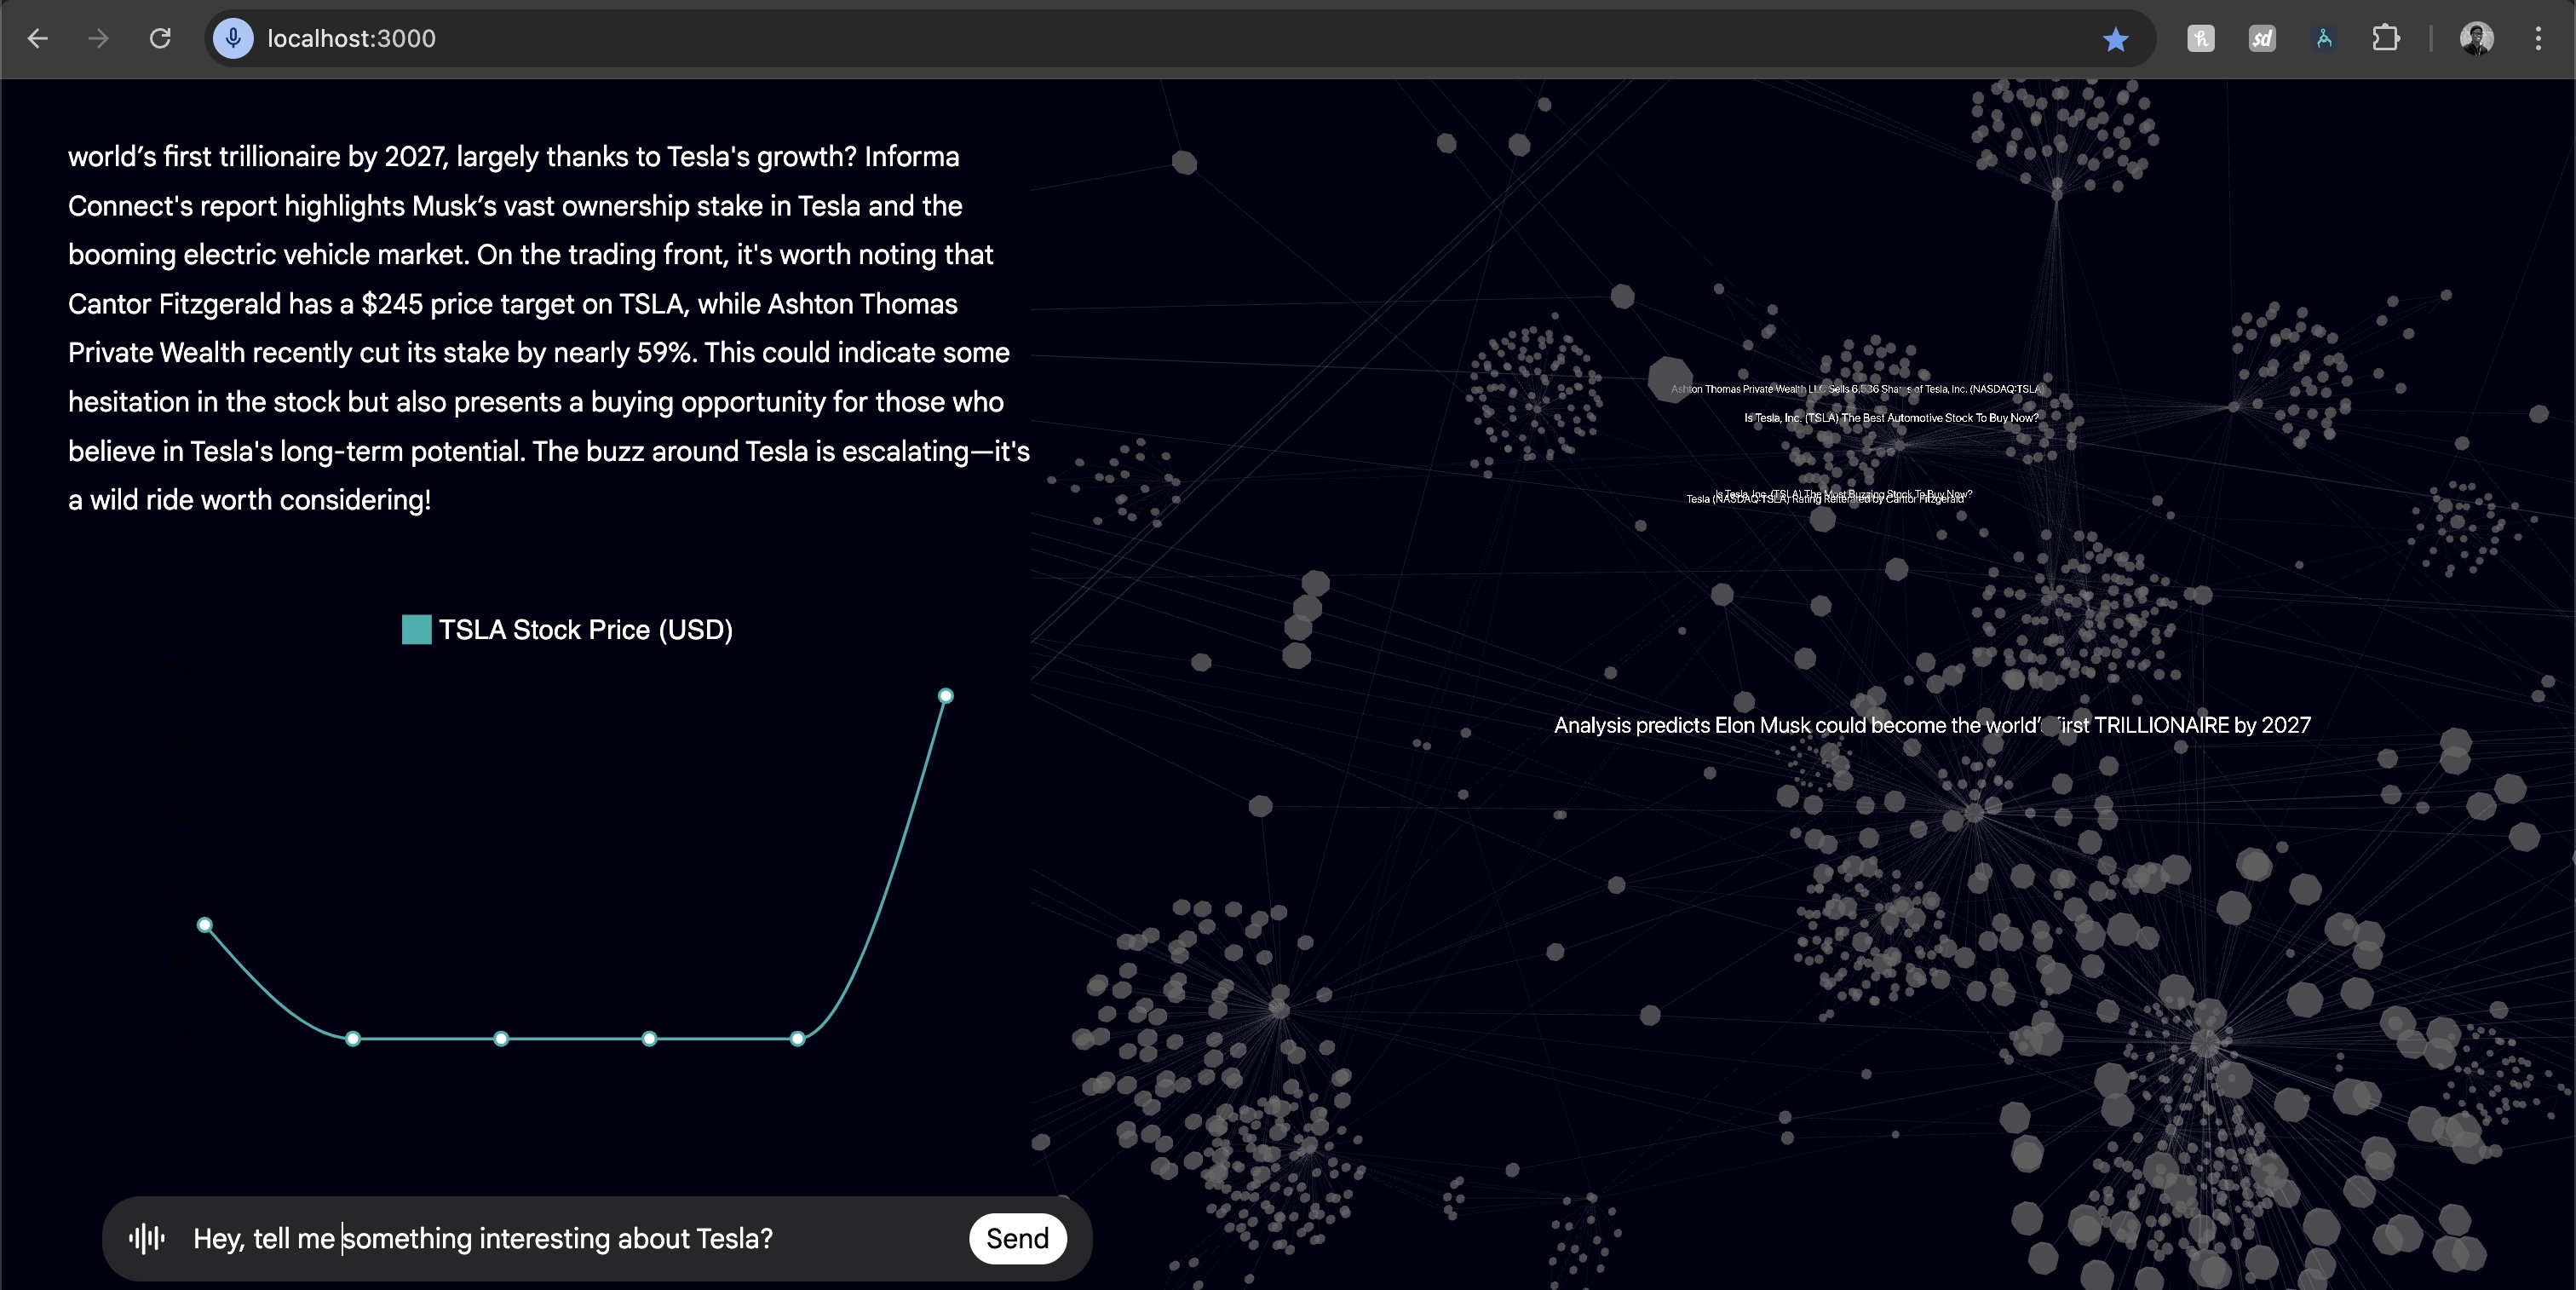
marketLens is a comprehensive data visualization platform that: Integrates real-time stock information, market prices, and relevant news into a single, intuitive dashboard Presents complex financial data in an easily digestible, graph-based format Enables analysts to identify market trends and correlations more efficiently Provides customizable displays to focus on metrics most relevant to users' strategies Incorporates machine learning for enhanced trend prediction and anomaly detection
How we built it
We leveraged a robust tech stack to bring marketLens to life: Frontend: React.js for a dynamic and responsive user interface Backend: Python for efficient data processing and API integrations Data Visualization: Material UI for creating custom, interactive charts and graphs Real-time Updates: Socket.io for instant data synchronization Data Processing: Python with pandas and numpy for complex data manipulations Cloud Infrastructure: AWS (EC2, RDS) for scalable deployment Machine Learning: TensorFlow for predictive analytics and trend detection
Challenges we ran into
Data Synchronization: Ensuring real-time synchronization of various data sources required implementing a sophisticated queuing system and optimizing database queries. Performance Optimization: We had to implement data caching mechanisms and optimize algorithms to handle large volumes of data efficiently. User Experience Design: Balancing comprehensive data presentation with a clean, intuitive interface necessitated multiple iterations based on user feedback. API Rate Limits: Working within financial API constraints while maintaining real-time updates required creative solutions like smart data polling and efficient use of websockets. Predictive Accuracy: Fine-tuning our machine learning models for reliable trend predictions is an ongoing process of refinement and validation.
Accomplishments that we're proud of
Created a unified platform that significantly reduces the time analysts spend on data gathering and interpretation Developed a highly intuitive interface that received positive feedback from beta testers in the financial industry Successfully integrated multiple data sources into a real-time, synchronized display Implemented machine learning models that provide valuable insights and predictions Built a scalable solution capable of handling high-volume data processing without compromising performance
What we learned
The transformative power of effective data visualization in decision-making processes The critical importance of user-centric design in creating tools for specialized professionals Techniques for optimizing performance in data-intensive applications The intricacies of working with financial APIs and real-time data streams The value of cross-disciplinary collaboration in tackling complex problems
What's next for marketLens
Expanding our data sources to include more global markets and alternative data sets Developing mobile applications to provide on-the-go access for analysts Enhancing our machine learning capabilities to offer more sophisticated predictive analytics Implementing natural language processing to analyze news sentiment and its impact on market trends Exploring partnerships with financial institutions to integrate marketLens into their existing workflows Continuing to refine and optimize our platform based on user feedback and emerging market trends
Built With
- materialui
- python
- react.js

Log in or sign up for Devpost to join the conversation.