Inspiration-The inspiration for Stock Track comes from the challenge many investors face in understanding complex stock market data and making timely decisions. With markets moving rapidly and information scattered across sources, Stock Track aims to simplify analysis by combining data, indicators, and intelligent insights into one easy-to-use platform, empowering users to make smarter investment choices.
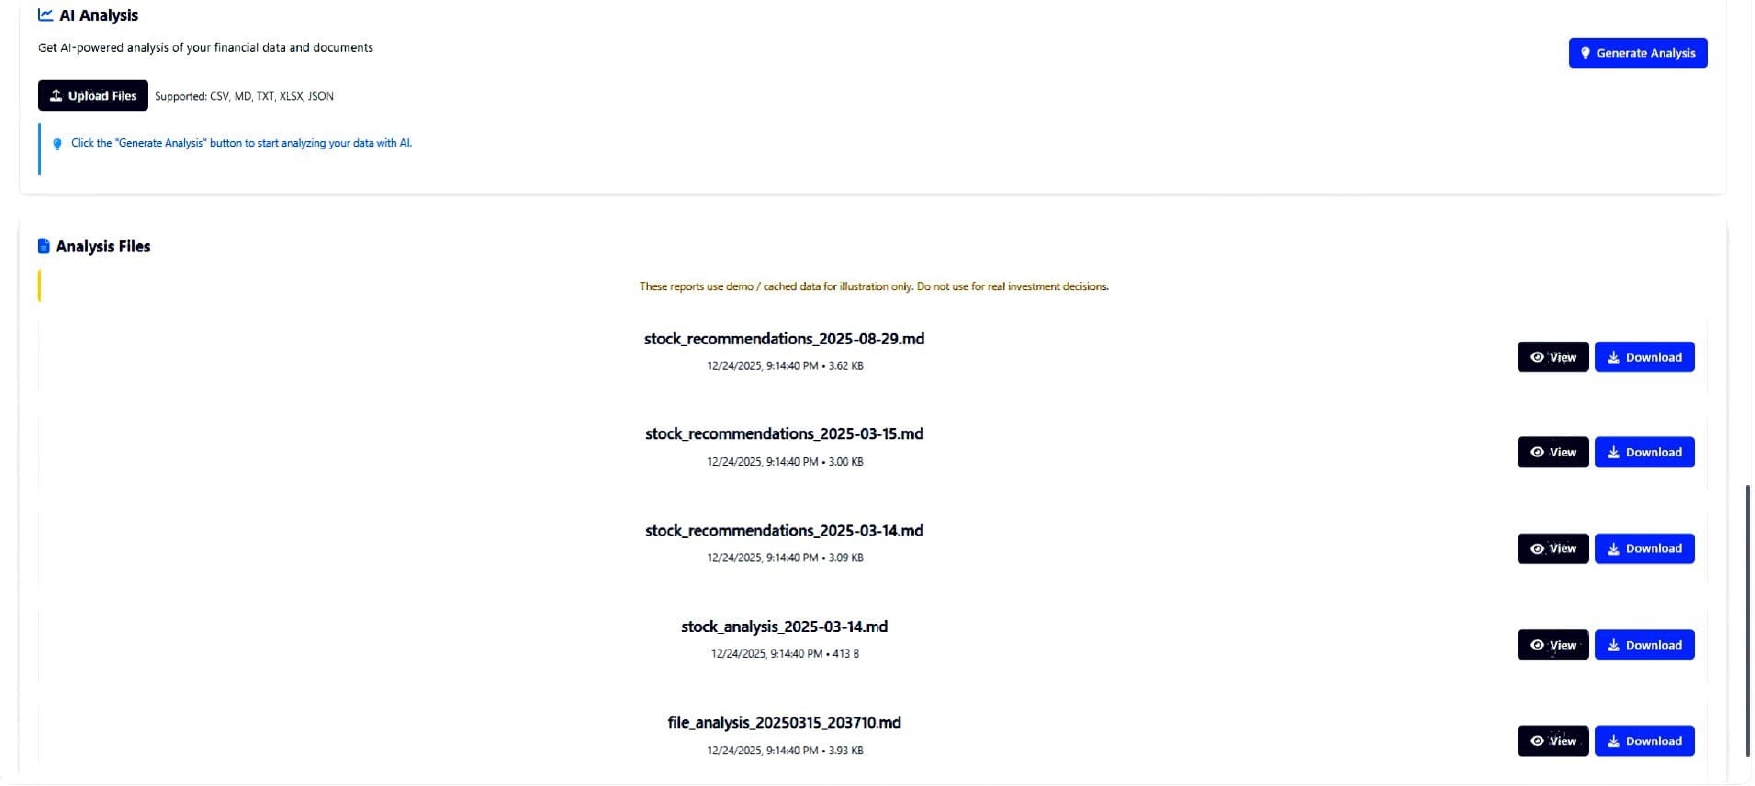
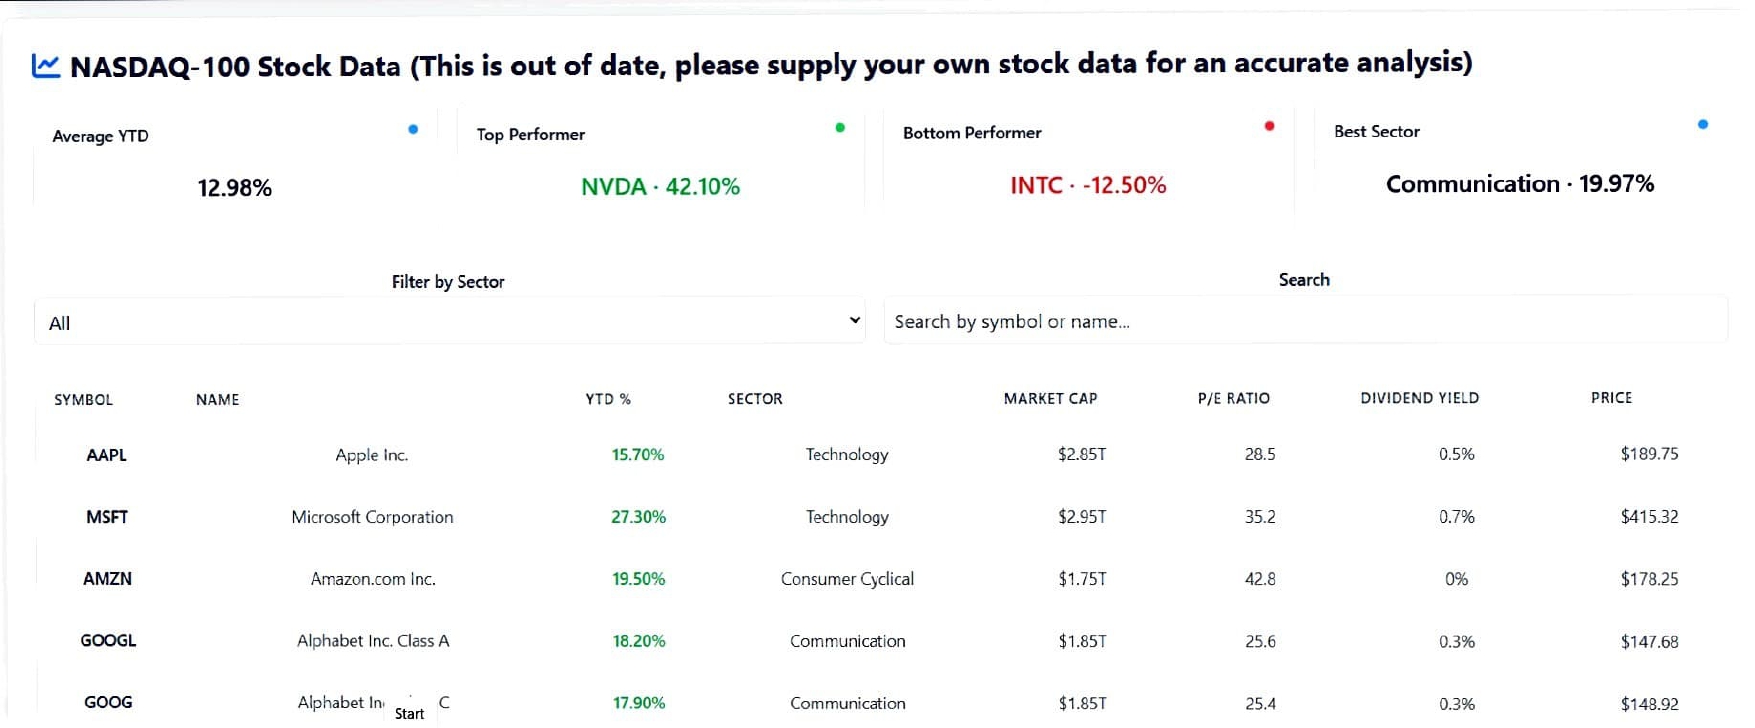
What it does-Stock Track analyzes historical stock market data to identify trends and generate actionable insights. It uses technical indicators to provide clear buy, sell, or hold signals, visualizes price movements through interactive charts, and helps users track stock performance over time. By presenting complex market information in a simple and understandable way, Stock Track supports smarter and more confident investment decisions.
How we built it-We built Stock Track using Python to collect real-time and historical stock data, clean it, and compute key technical indicators like SMA and RSI. Then we applied signal logic (and optional ML models) to generate trend predictions and buy/sell/hold recommendations. Finally, we created an interactive dashboard using Stream lit to display charts, indicators, and the latest decision in a simple user-friendly interface.
Challenges we ran into-One of the main challenges was handling stock market data correctly, such as dealing with missing values, different time periods, and ensuring the data was clean before analysis. Another challenge was designing accurate buy/sell logic without using future data (avoiding data leakage), which required careful validation. Finally, simplifying complex market indicators and presenting them clearly on the dashboard in a way that beginners could easily understand was also a key challenge.
Accomplishments that we're proud of-We successfully built a working end-to-end stock market analysis system that fetches real market data, analyzes trends, and generates clear buy, sell, or hold signals. We integrated technical indicators with interactive visualizations to make complex market data easy to understand. Most importantly, we created a user-friendly dashboard that allows even beginners to analyze stocks and make informed decisions confidently.
What we learned-Through building Stock Track, we learned how to work with real-world stock market data and the importance of cleaning and preparing data before analysis. We gained hands-on experience with technical indicators, basic trading logic, and avoiding common mistakes like data leakage. Additionally, we learned how to transform analytical results into a simple, interactive dashboard that makes complex information accessible to users.
What's next for Stock Track-Next, we plan to enhance Stock Track by integrating machine learning models for more accurate trend prediction and confidence scoring. We also aim to add portfolio analysis, risk management features, and real-time alerts based on market movements. In the future, Stock Track can be expanded into a full-fledged web or mobile application supporting multiple markets and personalized investment strategies.


Log in or sign up for Devpost to join the conversation.