-

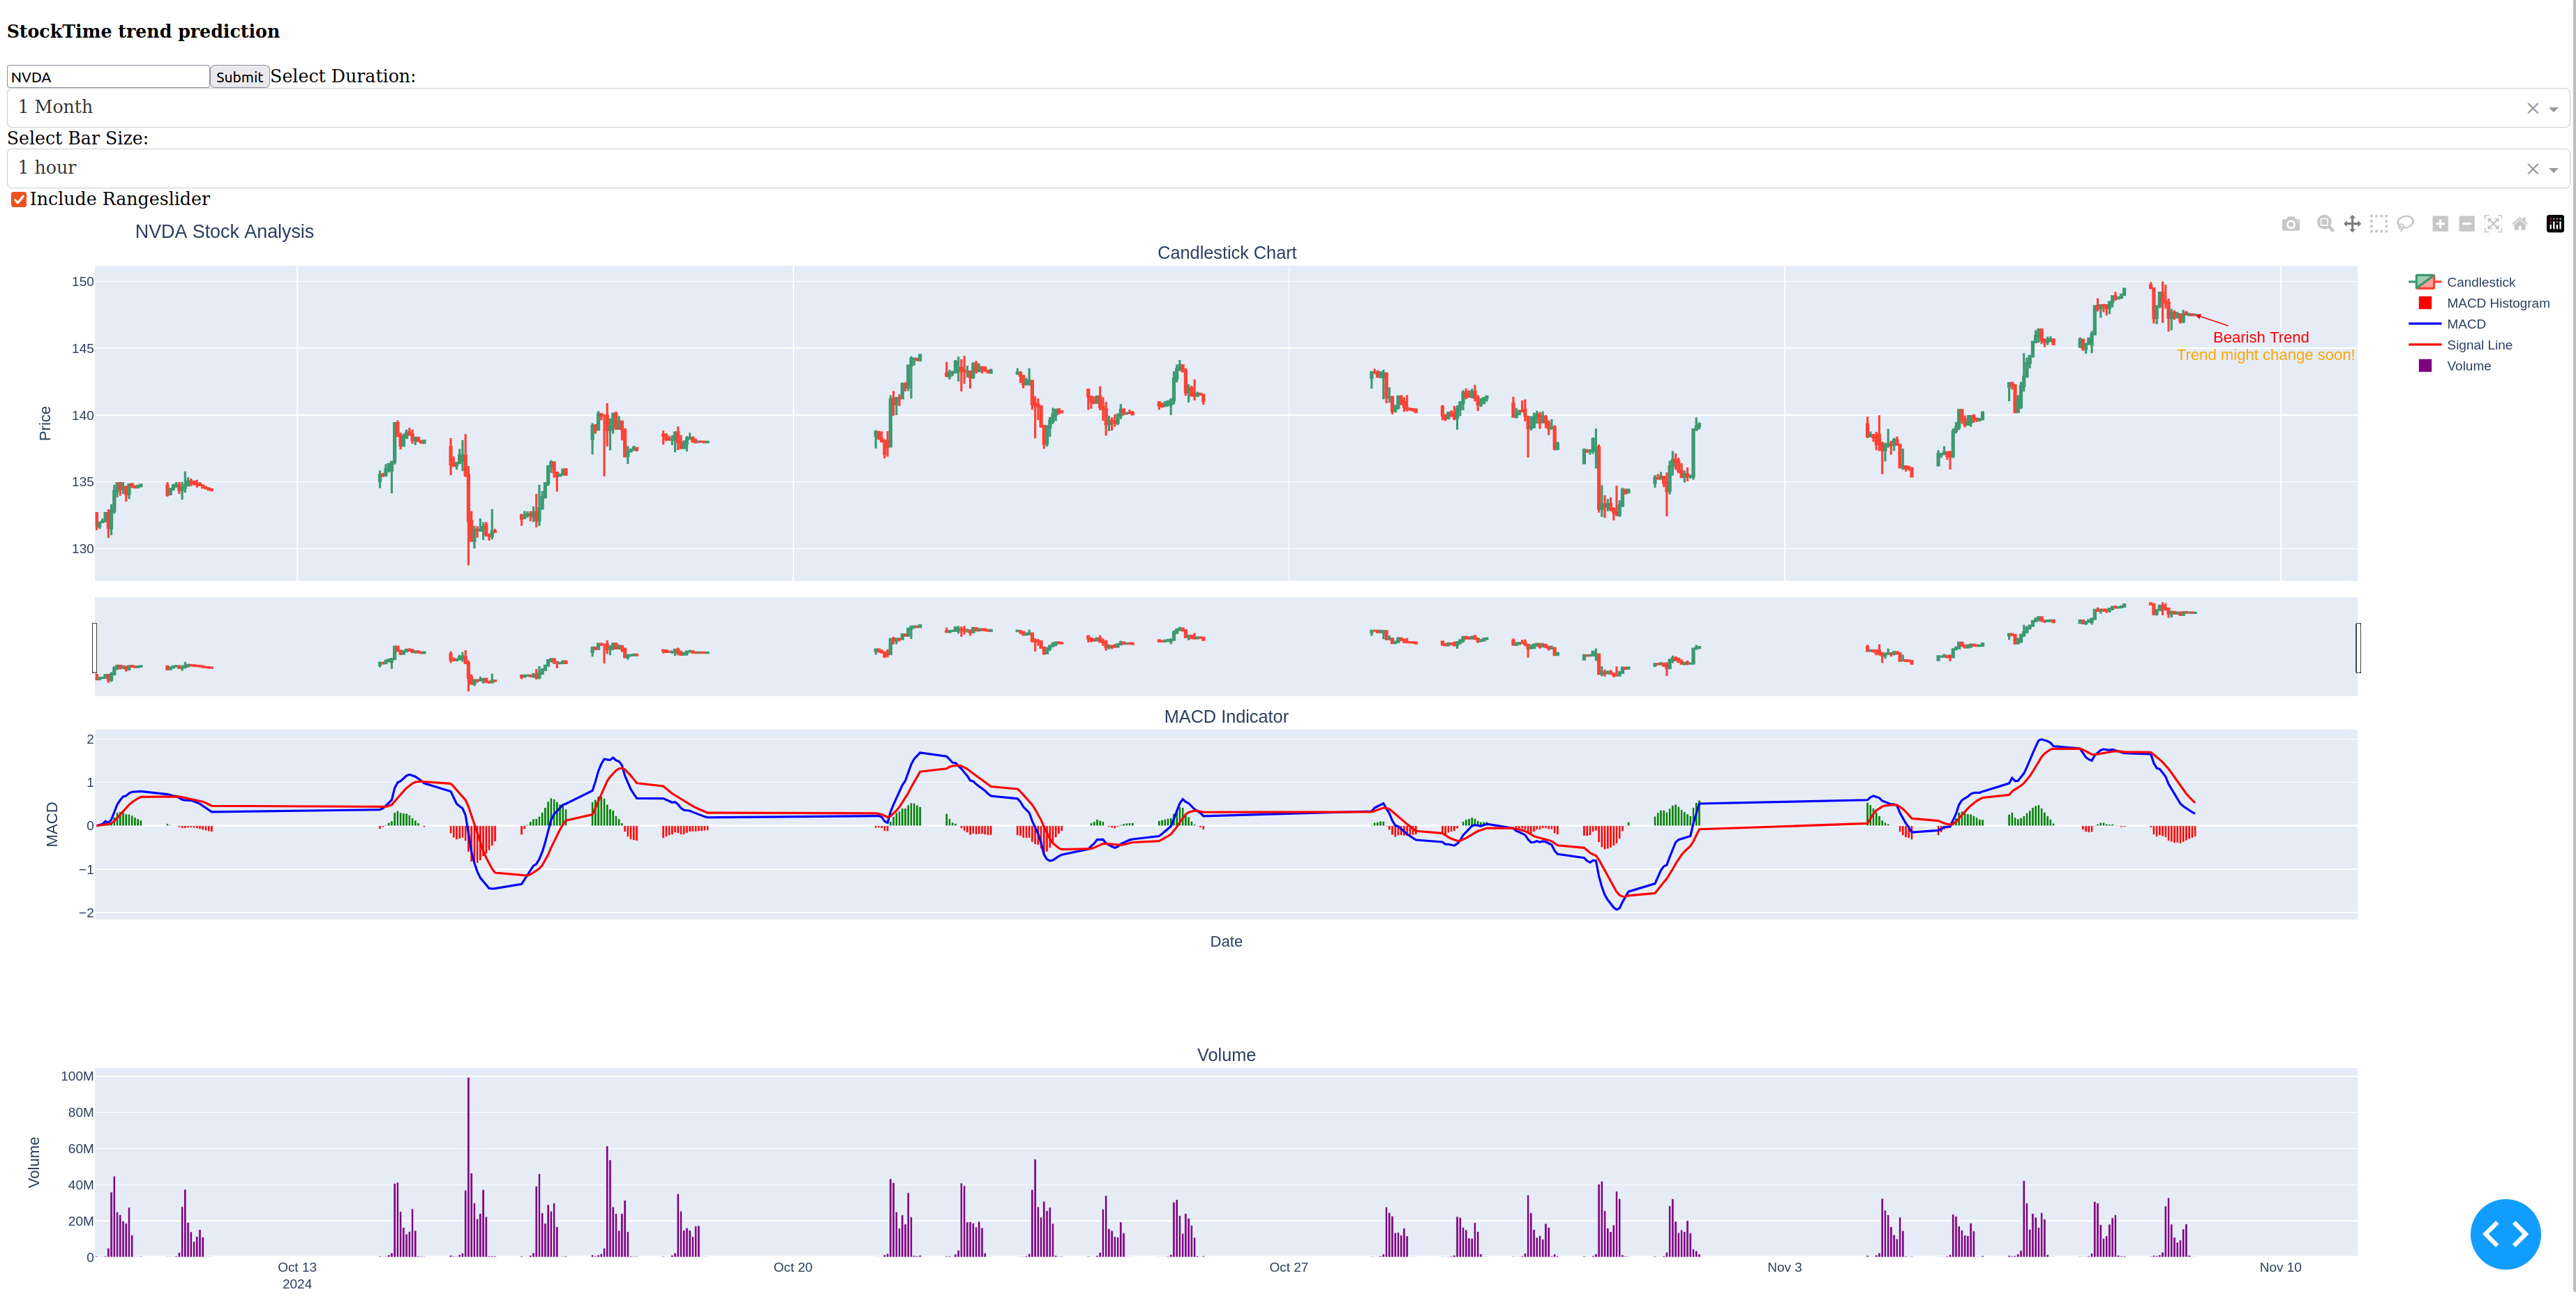
Trend prediciton #1
-
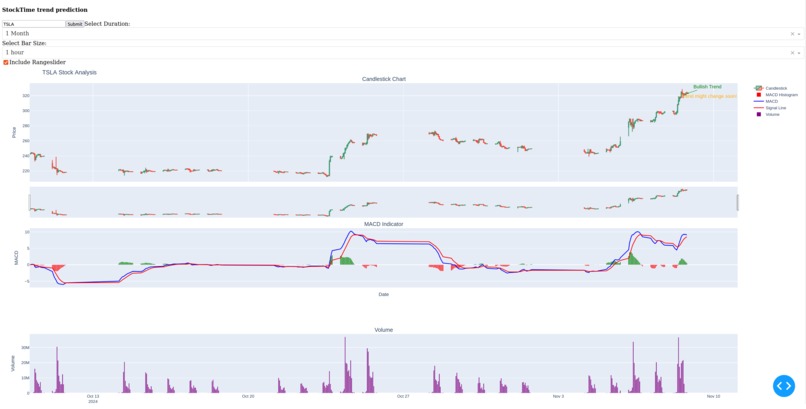
Trend prediciton #2
-
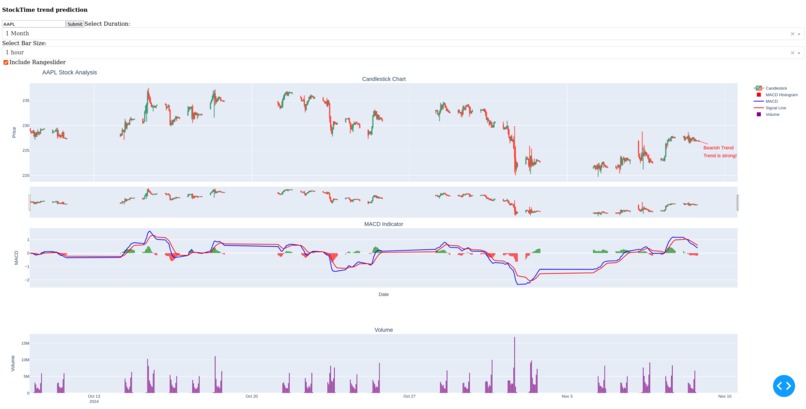
Trend prediciton #3


Inspiration
The idea for StockTime stems from the growing interest in algorithmic trading and the desire to make informed investment decisions based on data-driven analysis. Stock markets can be volatile, making it challenging for traders to accurately predict trends and make profitable decisions. By leveraging powerful technical analysis tools such as the MACD (Moving Average Convergence Divergence) and trade volume, I aimed to create a system that can predict potential trend reversals in stock prices. This would help investors/trading algorithms anticipate market changes before they occur.
What it does
StockTime is a predictive tool designed to forecast stock price trends based on technical indicators. Specifically, it uses the MACD and volume of trades to identify bullish and bearish trends, as well as the likelihood of a trend reversal. The tool tracks the MACD crossovers, histogram changes, and volume spikes to provide real-time trend predictions. It offers users:
- Bullish/Neutral/Bearish Trend Indicators based on MACD behavior.
- Trend Change Predictions by analyzing whether the MACD histogram is shrinking, signaling potential trend reversals.
- Trend Strength Suggestions, letting users know if the trend is strong or if a change is imminent.
- Visual indicators to make the predictions more intuitive.
- Support of all possible stock indexes.
How we built it
StockTime using Python and several popular libraries:
- Pandas for data manipulation and analysis.
- Matplotlib/Plotly for visualizing stock data and trends.
- IBKR API to fetch real-time stock data and trading volumes.
- Numpy for efficient array manipulations required for calculating trend analysis indicators like MACD.
- Dash for front end.
The system calculates the MACD to capture momentum changes and uses the volume of trades to confirm the strength of the trend.
Challenges we ran into
- Real-time Data Access: Getting real-time stock data for accurate trend predictions posed a challenge, especially when pulling data from external APIs with rate-limiting.
- Choosing the Right Indicators: There are numerous technical indicators available, and tuning the right combination of MACD and volume to detect accurate trend changes required extensive experimentation.
- Initial Idea also included adding the DMA (Directional Movement Index) indicator, however the combination of them would make the prediction more difficult and prone to errors.
Accomplishments that we're proud of
- Real-time Prediction Model: StockTime is real-time stock prediction model that leverages the MACD and trade volume to anticipate potential trend changes.
- Performance & Optimization: The system works very fast for such complicated mathematical data calculations, data retrieval and manipulation.
- Interactive Visuals: The tool provides interactive charts with intuitive arrows and trend suggestions, which make it easier for users to visualize stock trends.
- Accurate Trend Indicators: Through rigorous testing, we improved the accuracy of detecting trend changes by analyzing the relationship between MACD histogram shrinkage and volume fluctuations.
- User Interface: The system has minimal user-friendly interface with actionable insights that can be easily interpreted by both novice and experienced traders.
What we learned
Algorithmic trading is a very interesting fields with a lot of details to dive into. There are hundreds of different trend indicators which can significantly help in technical analysis and be used in different trading strategies especially low-latency trading.
What's next for StockTime
- Add more indicators to increase the accuracy in predicitons.
- Mobile App Development.
- Imrove the front end of the system.
- Integrate the prediction with trading algorithm to test it in the real world environment.


Log in or sign up for Devpost to join the conversation.