My inspiration for this project was seeing so many friends and family members lose money while investing in stocks. I wanted to create a way for people to know whether or not to invest in a stock. It helps them have a general idea of how a stock will do in the future.
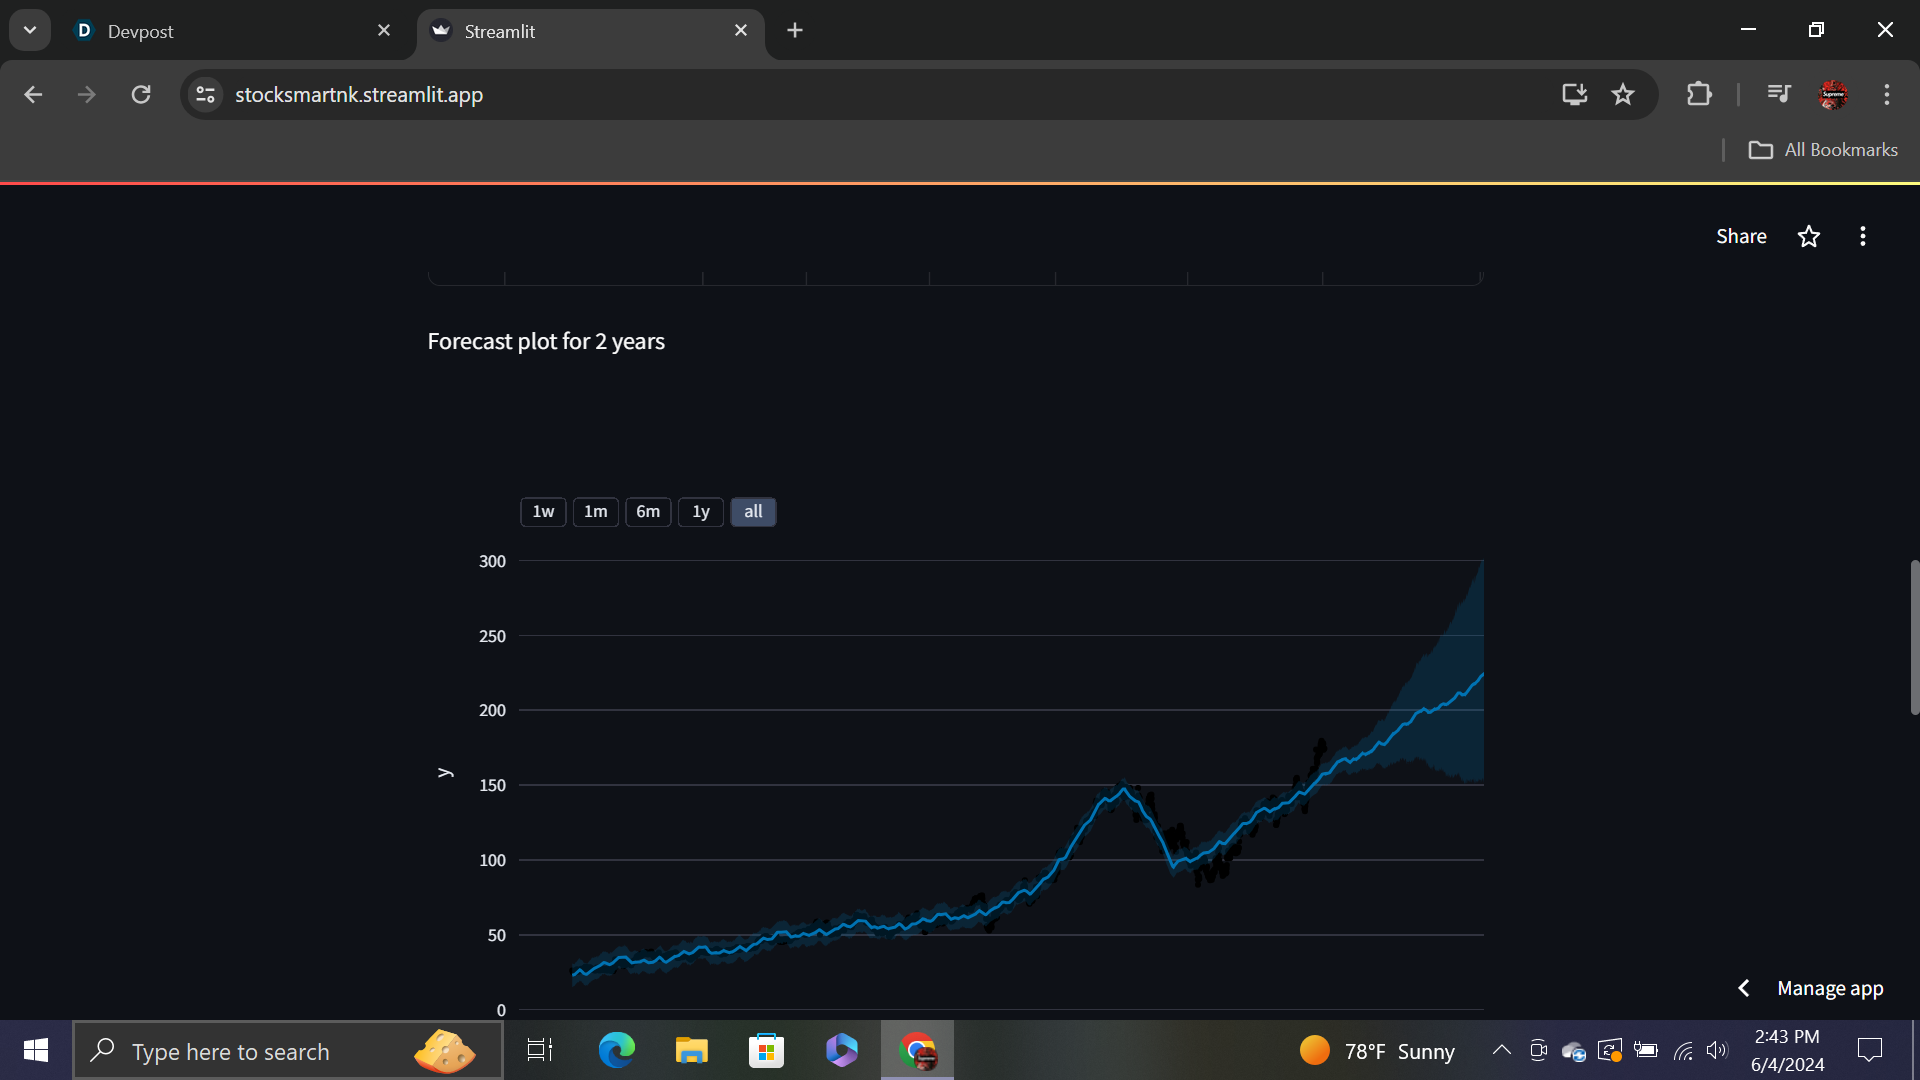
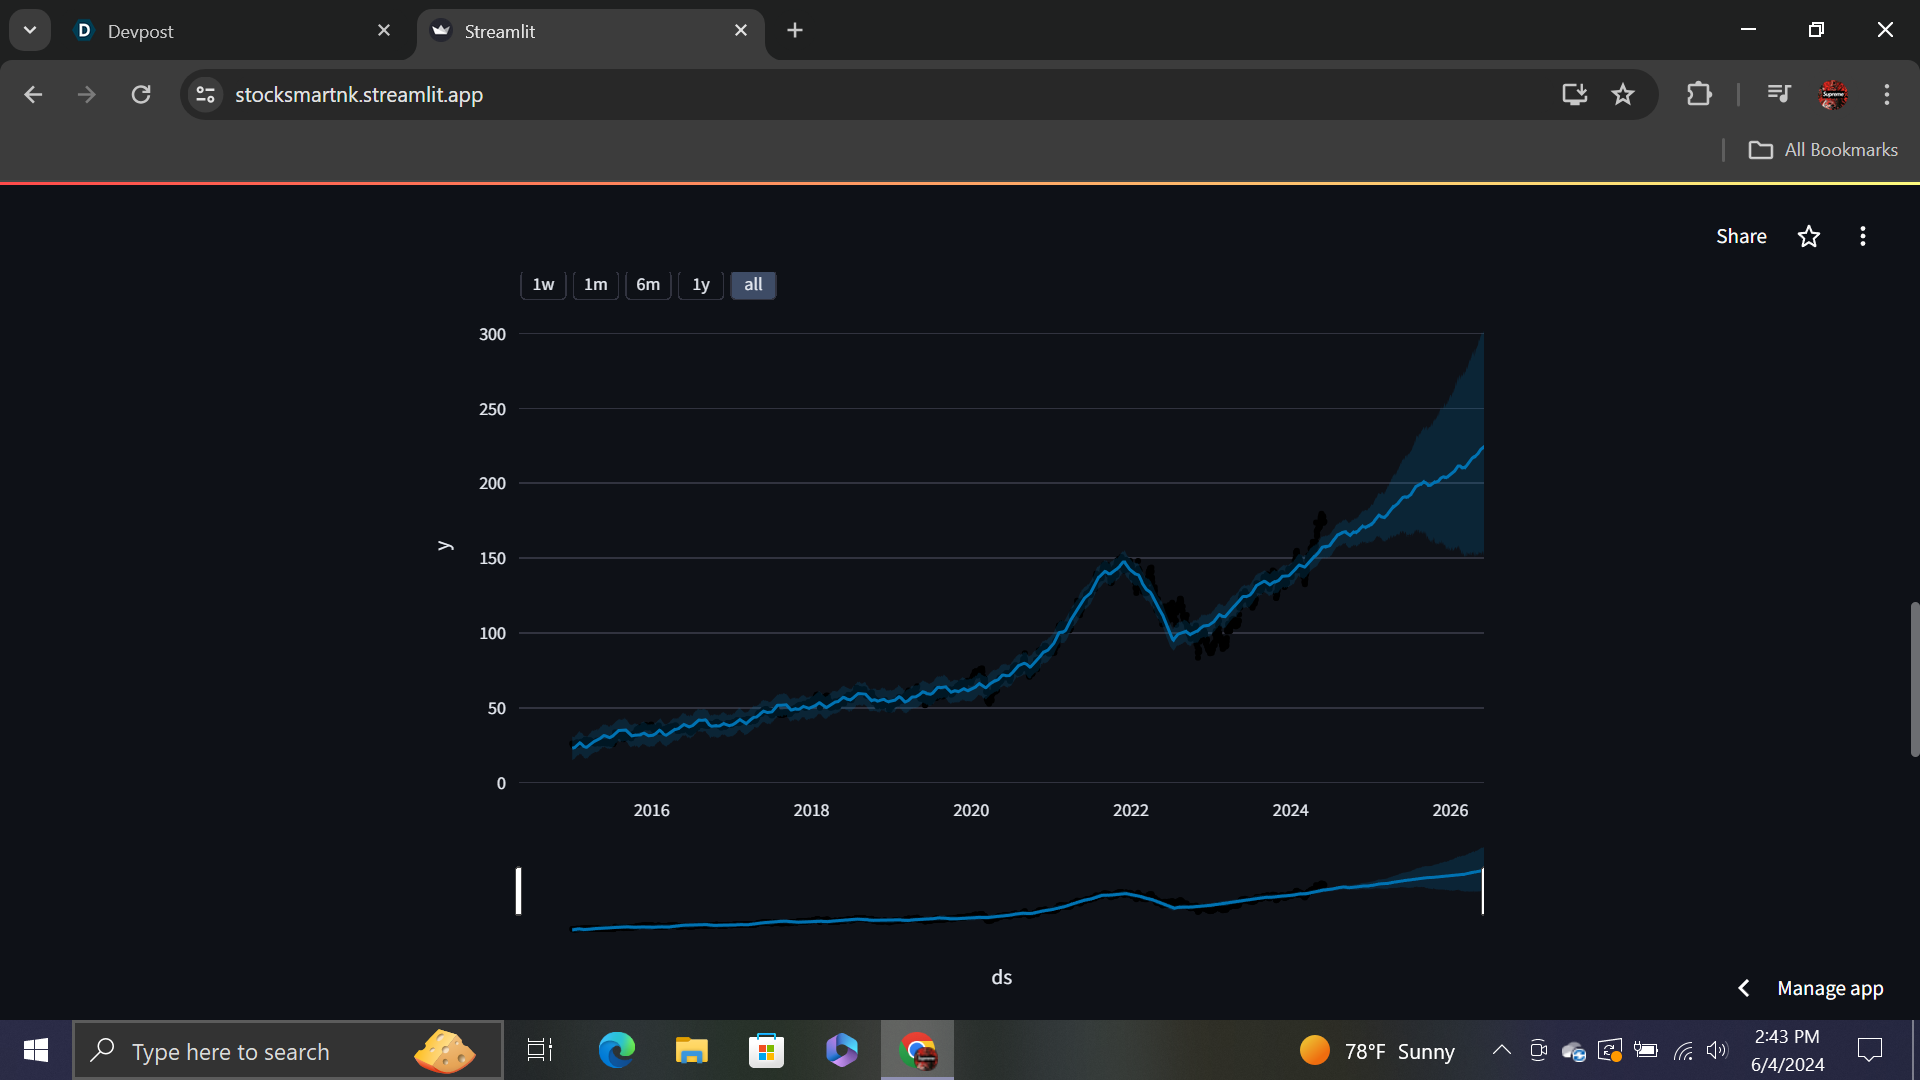
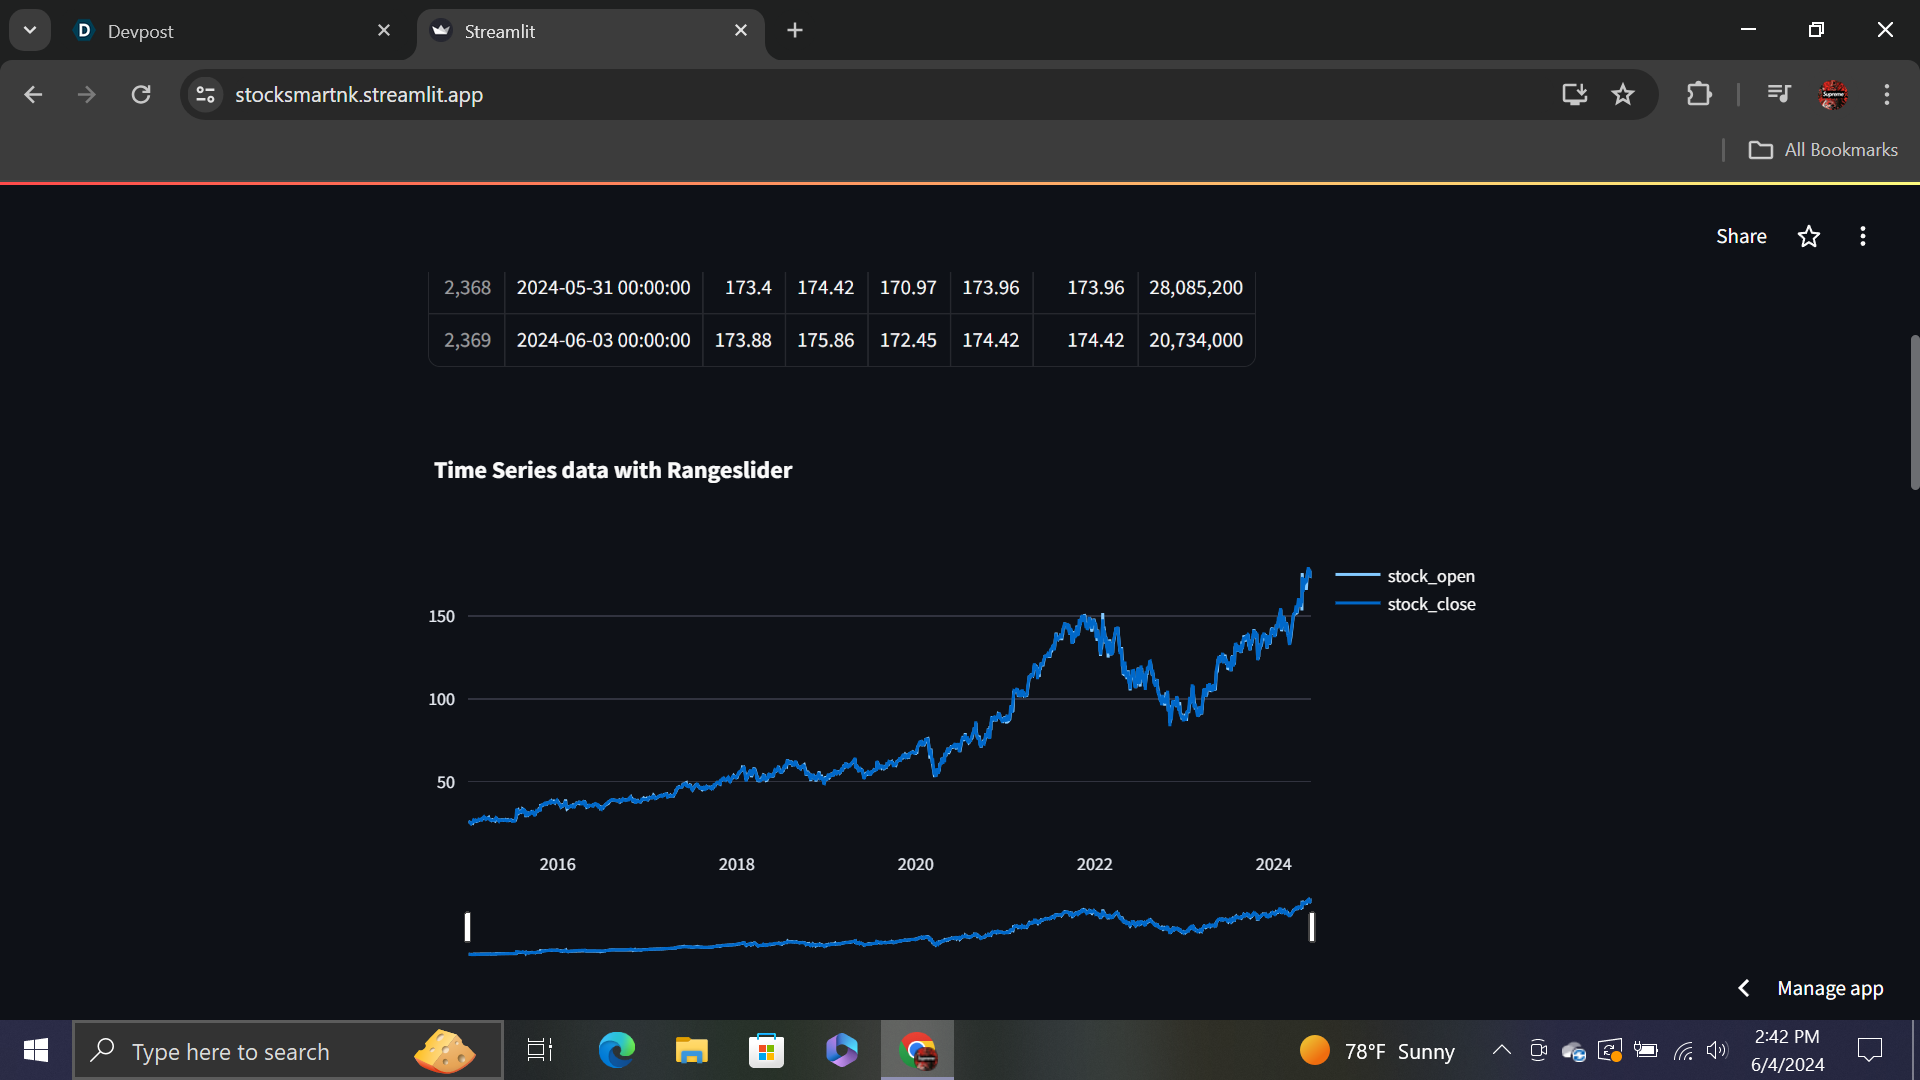
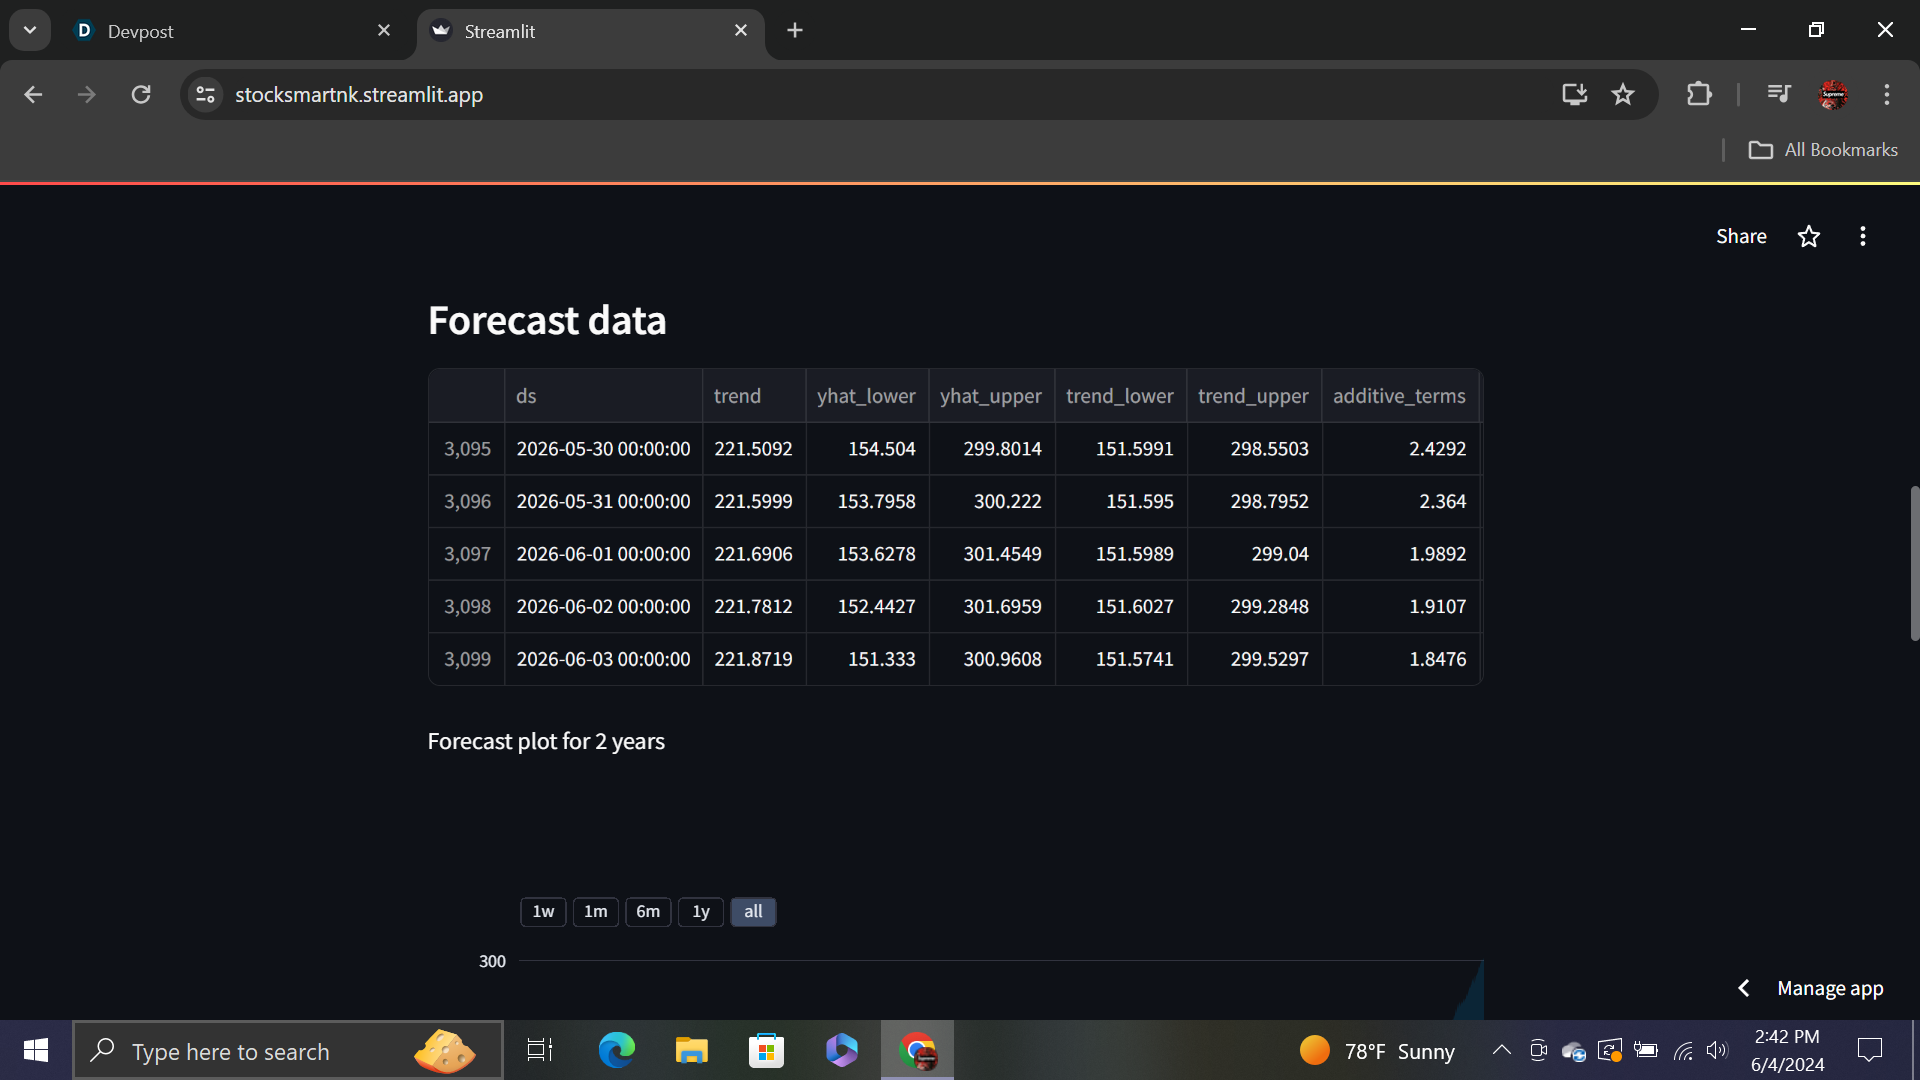
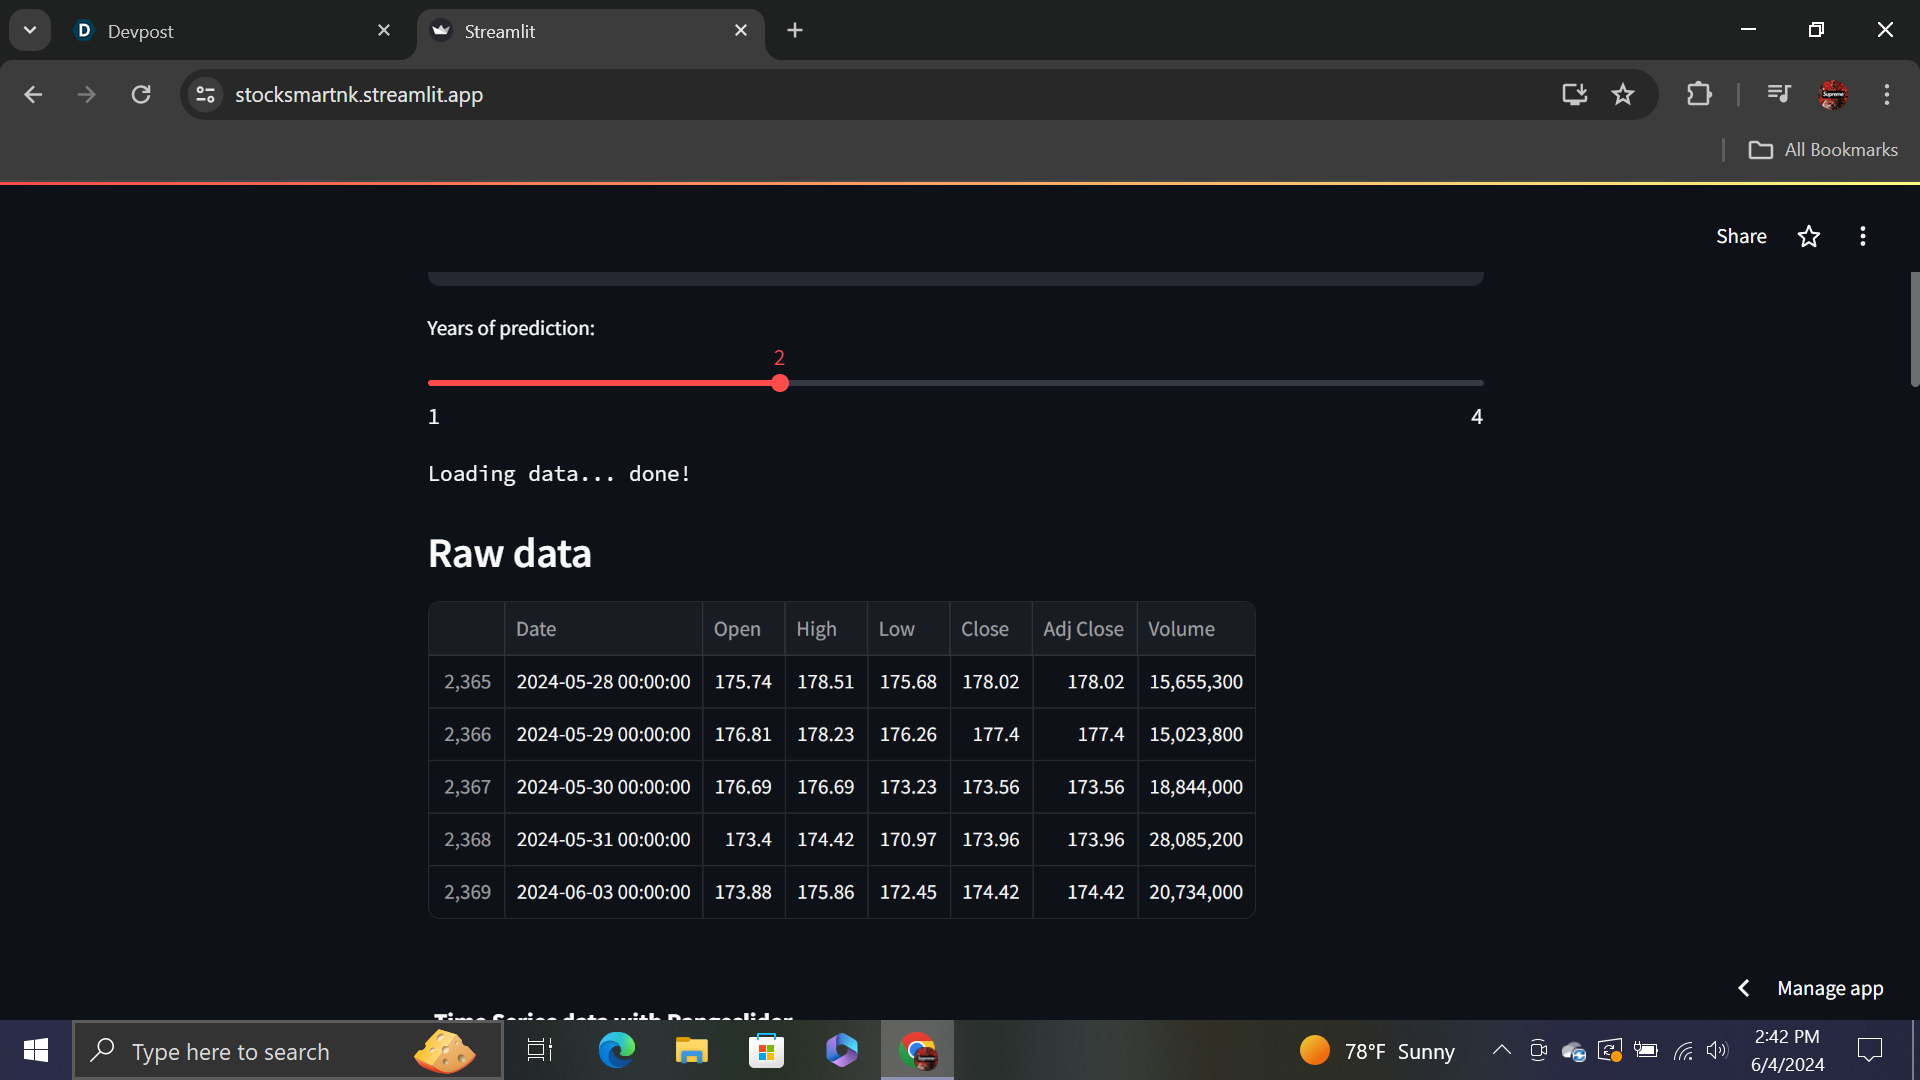
This project is a testament to the power of technology. It harnesses the capabilities of fbprophet and yfinance packages to pull stock data, and then I developed an algorithm that incorporates stock graph patterns used by professionals. The data is then compiled and visualized using plotly, projecting up to 4 years into the future.
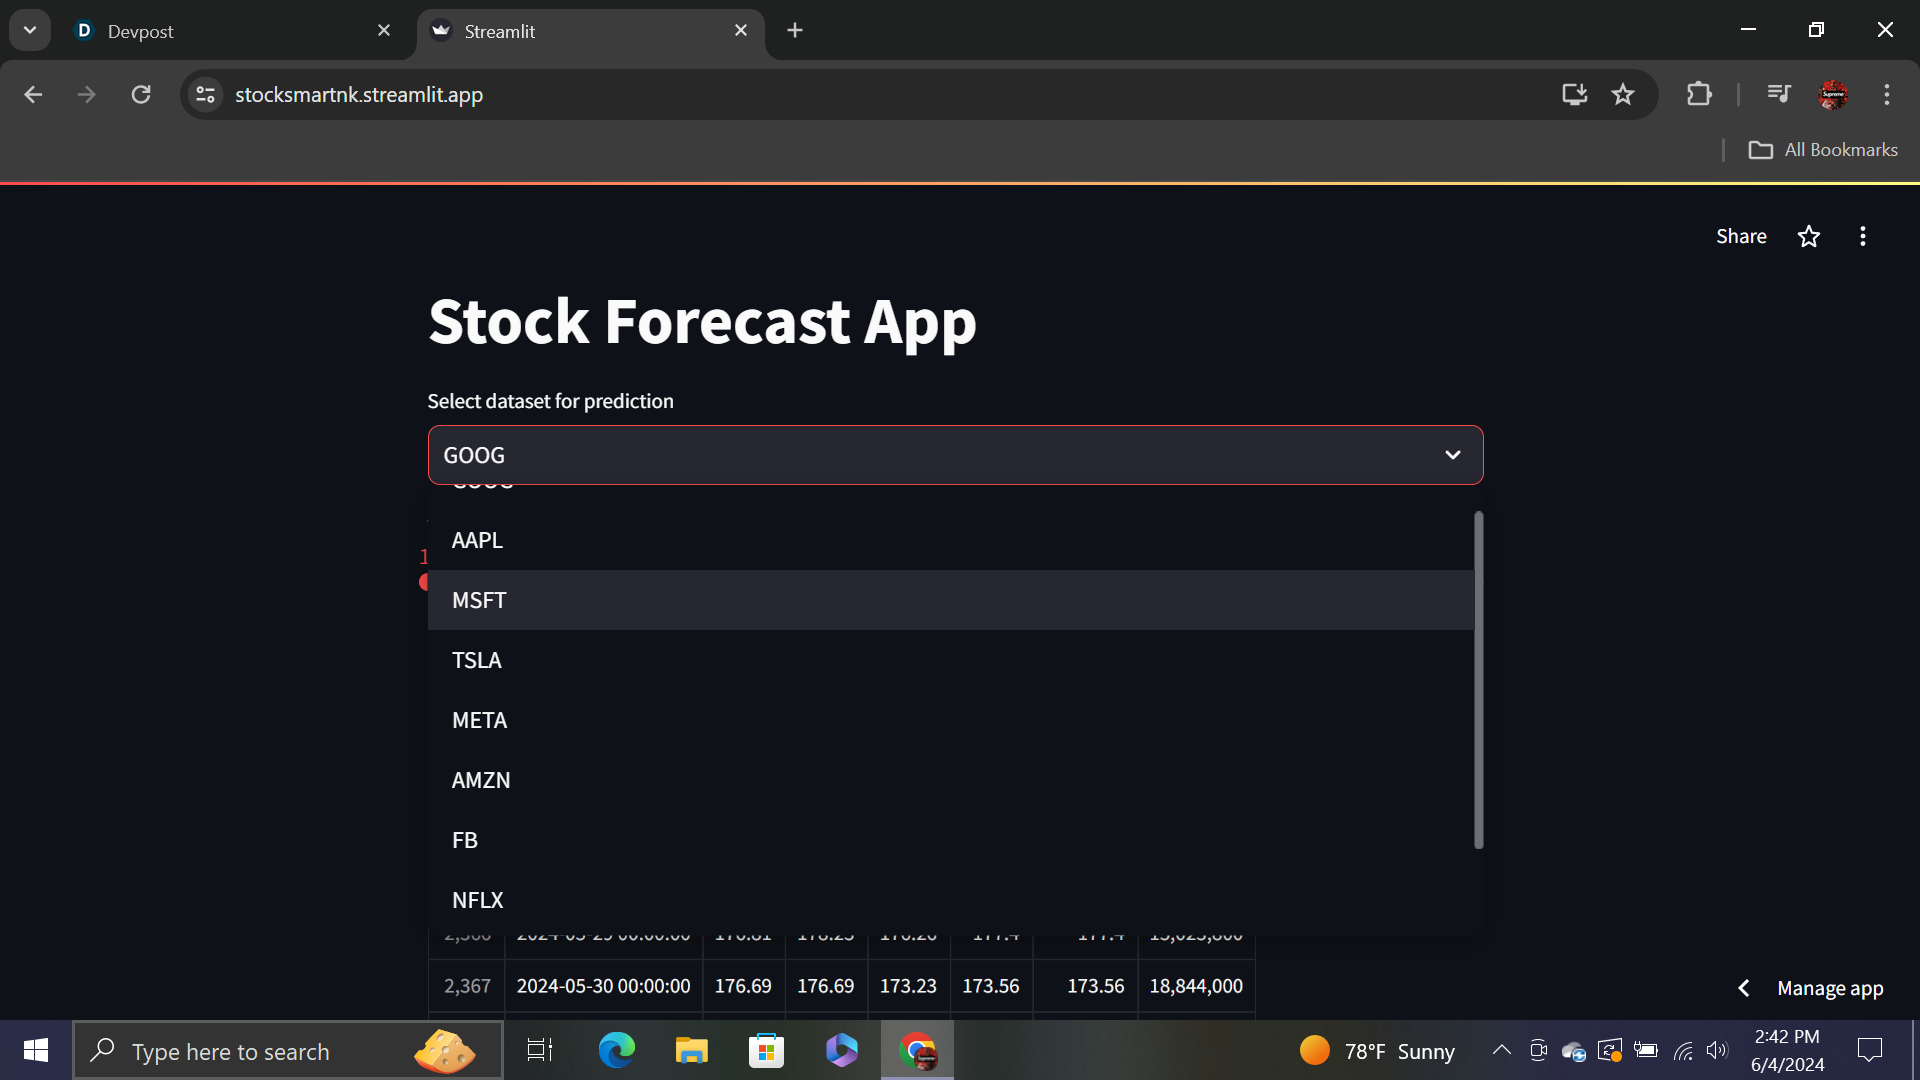
I built this application using Python, using the packages plotly, fbprophet, yfinance, and streamlit.
The most challenging part of this project was all the little details and the small bugs that came my way. Still, the most challenging part was the deployment, researching the packages I needed to do, and reading all the documentation, but I learned new things through it.
I'm proud of the result, how clean it is, and how well it works.
I learned that I should not give up. I wanted to scrap the project and do a different idea because this project seemed really hard; however I persevered and kept going, and I came out with this beautiful project
I want to add more features and make it more reliable before I launch it for the rest of the world to use free of charge.

Log in or sign up for Devpost to join the conversation.