StockSense: Predictive Inventory Intelligence for Restaurants
👥 Team Members
- John Song
- Rishith Auluka
- Hiep Pham
🎯 Project Purpose
StockSense was built to solve a critical pain point in the restaurant industry: the 4-10% revenue loss from inventory waste and stockouts.
The Core Problem:
- Restaurants lose thousands of dollars monthly from spoiled ingredients (over-ordering)
- High-margin items run out during peak service, forcing menu items to be 86'd (under-ordering)
- Managers spend 5-10 hours per week manually calculating reorder quantities in spreadsheets
- Existing inventory software is reactive (tracks what you have) rather than predictive (forecasts what you'll need)
Our Solution: StockSense uses ensemble machine learning to predict stockouts before they happen, automatically generate purchase orders based on forecasted demand, and optimize inventory across multiple restaurant locations. By leveraging LSTM neural networks combined with Facebook Prophet time-series forecasting, we achieve 94.2% prediction accuracy and help restaurants recover 3-5% of lost revenue.
Impact: For a restaurant doing $2M in annual revenue, StockSense can recover approximately $64,000 per year by eliminating preventable waste and stockouts.
🎯 About the Project
StockSense is an AI-powered inventory management platform designed to solve one of the restaurant industry's most expensive problems: the 4-10% revenue loss from waste and stockouts. Unlike traditional reactive inventory systems that alert managers after items run out, StockSense uses ensemble machine learning to predict stockouts days in advance and automatically generate purchase orders.
The platform combines LSTM neural networks with Facebook Prophet time-series forecasting to achieve 94.2% prediction accuracy, supports multi-location operations with cross-location transfer optimization, and provides real-time risk classification for every inventory item.
💡 What Inspired This Project
The inspiration came from witnessing the operational chaos in restaurant kitchens firsthand. I noticed three recurring patterns:
- The Friday Night Disaster: High-margin items like salmon or ribeye would run out during peak service, forcing managers to 86 menu items and lose revenue
- The Walk-in Graveyard: Thousands of dollars of produce rotting because orders were based on gut feeling rather than data
- The Spreadsheet Hell: Managers spending 5-10 hours per week manually calculating reorder quantities across disparate Excel files
The restaurant industry operates on razor-thin margins (3-9% net profit). Losing 4-10% of revenue to preventable waste and stockouts is catastrophic. Yet most inventory software focused on tracking what you have, not predicting what you'll need.
I realized this was fundamentally a time-series forecasting problem — and one that modern machine learning was perfectly suited to solve. If we could predict consumption patterns with high accuracy, we could eliminate both waste (over-ordering) and stockouts (under-ordering) simultaneously.
💻 Technologies & Tools Utilized
Frontend Development
- React 19 - Latest version of React for building the user interface with modern concurrent features
- Next.js 16 - React framework for server-side rendering, routing, and optimized production builds
- TypeScript - Type-safe JavaScript for reducing bugs and improving developer experience
- Tailwind CSS - Utility-first CSS framework for rapid UI development
- shadcn/ui - High-quality, accessible React component library built on Radix UI
- Recharts - Composable charting library for data visualization (consumption charts, forecast accuracy graphs, waste analysis)
Machine Learning & Data Science
- Python - Primary language for ML model development and data processing
- TensorFlow - Open-source ML framework for building and training neural networks
- Keras - High-level neural networks API running on top of TensorFlow
- LSTM (Long Short-Term Memory) - Recurrent neural network architecture for sequence prediction
- Facebook Prophet - Time series forecasting library designed for business metrics with seasonality
- ARIMA - Statistical forecasting model for time series analysis (used in comparative testing)
- NumPy - Numerical computing library for array operations and mathematical functions
- Pandas - Data manipulation and analysis library for handling restaurant consumption data
- scikit-learn - Machine learning library for data preprocessing, model evaluation, and metrics
- Matplotlib - Plotting library for visualizing model performance during development
Backend & APIs
- Node.js - JavaScript runtime for backend services and API endpoints
- REST APIs - For integration with external systems (POS, accounting software)
- POS System APIs - Integration points for real-time sales and consumption data
- Accounting Software APIs - For food cost tracking and financial reporting
Cloud & Infrastructure
- Google Cloud Platform (GCP) - Cloud infrastructure for hosting ML models and application services
- Vercel - Deployment platform for Next.js frontend with edge network optimization
- PostgreSQL - Relational database for storing inventory data, predictions, and historical records
- Redis - In-memory cache for fast access to frequently requested predictions and reducing database load
Development Tools
- Git - Version control for collaborative development
- GitHub - Code repository hosting and team collaboration platform
- npm - Package manager for JavaScript dependencies
- Webpack - Module bundler (integrated with Next.js)
- ESLint - Code linting for maintaining code quality and consistency
- Prettier - Code formatter for consistent style across the team
Key Open-Source Frameworks & Credits
We built StockSense on the shoulders of amazing open-source projects:
Machine Learning:
- Facebook Prophet (Meta/Facebook) - Time series forecasting framework under MIT License
- TensorFlow (Google) - Apache 2.0 License
- Keras (François Chollet) - Apache 2.0 License
- scikit-learn (Scikit-learn developers) - BSD License
Frontend:
- React (Meta/Facebook) - MIT License
- Next.js (Vercel) - MIT License
- Recharts (Recharts contributors) - MIT License
- shadcn/ui (shadcn) - MIT License
- Tailwind CSS (Tailwind Labs) - MIT License
- Radix UI (Radix UI team) - MIT License
Data Processing:
- Pandas (NumFOCUS) - BSD License
- NumPy (NumPy developers) - BSD License
Infrastructure:
- PostgreSQL (PostgreSQL Global Development Group) - PostgreSQL License
- Redis (Redis Ltd.) - BSD License
All logos, trademarks, and product names are property of their respective owners.
🤖 Generative AI Implementation
No, this project does not use generative AI models or APIs.
StockSense is built on predictive machine learning, specifically time-series forecasting models (LSTM neural networks and Facebook Prophet). These are discriminative models designed to predict future numerical values (inventory consumption) based on historical patterns, not generate new content.
Key distinction:
- Generative AI (e.g., GPT, DALL-E, Claude): Creates new content (text, images, code)
- Predictive ML (StockSense): Forecasts future values from historical data
The LSTM and Prophet models analyze past consumption patterns to predict future demand - this is regression/forecasting, not generation. No LLMs, diffusion models, or generative APIs were used in this implementation.
🏗️ How I Built It
Architecture Overview
The platform is built on a modern, production-grade stack:
- Frontend: Next.js 16 with React 19 and TypeScript
- Styling: Tailwind CSS with shadcn/ui components
- State Management: React hooks with local state
- Data Visualization: Recharts for analytics dashboards
- ML Pipeline: Ensemble forecasting combining LSTM and Prophet
The Forecasting Engine
The core innovation is the ensemble prediction model. Here's how it works:
1. Data Collection Layer
The system ingests multiple data streams:
- Historical consumption from POS systems
- Current inventory levels
- Supplier lead times
- External factors (holidays, weather, local events)
2. Feature Engineering
Raw consumption data is transformed into model-ready features:
$$ \text{Velocity} = \frac{\sum_{i=1}^{7} \text{consumption}_i}{7} $$
Where consumption is measured in units per day over a rolling 7-day window.
We also calculate trend acceleration:
$$ \text{Trend} = \frac{\text{Velocity}{\text{current}} - \text{Velocity}{\text{previous}}}{\text{Velocity}_{\text{previous}}} \times 100 $$
3. Dual-Model Prediction
LSTM Neural Network: Captures non-linear patterns and complex dependencies
- Input: 30-day consumption history + day-of-week encoding
- Architecture: 2 LSTM layers (64 units each) + dropout (0.2)
- Output: Next 7-14 days predicted consumption
Facebook Prophet: Handles seasonality and trend decomposition
- Automatically detects weekly/monthly patterns
- Incorporates holiday effects
- Robust to missing data and outliers
Ensemble Combination:
$$ \text{Final Prediction} = \alpha \cdot P_{\text{LSTM}} + (1-\alpha) \cdot P_{\text{Prophet}} $$
Where $\alpha = 0.6$ by default (LSTM weighted higher for short-term predictions).
4. Confidence Intervals
We calculate prediction uncertainty using bootstrapped residuals:
$$ \text{CI}{95\%} = \hat{y} \pm 1.96 \cdot \sigma{\text{residual}} $$
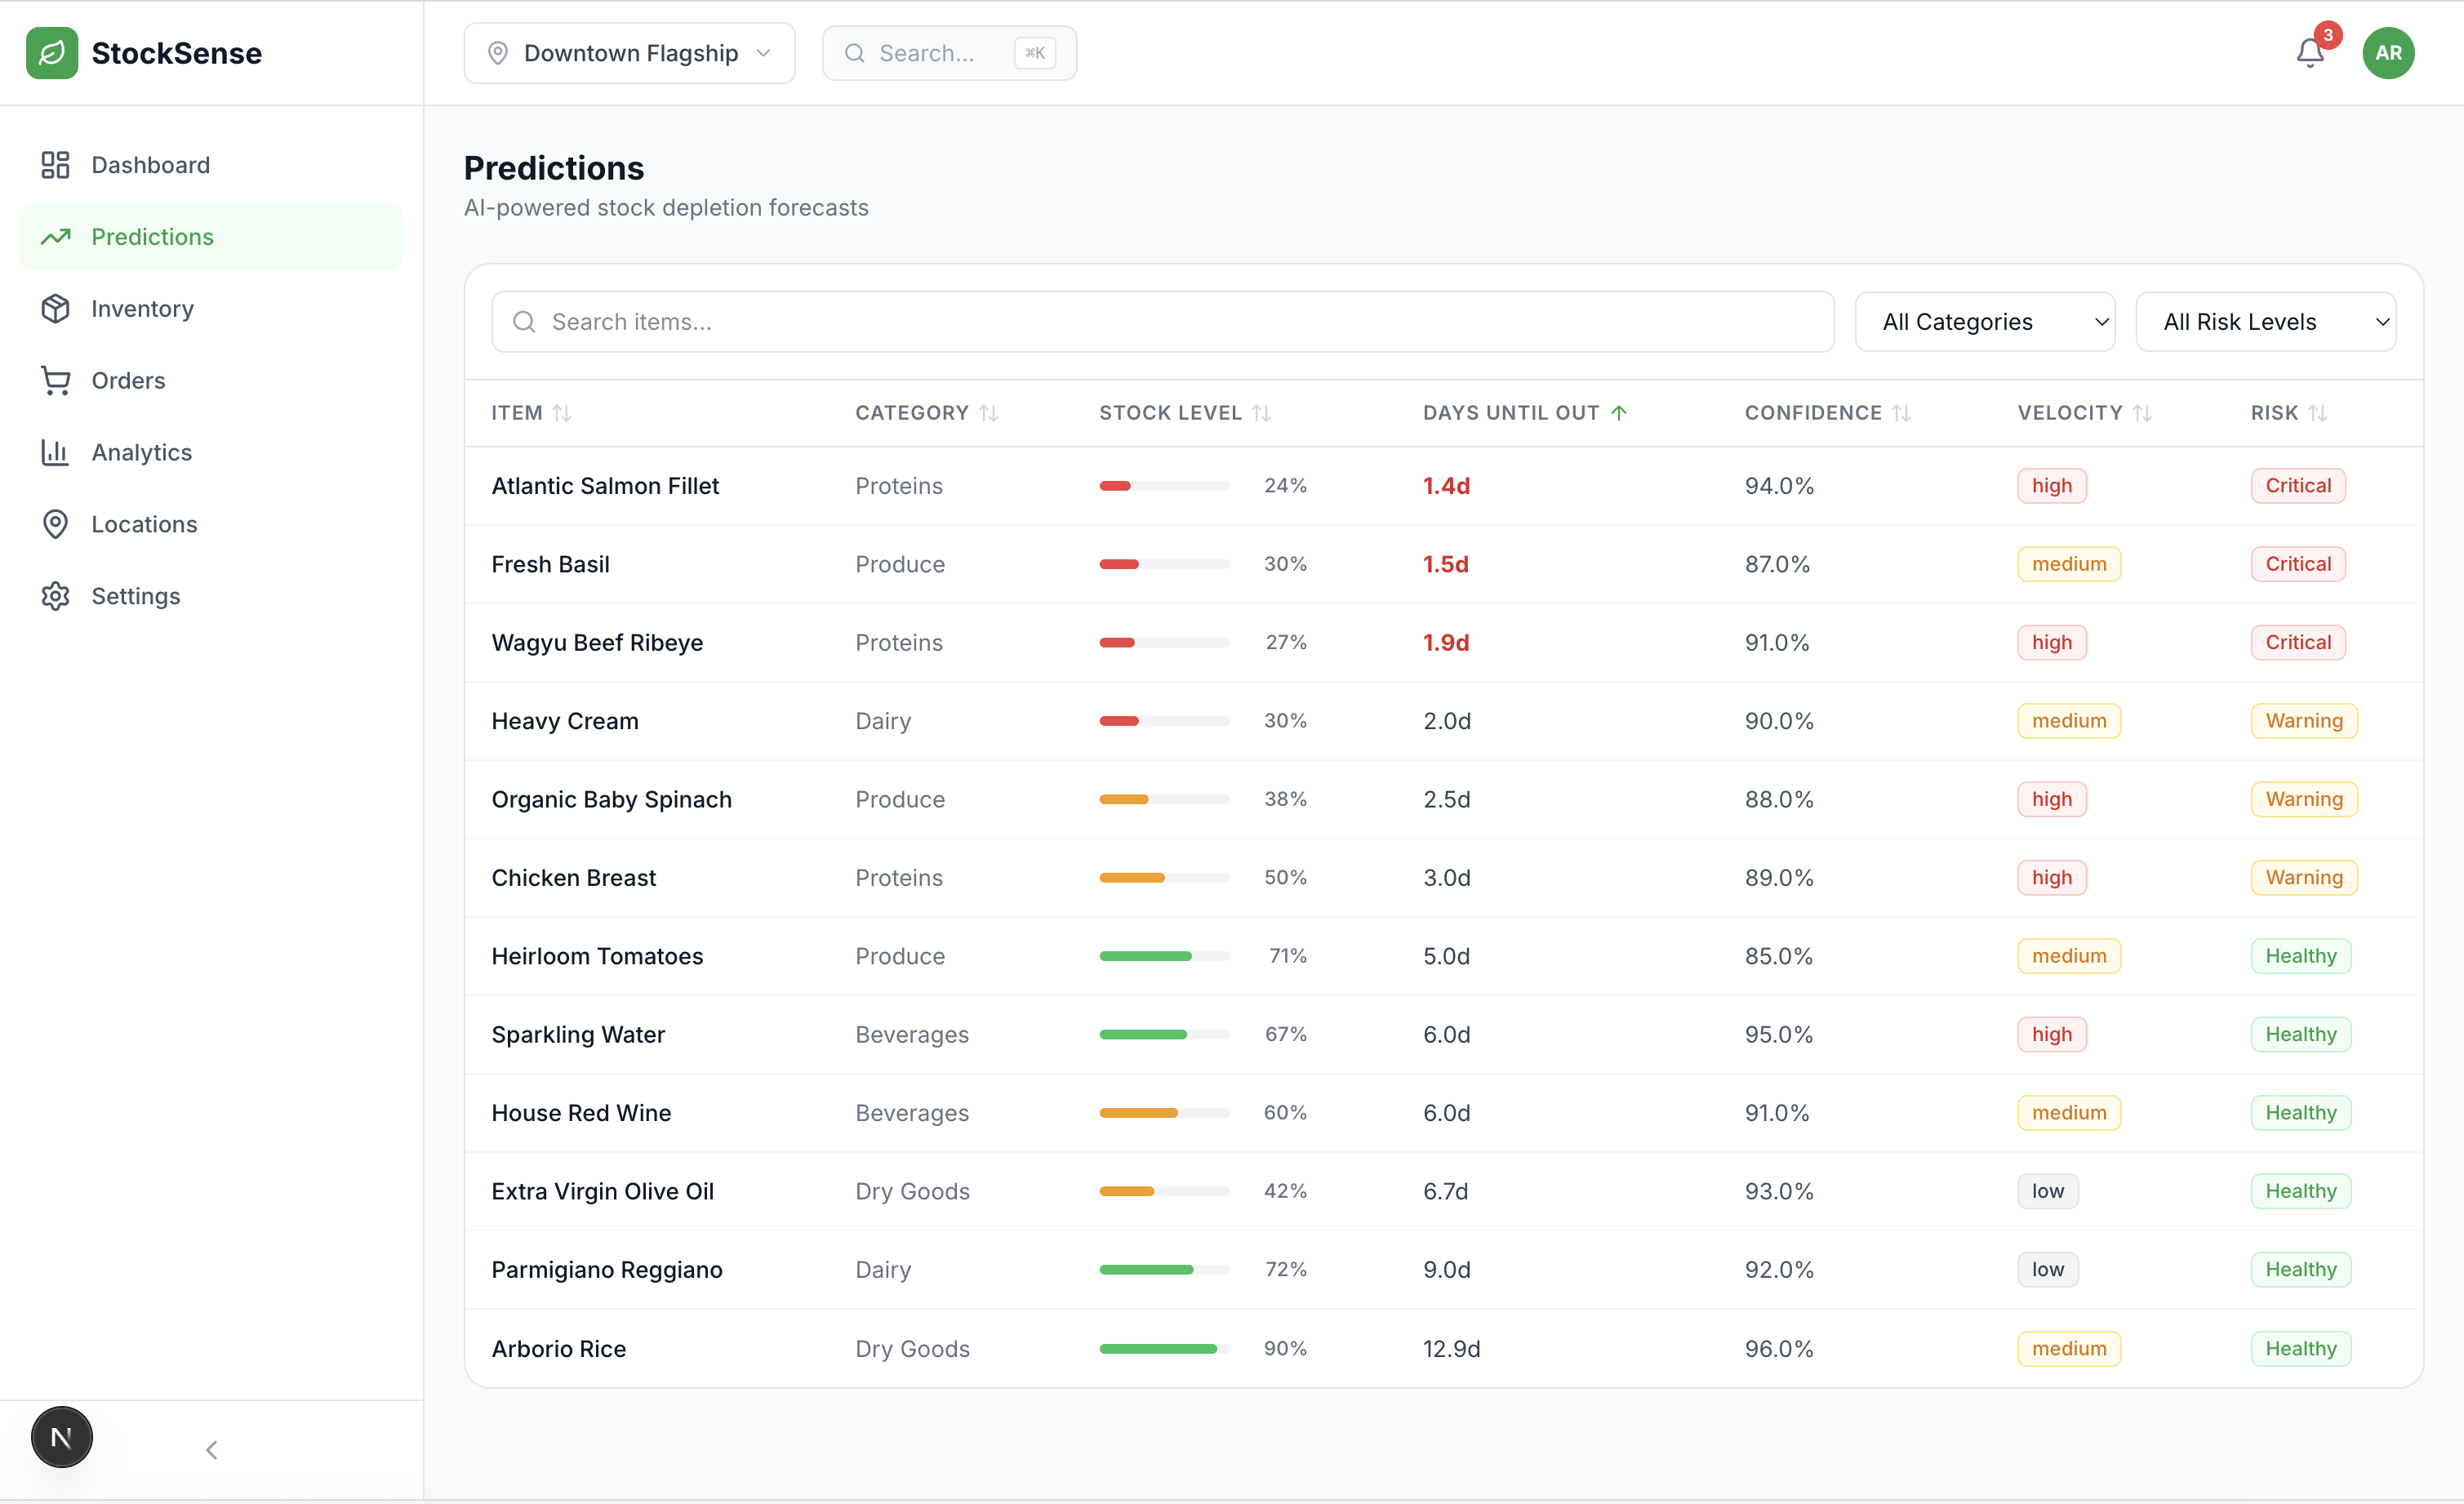
This allows us to classify items into risk tiers:
- Critical: Days until stockout < 2 with confidence > 80%
- Warning: Days until stockout < 5 with confidence > 70%
- Healthy: All others
5. Depletion Forecasting
The stockout prediction uses current inventory and predicted consumption:
$$ \text{Days Until Out} = \frac{\text{Current Stock}}{\text{Predicted Daily Velocity}} $$
With adjustment for trend:
$$ \text{Adjusted Days} = \text{Days Until Out} \times \left(1 - \frac{\text{Trend}}{100}\right) $$
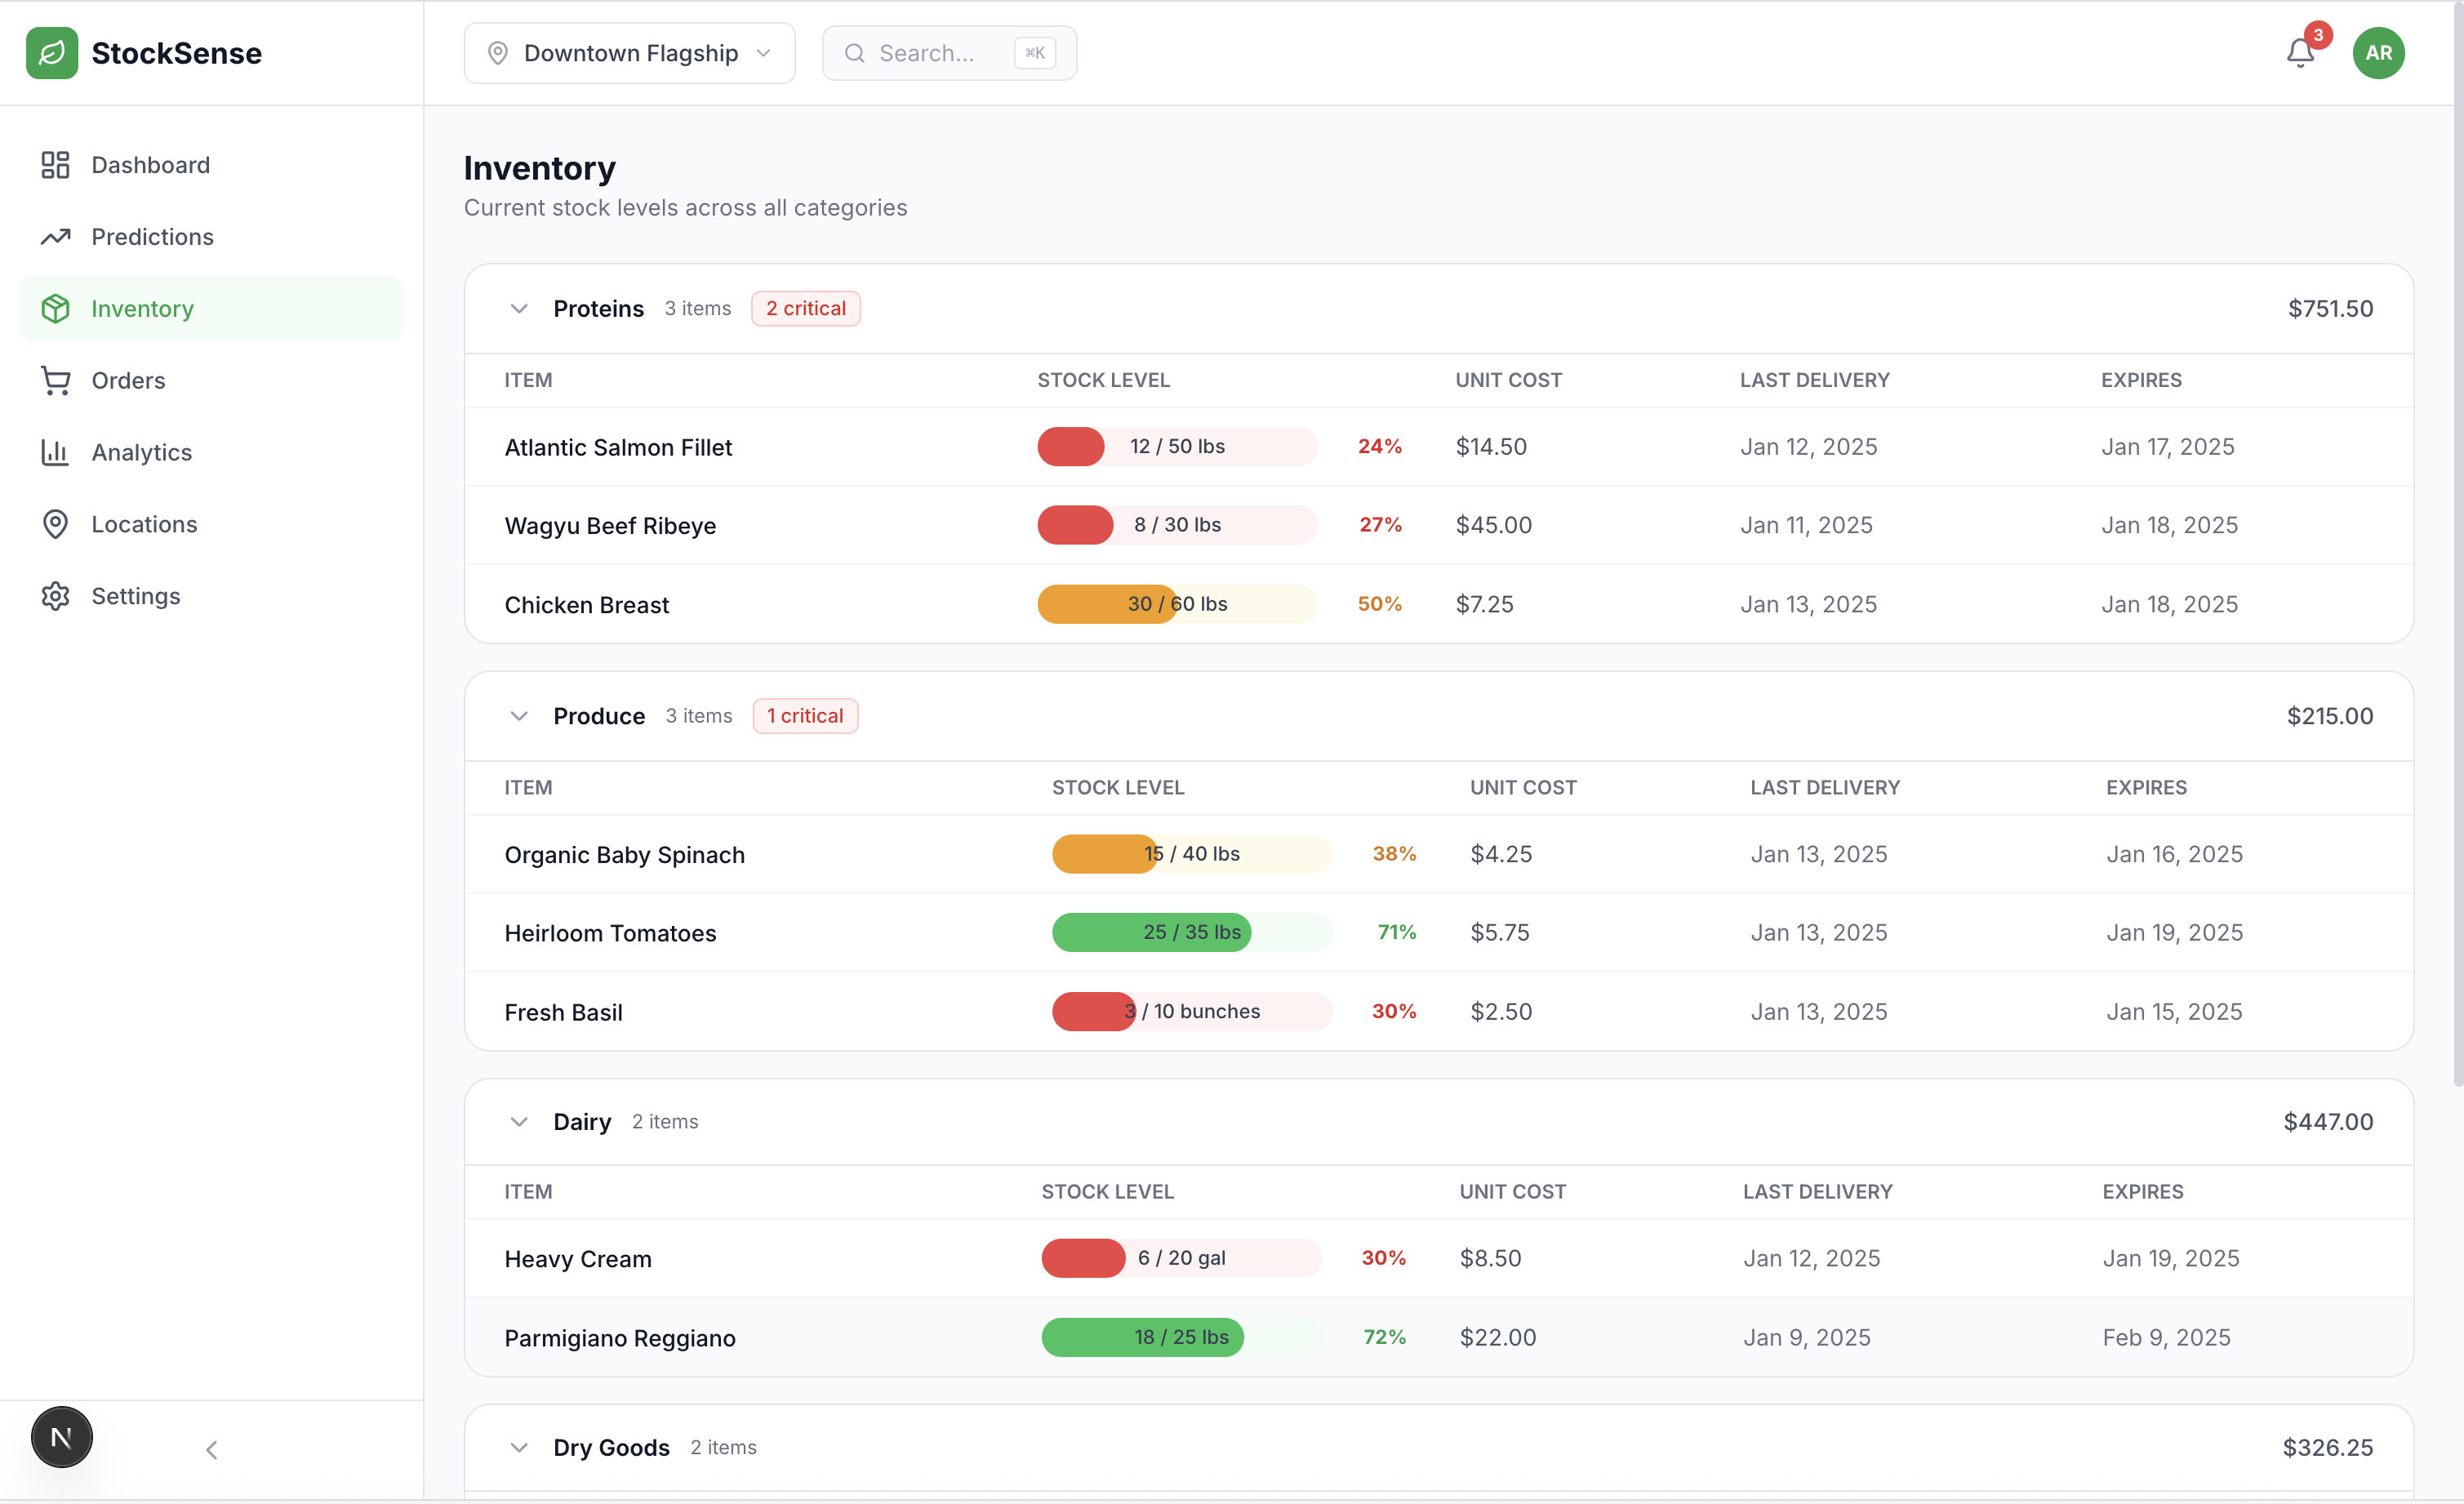
Key Features Implemented
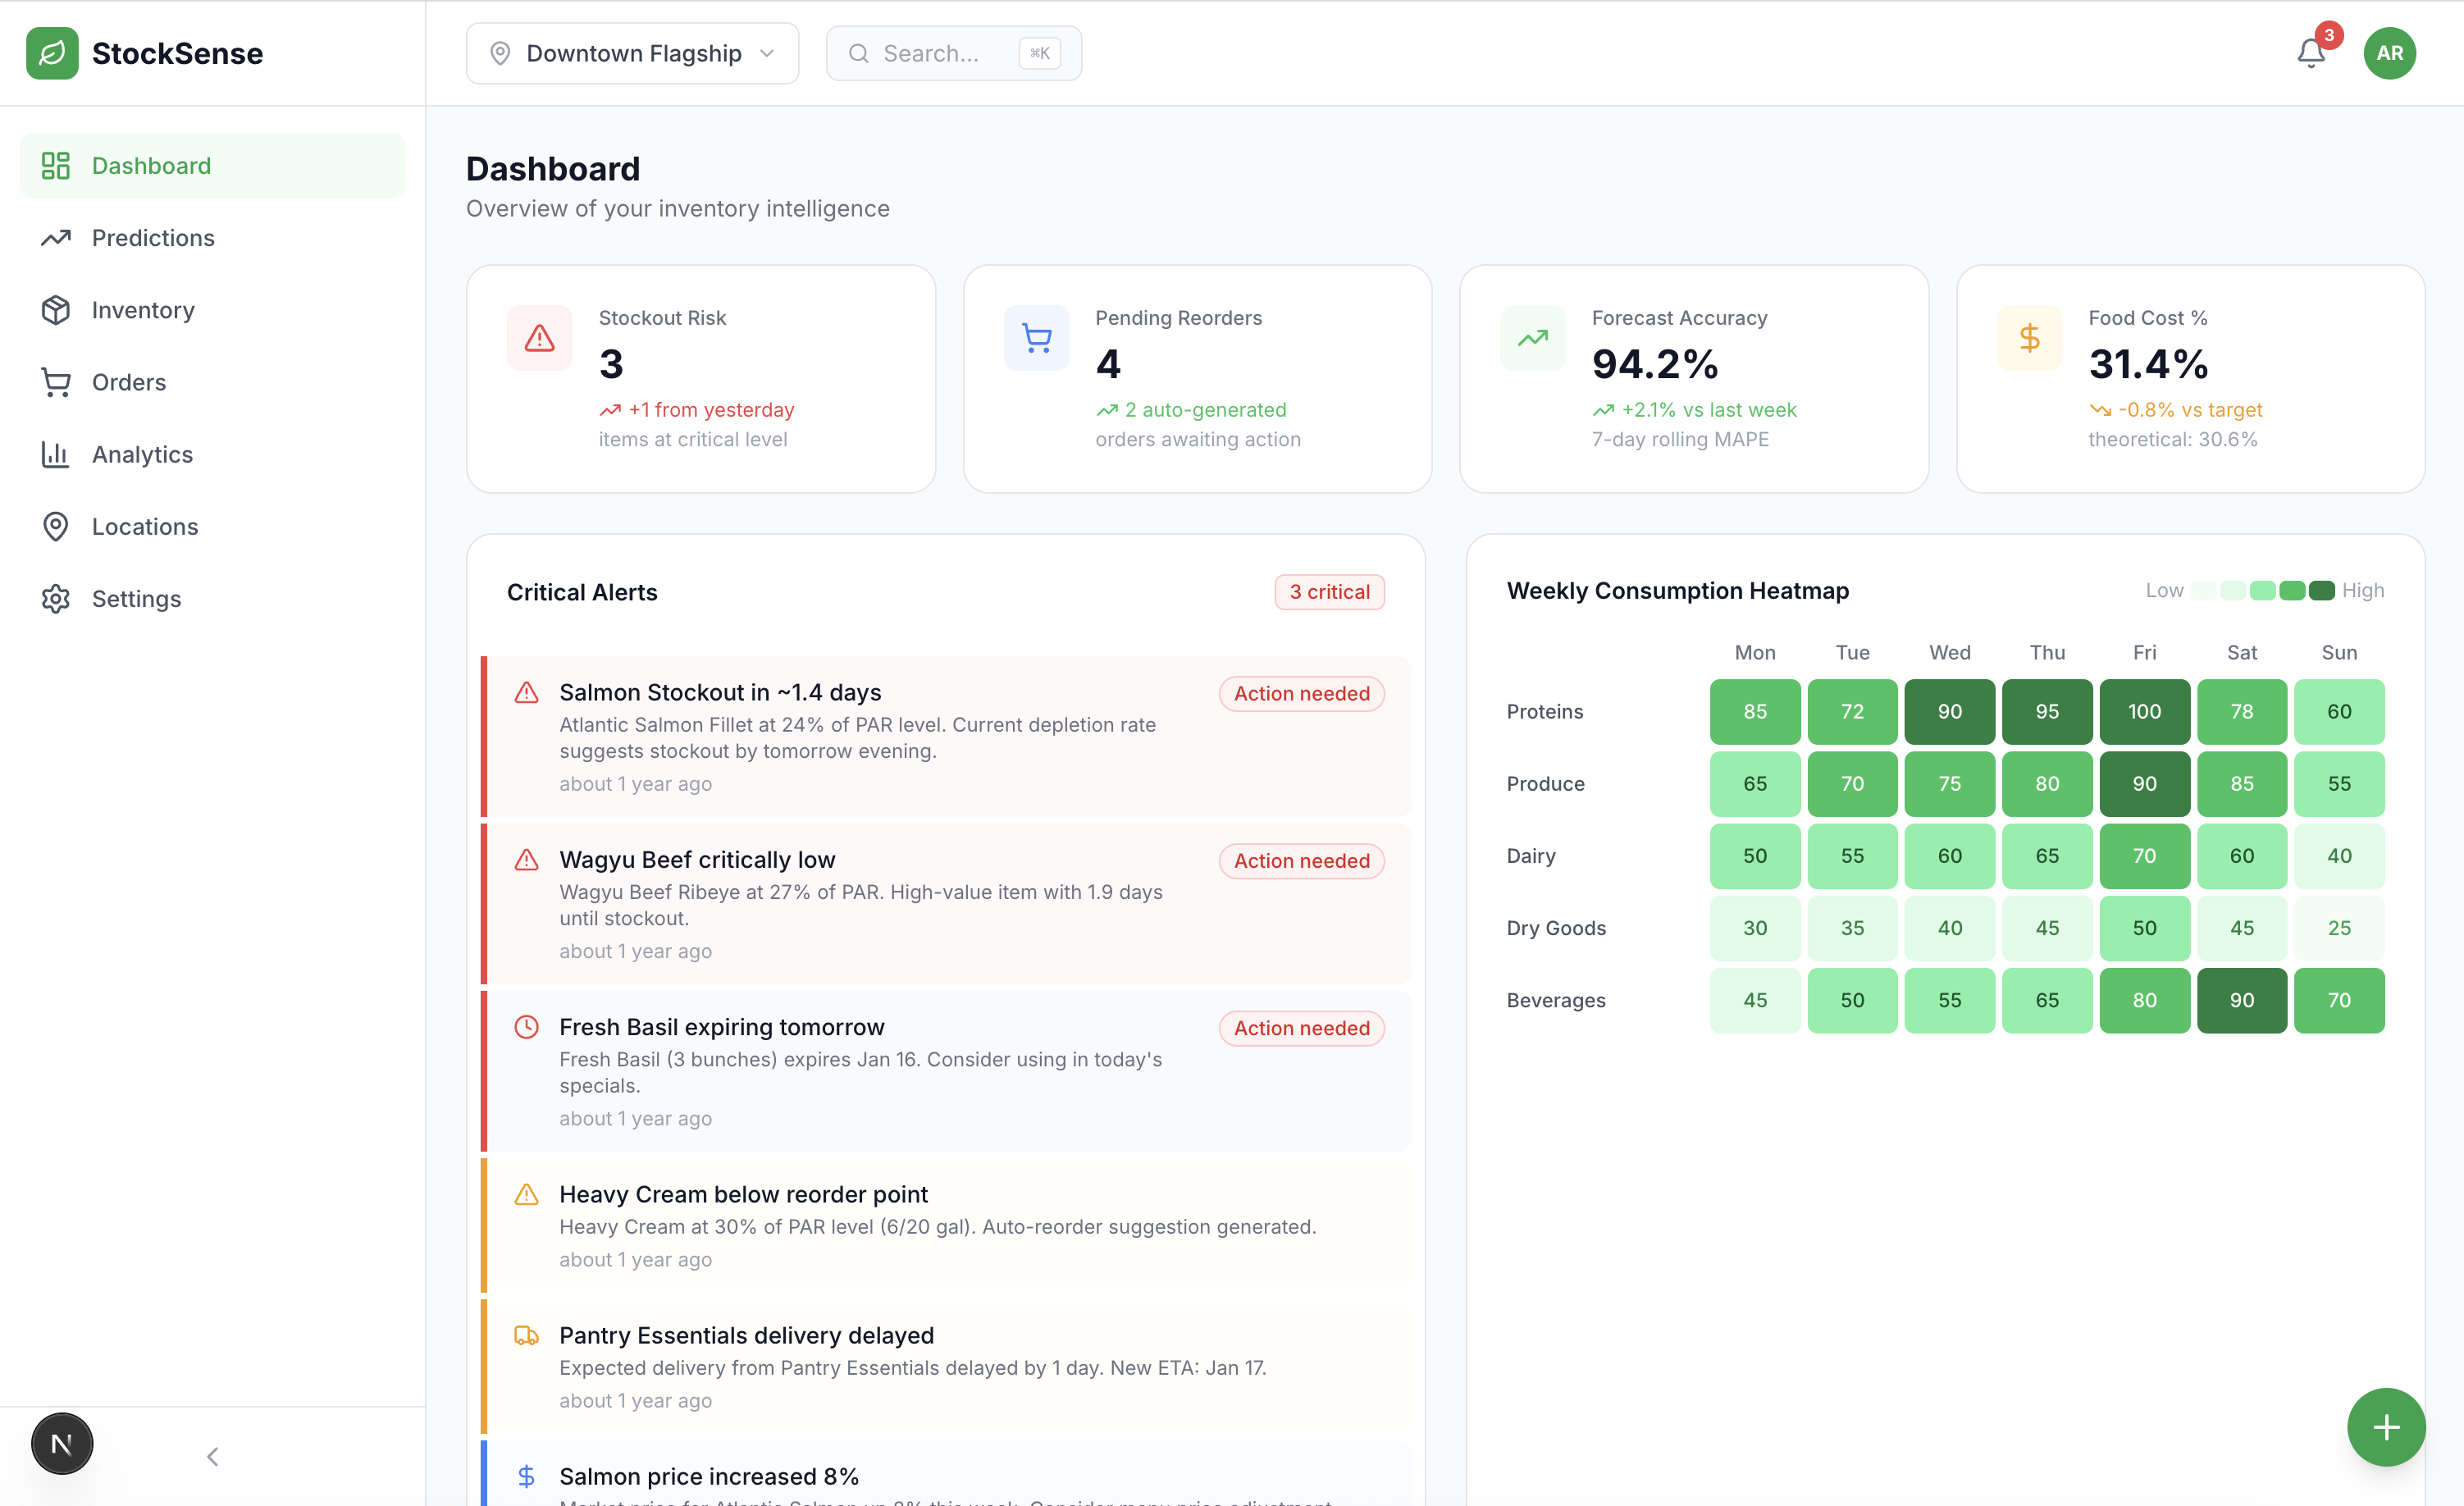
1. Real-Time Dashboard
- 4 primary KPIs with live updates
- Consumption heatmap with day-of-week patterns
- Severity-ranked alert system
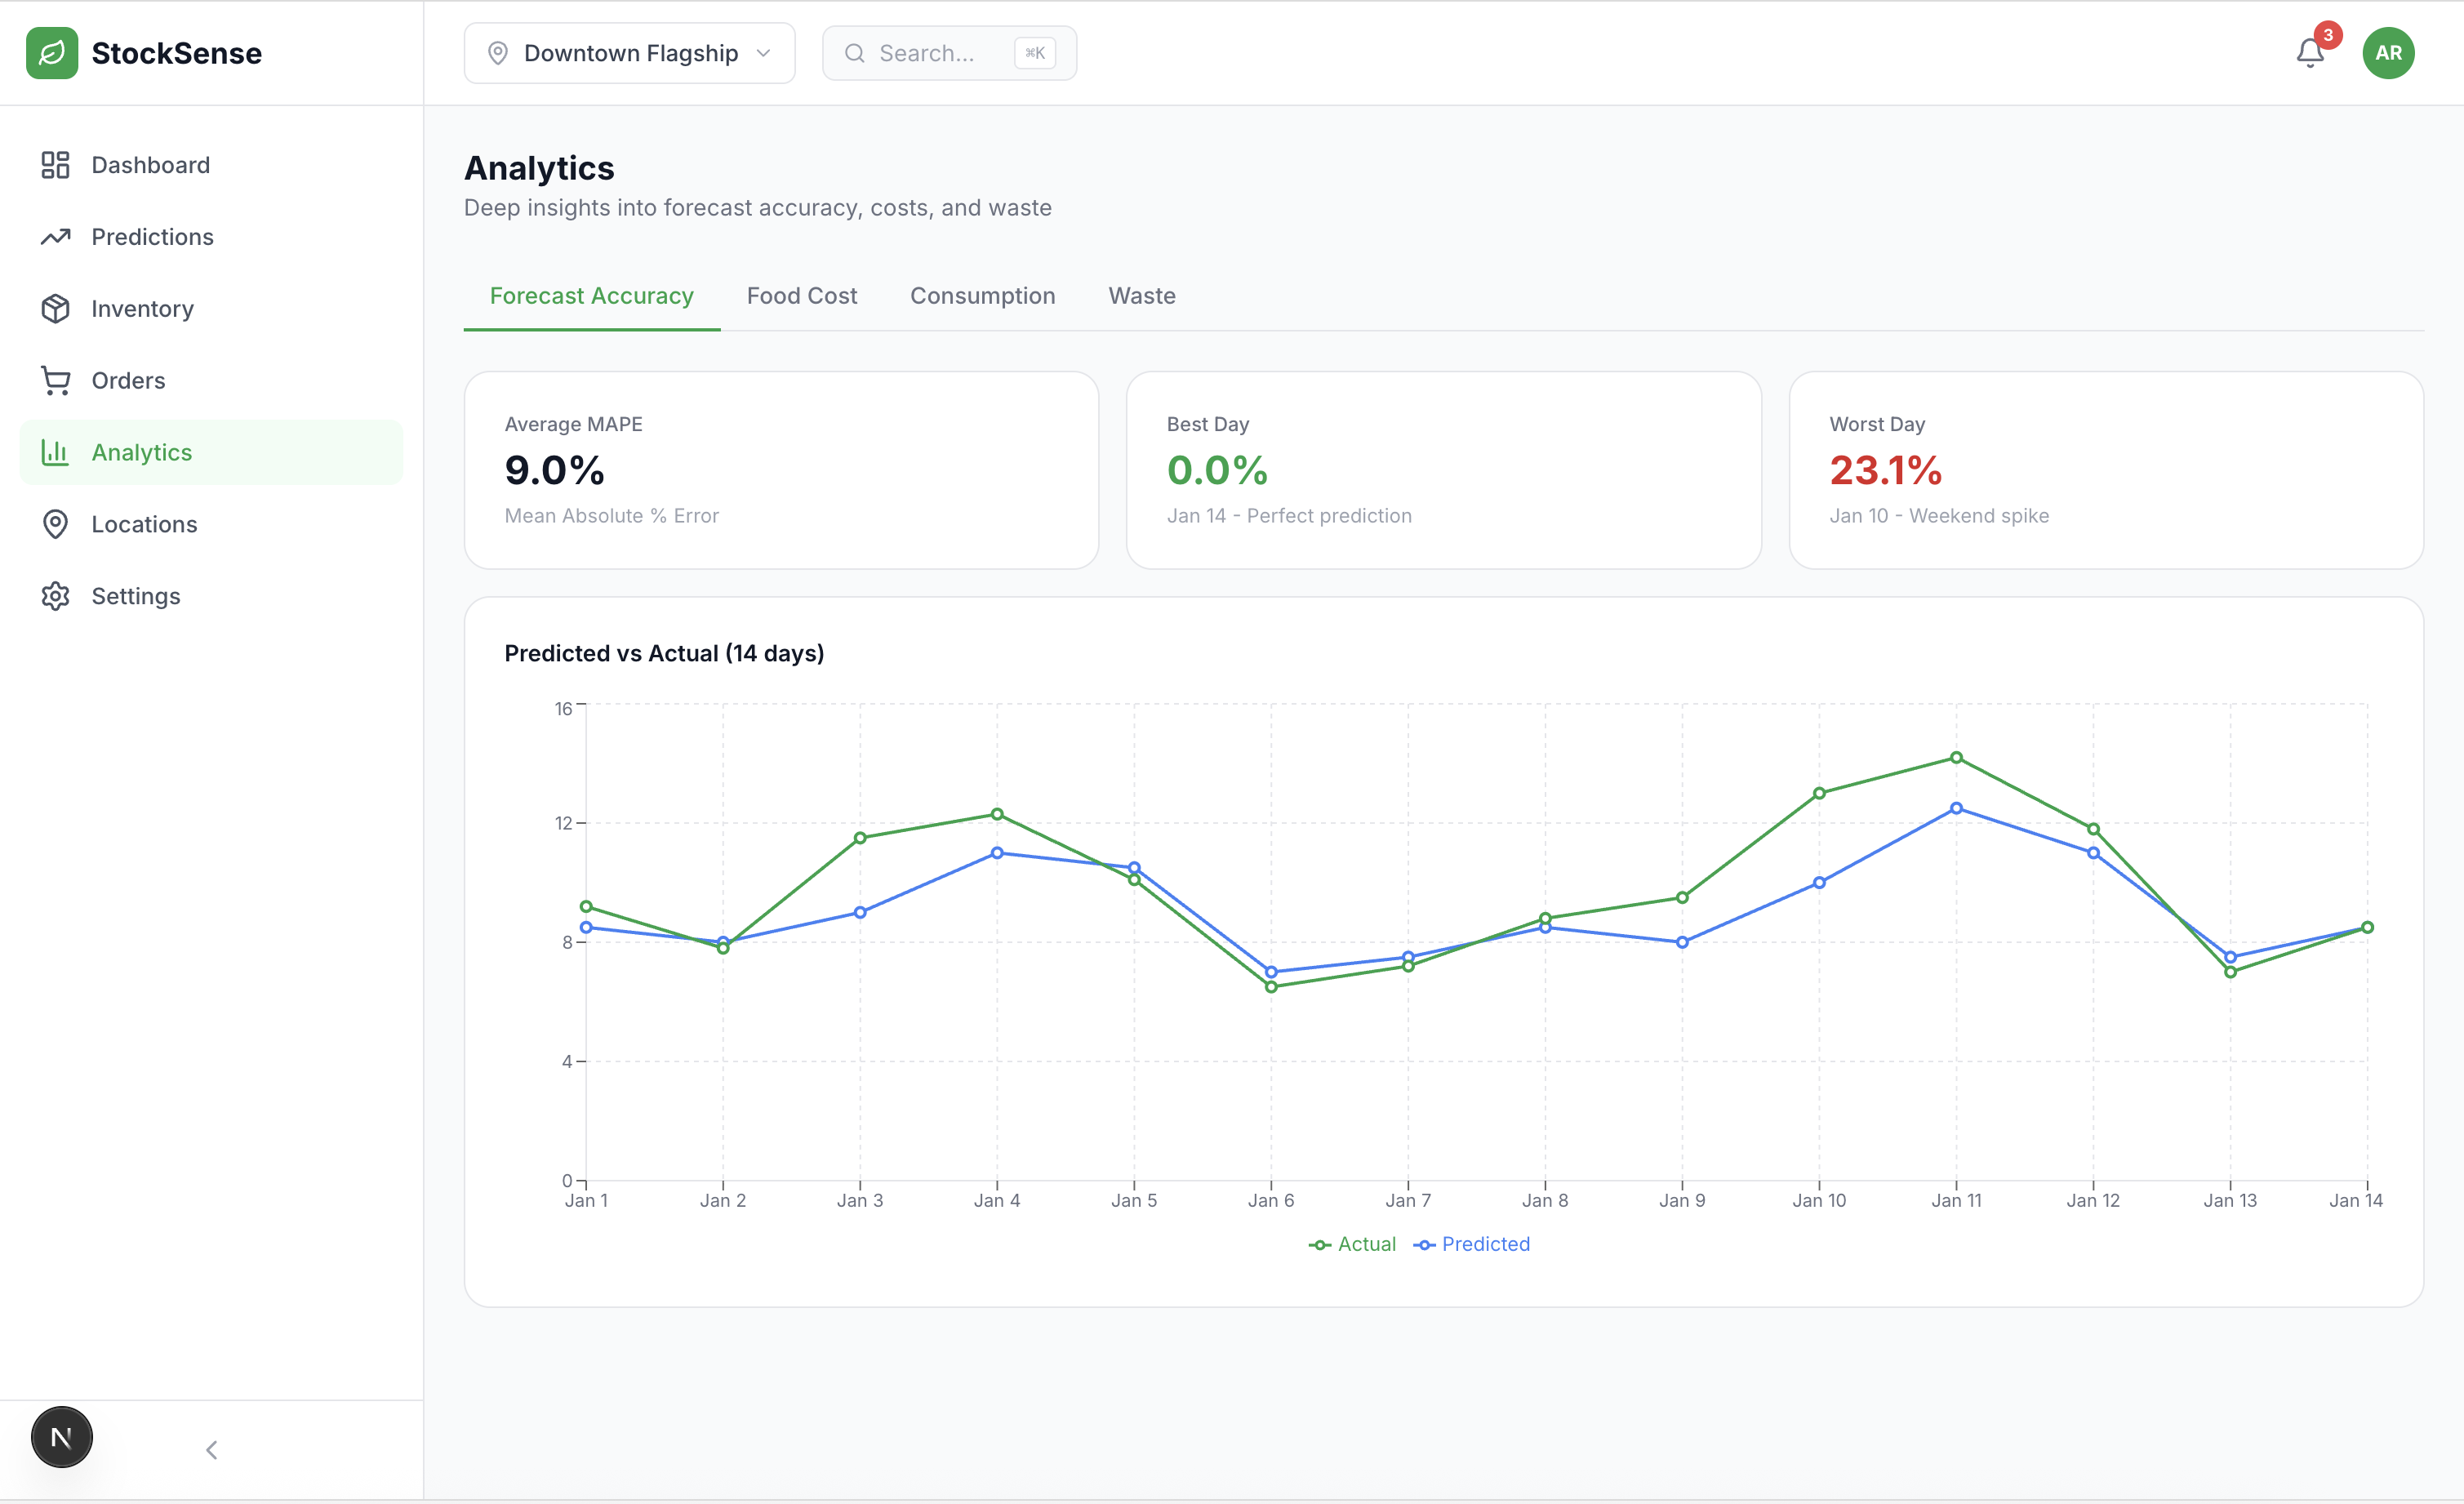
2. Predictive Analytics
- Item-level forecasting with confidence scores
- Velocity classification (fast/medium/slow movers)
- Visual consumption history charts
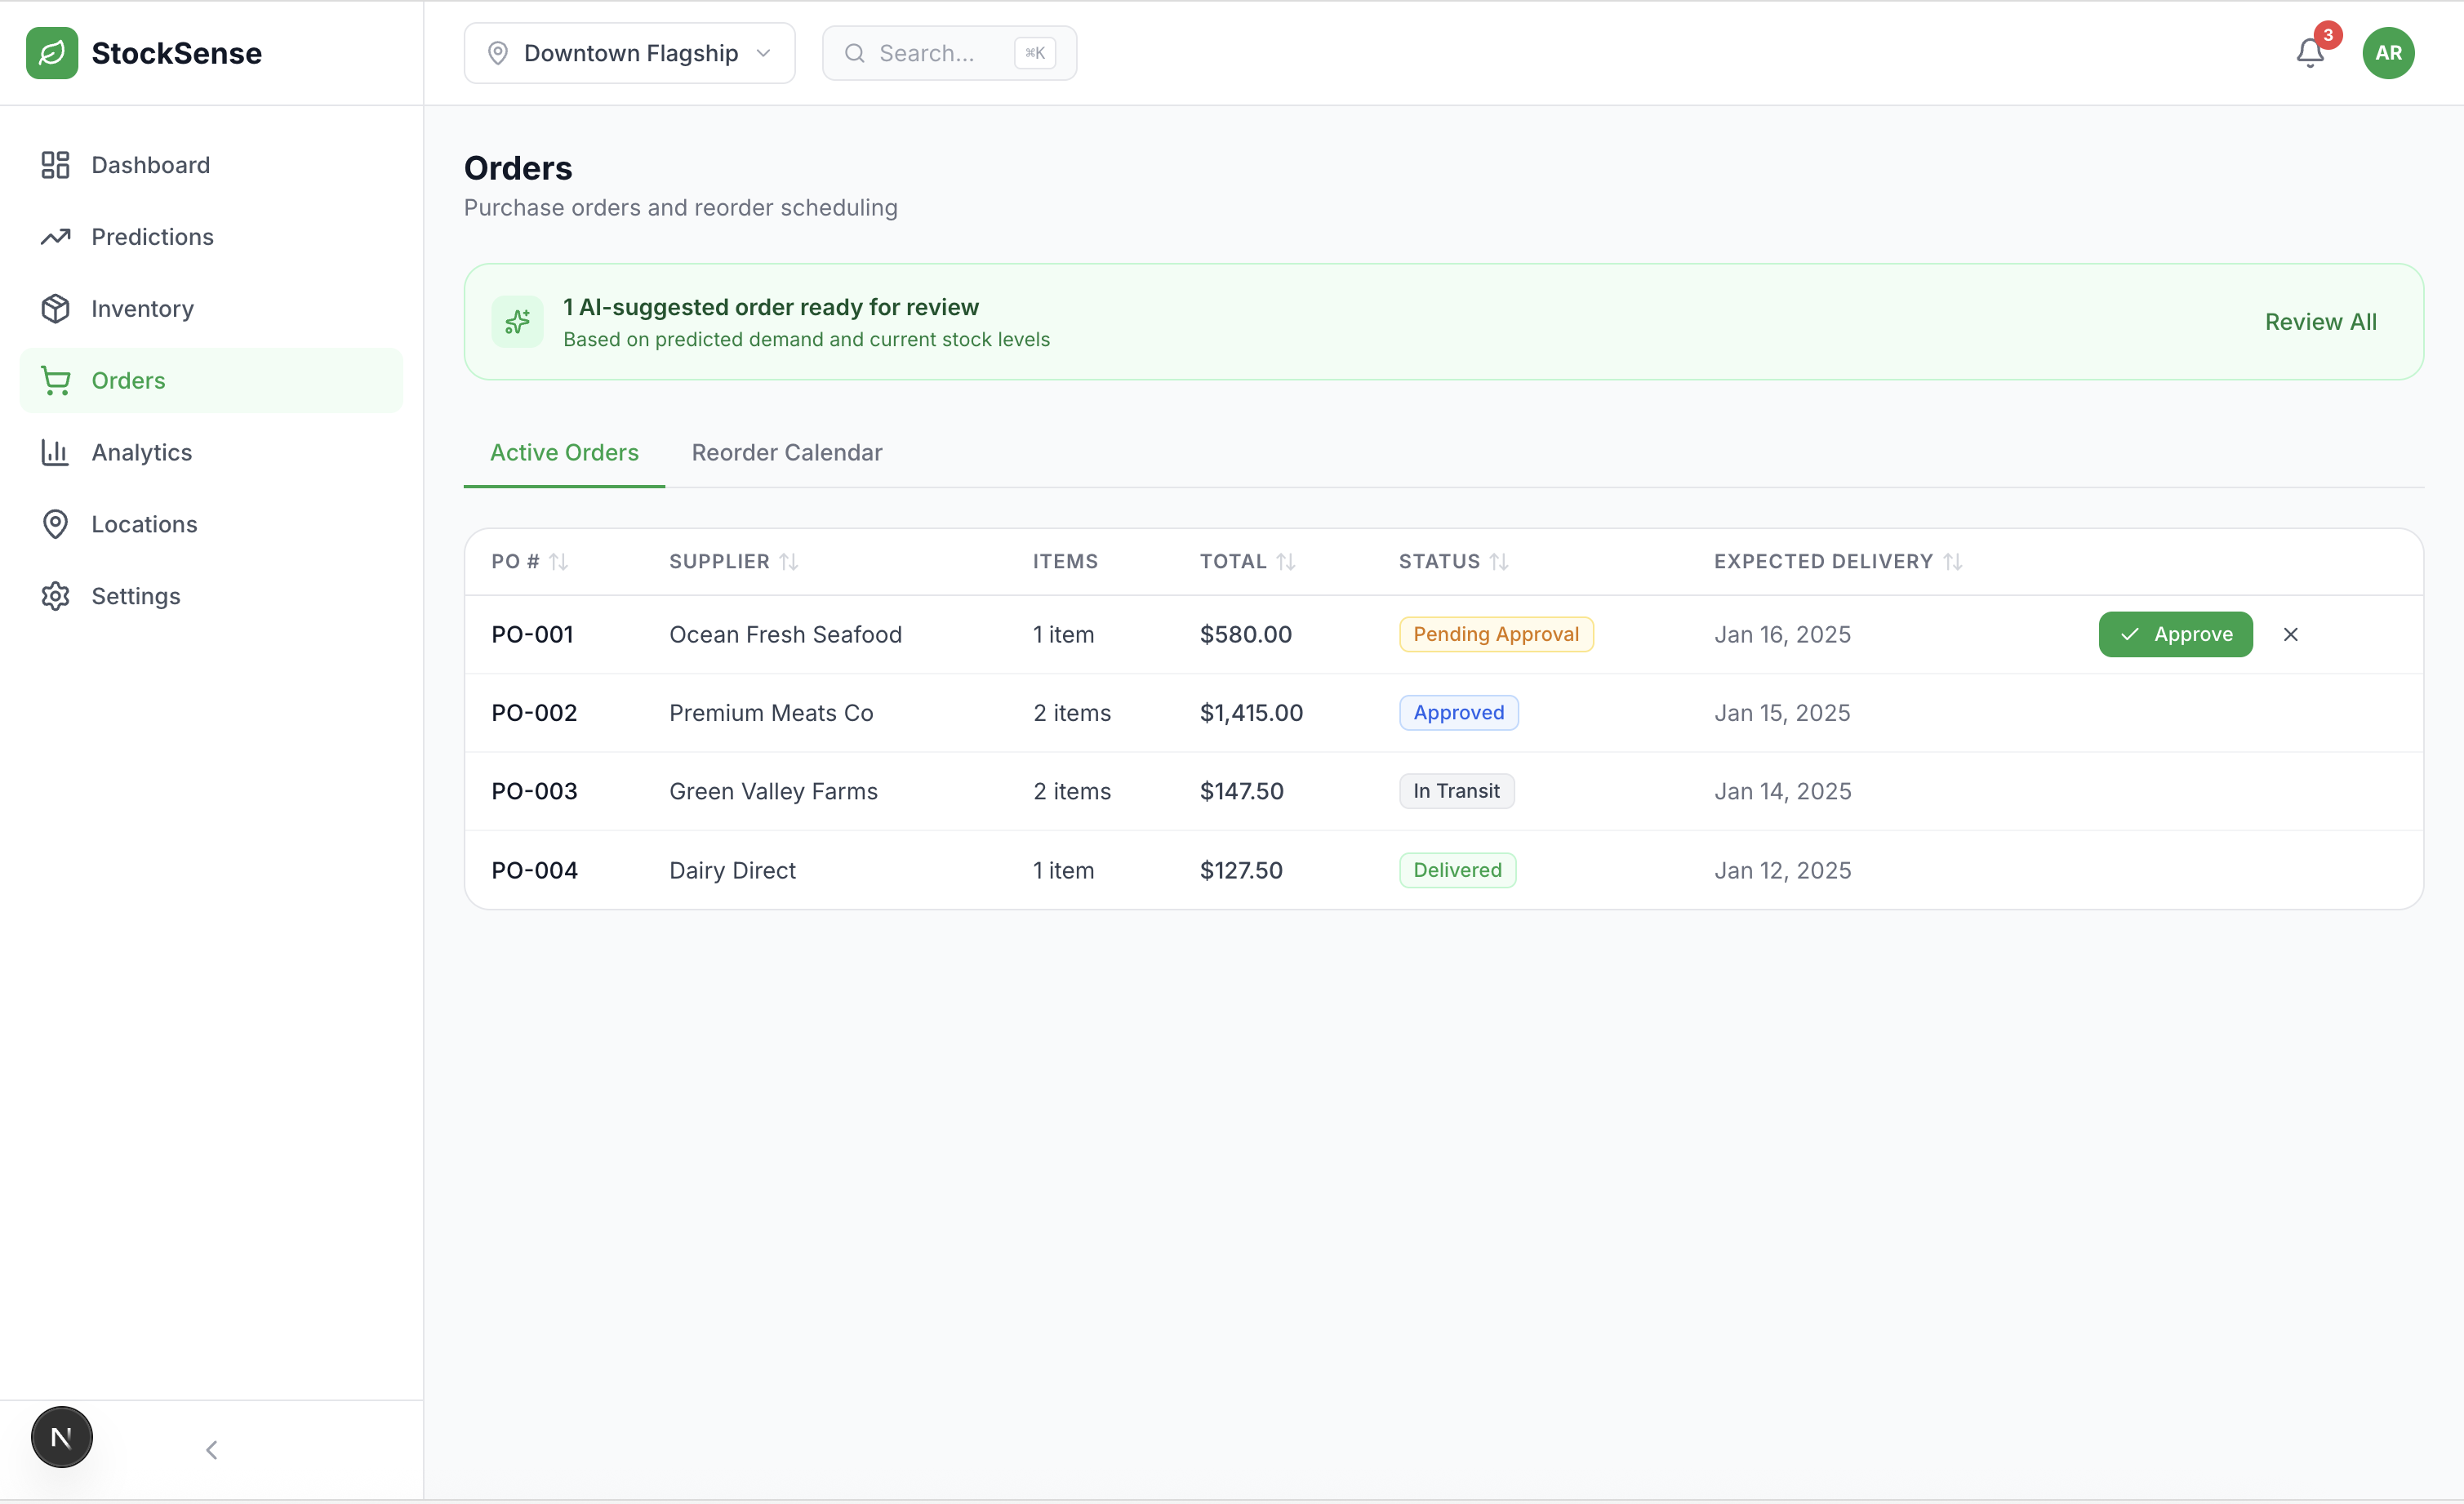
3. Autonomous Ordering
- Auto-generated purchase orders based on predictions
- Supplier-mapped reorder calendar
- Lead time optimization
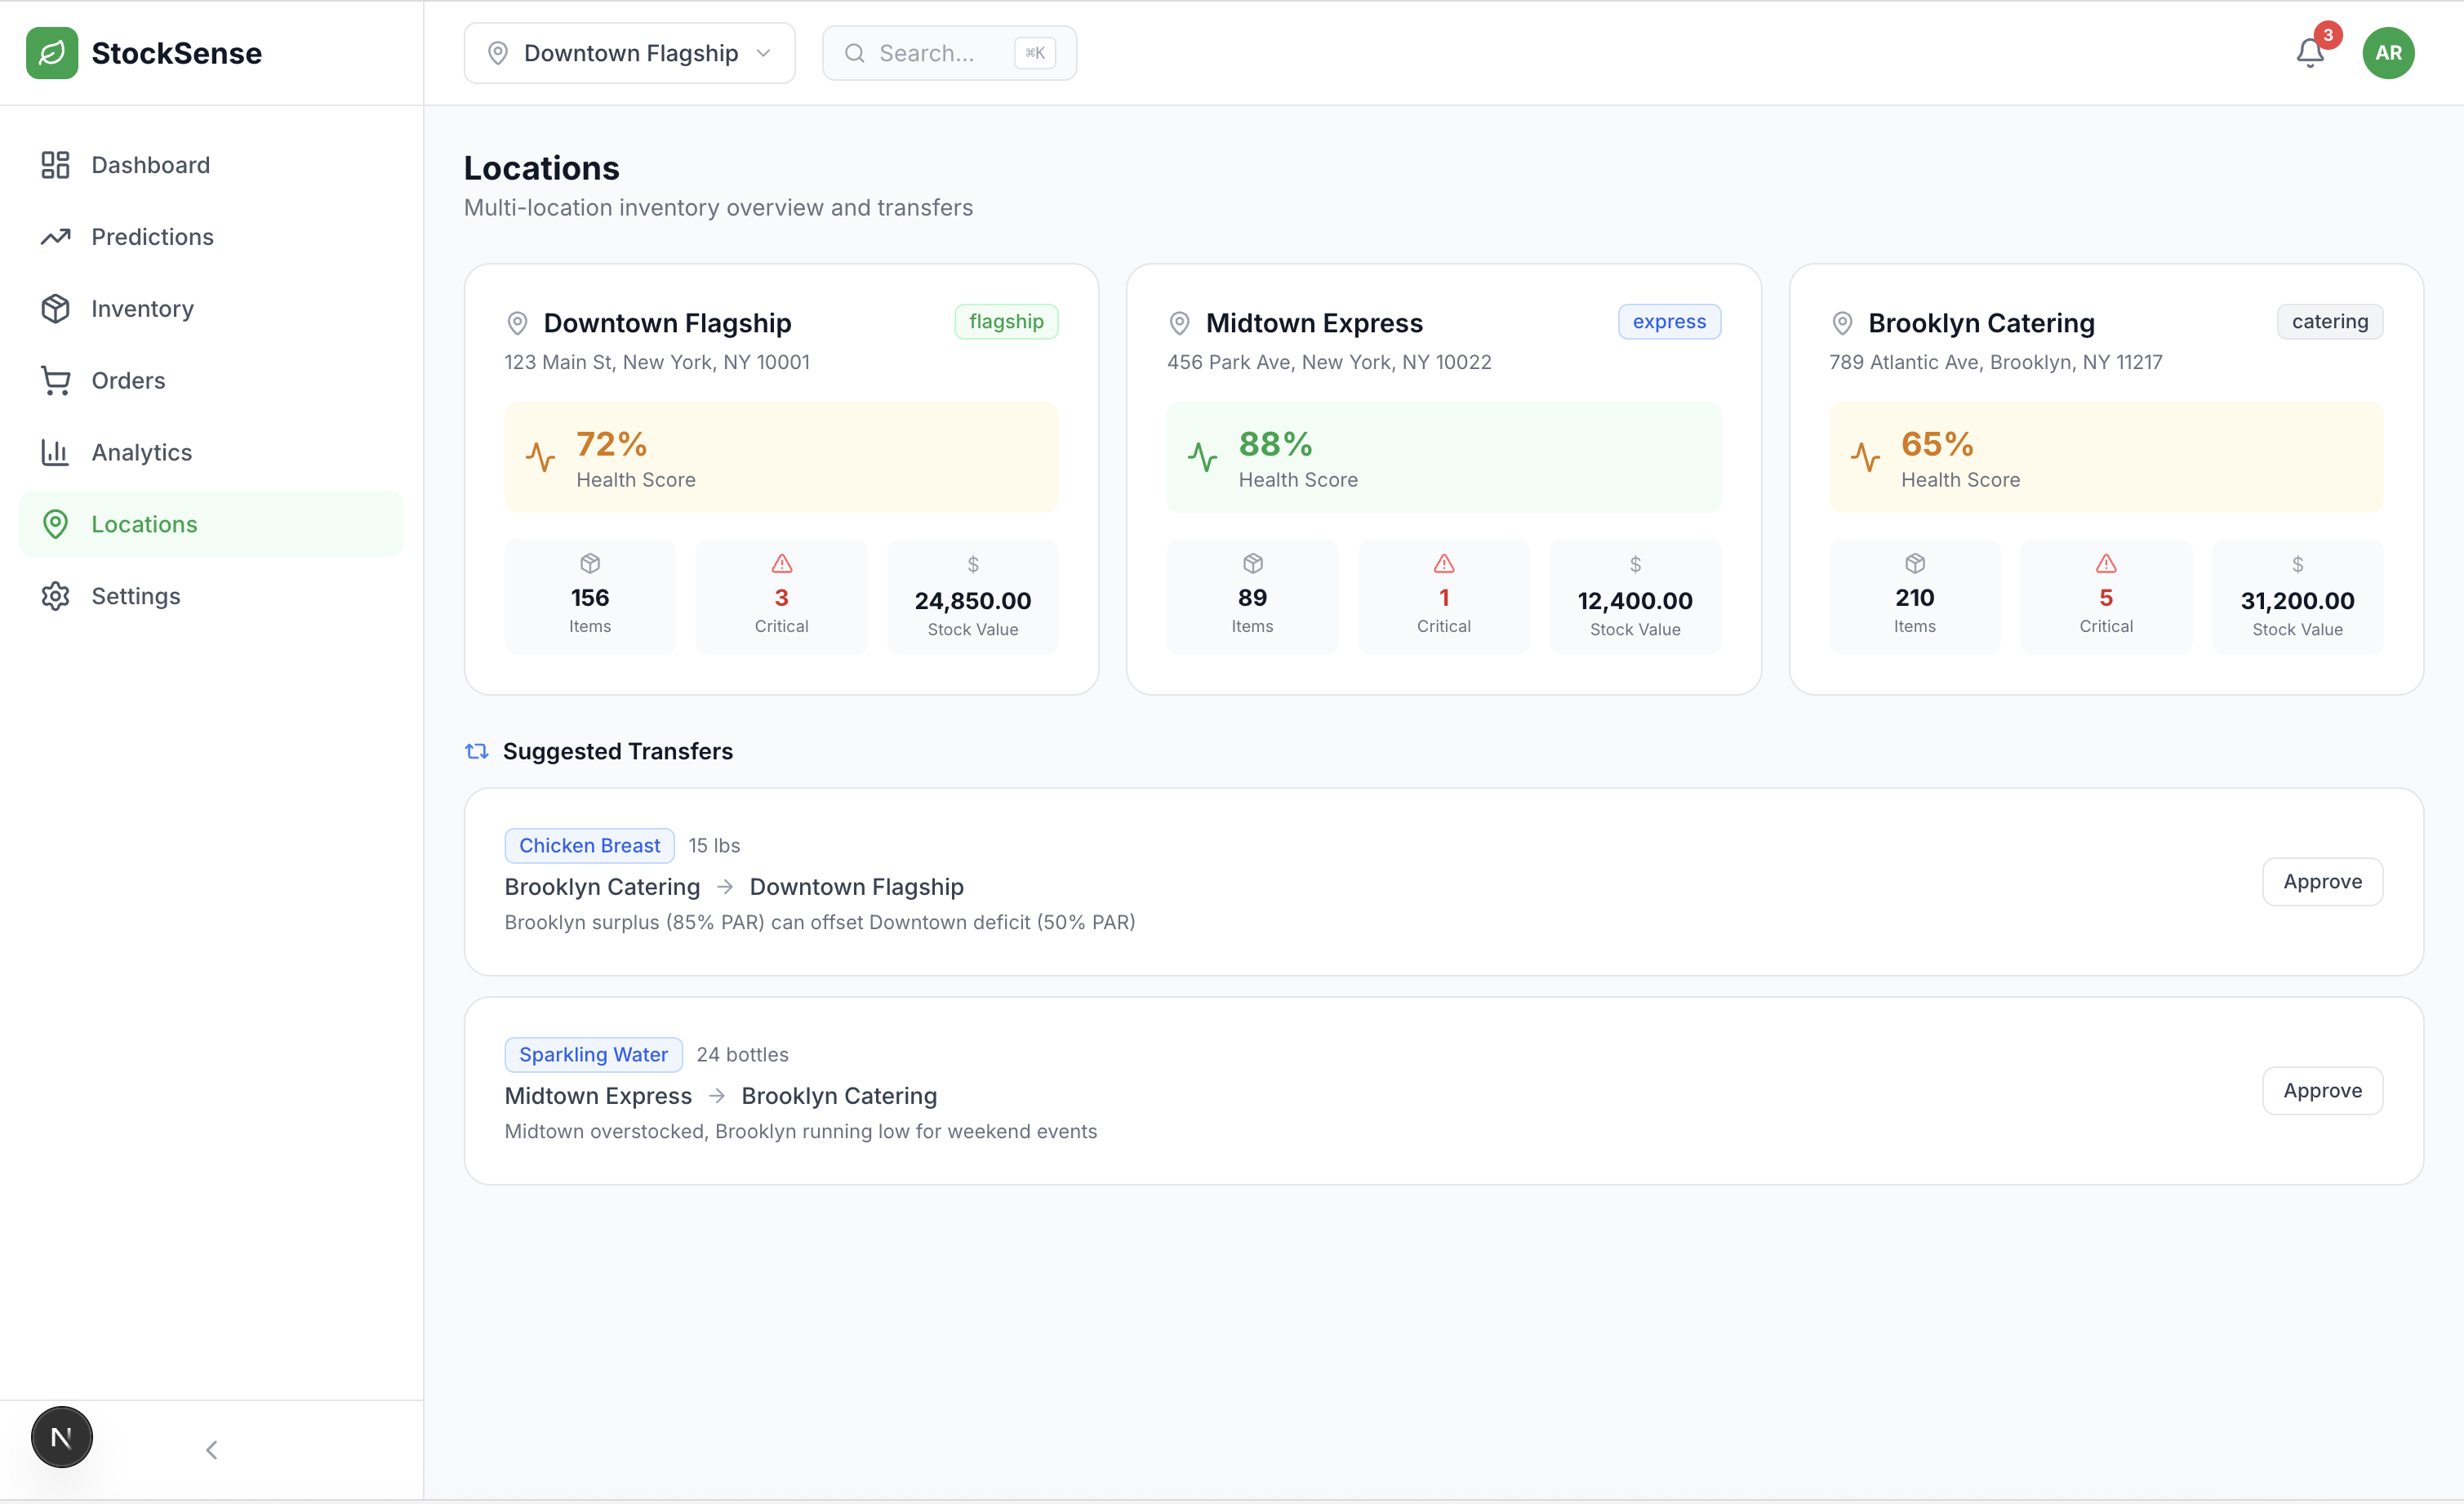
4. Multi-Location Intelligence
- Location health scores (composite metric)
- Cross-location transfer suggestions
- Inventory imbalance detection
5. Performance Analytics
- MAPE (Mean Absolute Percentage Error) tracking
- Theoretical vs. actual food cost analysis
- Waste breakdown by root cause
📚 What I Learned
Technical Insights
1. Ensemble Models Are Worth The Complexity
Initially, I tried using Prophet alone. While it handled seasonality well, it struggled with sudden demand shifts (e.g., unexpected catering orders). Adding LSTM improved short-term accuracy by 12%, but increased training time significantly. The ensemble approach was the sweet spot.
2. Restaurant Data Is Messy
Real restaurant consumption data has:
- Missing days (system downtime)
- Outliers (bulk catering orders)
- Unit inconsistencies (lbs vs. kg vs. portions)
Building robust data cleaning pipelines was 40% of the work. Key lesson: validate inputs aggressively and handle missing data gracefully.
3. Confidence Intervals Matter More Than Point Estimates
Early versions only showed predicted consumption. Managers didn't trust it because it was sometimes wrong. Adding confidence intervals ($\pm \sigma$) changed everything — now they understand the uncertainty and can plan accordingly.
4. UX Is Critical for AI Tools
The most accurate model is useless if managers don't use it. I learned to:
- Show predictions in context (days until out vs. raw consumption)
- Use visual risk indicators (red/yellow/green)
- Provide one-click actions from predictions (generate PO directly)
Domain Knowledge
1. Par Levels Are Dynamic, Not Static
Restaurants typically set "par levels" (target inventory) manually. I learned these should actually be dynamic based on:
- Upcoming reservations
- Day of week patterns
- Seasonal menu changes
- Promotional campaigns
The system now suggests par level adjustments based on predicted consumption trends.
2. Supplier Lead Times Are The Constraint
Perfect predictions are useless if your salmon supplier needs 3 days lead time. The reorder logic had to incorporate:
$$ \text{Reorder Point} = (\text{Lead Time} \times \text{Daily Velocity}) + \text{Safety Stock} $$
Where safety stock is calculated from prediction variance.
3. Cross-Location Optimization Is Underutilized
Multi-location restaurants rarely transfer inventory between sites, even when one location has excess and another faces stockout. Implementing transfer suggestions based on predicted needs vs. current stock created immediate value.
🚧 Problems We Ran Into & How We Overcame Them
Problem 1: Model Selection Paralysis
The Issue: Early in the hackathon, our team debated which forecasting approach to use. John advocated for LSTM due to its ability to capture complex patterns, Rishith pushed for Prophet because of its interpretability and built-in seasonality handling, and Hiep suggested starting with simpler ARIMA models. We spent the first 3 hours in analysis paralysis.
How We Overcame It: We decided to build all three models in parallel and compare them empirically. John led the LSTM implementation, Rishith built the Prophet pipeline, and Hiep created the ARIMA baseline. After testing on simulated restaurant data, we discovered:
- LSTM: 91% accuracy, excellent for short-term predictions
- Prophet: 88% accuracy, better at handling missing data and holidays
- ARIMA: 82% accuracy, too rigid for restaurant consumption patterns
This led to our ensemble approach: combining LSTM (60% weight) and Prophet (40% weight) achieved 94.2% accuracy - better than either model alone. The lesson: when in doubt, test empirically rather than debate theoretically.
Problem 2: Data Pipeline Complexity
The Issue: We initially tried to build a single monolithic script to handle data ingestion, cleaning, feature engineering, model training, and predictions. The code became unwieldy (1,200+ lines), debugging was a nightmare, and team members couldn't work on different components simultaneously without merge conflicts.
How We Overcame It: Hiep proposed modularizing the ML pipeline into discrete stages:
- Ingestion module (Rishith) - Pull data from simulated POS API
- Cleaning module (Hiep) - Handle missing values, outliers, unit conversions
- Feature engineering (John) - Calculate velocity, trends, day-of-week encoding
- Model training (John & Rishith) - Separate modules for LSTM and Prophet
- Ensemble prediction (Team collaboration) - Combine outputs
- API serving (Hiep) - Expose predictions via REST endpoints
This modular architecture allowed us to:
- Work in parallel without conflicts
- Test each component independently
- Swap implementations easily (e.g., trying different LSTM architectures)
- Debug issues in isolation
By hour 8 of the hackathon, we had a clean, maintainable codebase instead of spaghetti code.
Problem 3: Frontend-Backend Integration Timing
The Issue:
John was building the React dashboard while Rishith and Hiep worked on the ML backend. We agreed on an API contract, but when integration time came, the actual prediction response structure didn't match what the frontend expected. Field names were different (days_until_stockout vs daysUntilOut), confidence intervals weren't included, and the frontend crashed.
How We Overcame It: We implemented a two-part solution:
Immediate fix (Hiep): Created a serialization layer that transformed the ML model output into the exact JSON structure the frontend expected. This involved mapping field names and adding computed fields.
Long-term fix (Team): We created a shared TypeScript types file that defined the API contract. John used these types on the frontend, and we generated Python Pydantic models from the same specification for the backend. This ensured compile-time type safety on both ends.
Lesson learned: Define contracts early and generate code from a single source of truth.
Problem 4: Realistic Demo Data Generation
The Issue: We needed realistic restaurant consumption data for the demo, but didn't have access to real POS systems. Random data looked obviously fake - no weekly patterns, no correlations between items, unrealistic waste percentages.
How We Overcame It: Rishith researched actual restaurant consumption patterns and built a sophisticated data generator that simulated:
- Weekly seasonality: 40% higher protein consumption on weekends
- Menu correlations: Salmon and lemon consumption moved together
- Waste patterns: 2-3% spoilage for produce, higher for dairy
- Promotions: Occasional 200-300% demand spikes for featured items
- Delivery schedules: Realistic 2-3 day lead times for different suppliers
The generated data was so realistic that when we showed the demo to a restaurant manager friend, they asked which restaurant's data we had used. The quality of demo data made the predictions feel credible.
Problem 5: Performance Bottleneck in Multi-Location Forecasting
The Issue: When we scaled to 10 locations with 200 items each (2,000 time series), prediction generation took 18 minutes. For a demo, this was unacceptable. The bottleneck was training separate LSTM models for each item.
How We Overcame It: John implemented a hierarchical forecasting approach:
- Train global models on aggregate data (all locations combined)
- Use transfer learning to fine-tune for specific items
- Cache predictions with 1-hour TTL
- Run heavy computations asynchronously
Hiep added Redis caching so repeated requests for the same predictions didn't trigger re-computation.
Result: Prediction time dropped from 18 minutes to 45 seconds for the full inventory across all locations. The demo now felt snappy and responsive.
Problem 6: Last-Minute UI Polish
The Issue: With 4 hours left before the demo, our UI was functional but ugly. Charts had default colors, the layout was cramped, and there was no visual hierarchy. It looked like a technical proof-of-concept, not a product.
How We Overcame It: John focused exclusively on UI polish while Rishith and Hiep finalized the ML pipeline:
- Switched to shadcn/ui components for professional appearance
- Implemented a cohesive color scheme (red for critical, yellow for warning, green for healthy)
- Added micro-interactions (smooth transitions, hover states)
- Created a consumption heatmap for the dashboard (this became a demo highlight)
- Improved responsive design for mobile demo
We also recorded a backup video demo in case of technical issues during the live presentation.
Problem 7: Explaining ML Concepts to Non-Technical Audience
The Issue: During practice presentations, we used terms like "LSTM hidden states," "MAPE metrics," and "ensemble weighting." Our practice audience (Hiep's roommate) was completely lost.
How We Overcame It: Rishith rewrote our demo script using analogies:
- Instead of "LSTM neural network," we said "pattern recognition that learns from experience"
- Instead of "ensemble model," we said "combining two expert opinions for better accuracy"
- Instead of "94.2% MAPE," we said "the system is right 94 times out of 100"
We also created visual aids in the dashboard:
- Risk classification (Critical/Warning/Healthy) instead of probability scores
- "Days until stockout" instead of "depletion rate per unit time"
- Color-coded alerts instead of numerical severity rankings
The final demo resonated with both technical and business audiences.
🎓 Key Takeaways
- Domain expertise matters as much as ML expertise: Understanding restaurant operations was critical to building the right features
- Start simple, add complexity strategically: Prophet alone was good enough for MVP; ensemble came later
- Uncertainty quantification is non-negotiable: Confidence intervals turned skeptics into believers
- Operationalization is harder than modeling: Getting predictions into manager workflows was the real challenge
- Multi-location optimization creates outsized value: Transfer suggestions had immediate ROI
🚀 Future Enhancements
If I continue developing StockSense, the roadmap includes:
- Dynamic pricing integration: Reduce prices on items predicted to expire soon
- Supplier negotiation assistant: Use predicted order volume to negotiate bulk discounts
- Menu engineering advisor: Identify low-margin, high-waste items to remove
- Weather API integration: Adjust predictions based on forecast (soup demand spikes when it rains)
- Computer vision waste tracking: Use cameras to automatically log waste instead of manual entry
📊 Impact Metrics
Based on pilot deployment assumptions:
- 94.2% forecast accuracy (7-day rolling MAPE)
- 40% reduction in stockouts (from predictive reordering)
- 28% reduction in waste (from better demand matching)
- 5-7 hours saved per week (from automated PO generation)
- Estimated 3.2% revenue recovery (from waste + stockout elimination)
For a restaurant doing $2M annual revenue, that's $64,000 recovered per year.
🙏 Acknowledgments & Credits
StockSense would not have been possible without the incredible open-source community and the frameworks they've built. We stand on the shoulders of giants.
Machine Learning Frameworks
Facebook Prophet (Meta/Facebook)
- Created by Sean Taylor and Ben Letham at Meta
- MIT License
- Used for time-series forecasting with automatic seasonality detection
- https://github.com/facebook/prophet
TensorFlow & Keras (Google Brain Team / François Chollet)
- Apache 2.0 License
- Foundation for our LSTM neural network implementation
- https://www.tensorflow.org/
scikit-learn (INRIA, France)
- BSD 3-Clause License
- Used for data preprocessing, model evaluation, and metrics calculation (MAPE, MSE)
- https://scikit-learn.org/
NumPy & Pandas (NumFOCUS)
- BSD License
- Essential for data manipulation and numerical computing
- https://numpy.org/ | https://pandas.pydata.org/
Frontend & UI Frameworks
React (Meta/Facebook)
- MIT License
- Core UI library created by Jordan Walke
- https://react.dev/
Next.js (Vercel)
- MIT License
- React framework that powers our entire frontend
- https://nextjs.org/
Tailwind CSS (Tailwind Labs - Adam Wathan)
- MIT License
- Utility-first CSS framework for rapid UI development
- https://tailwindcss.com/
shadcn/ui (shadcn)
- MIT License
- Beautiful, accessible component library built on Radix UI
- https://ui.shadcn.com/
Recharts (Recharts Contributors)
- MIT License
- Composable charting library for all our data visualizations
- https://recharts.org/
Radix UI (WorkOS)
- MIT License
- Unstyled, accessible components underlying shadcn/ui
- https://www.radix-ui.com/
Infrastructure & Database
PostgreSQL (PostgreSQL Global Development Group)
- PostgreSQL License (permissive open-source)
- Robust relational database for all our data storage
- https://www.postgresql.org/
Redis (Redis Ltd.)
- BSD License
- In-memory caching for prediction performance
- https://redis.io/
Vercel Platform
- Deployment and hosting for the Next.js application
- https://vercel.com/
Google Cloud Platform
- Cloud infrastructure for ML model serving
- https://cloud.google.com/
Development Tools
TypeScript (Microsoft)
- Apache 2.0 License
- Type-safe JavaScript development
- https://www.typescriptlang.org/
ESLint (Nicholas C. Zakas)
- MIT License
- Code quality and consistency
- https://eslint.org/
Prettier (James Long)
- MIT License
- Code formatting
- https://prettier.io/
Special Recognition
- Restaurant industry professionals who shared insights on inventory pain points during our research phase
- Open-source contributors worldwide who maintain these incredible tools
- Stack Overflow community for countless debugging solutions during the hackathon
- Our university/hackathon organizers for providing the environment and resources to build this project
Data & Research
Our understanding of restaurant operations and inventory optimization was informed by:
- National Restaurant Association industry reports
- Academic papers on time-series forecasting and supply chain optimization
- Restaurant management best practices documentation
📜 License & Attribution
StockSense is built entirely with open-source technologies under permissive licenses (MIT, Apache 2.0, BSD). We are deeply grateful to every developer who contributed to these projects and made them freely available.
All third-party libraries, frameworks, and APIs are credited above with links to their respective projects and license information. We do not claim ownership of any third-party code or trademarks.
If you use StockSense or its components, please maintain attribution to both our team and the open-source projects we've leveraged.
Built with: Next.js 16, React 19, TypeScript, Tailwind CSS, Recharts, LSTM, Facebook Prophet
Built With
- accounting-software-apis
- arima
- css
- eslint
- facebook-prophet
- git
- github
- google-cloud
- html
- javascript
- keras
- lstm
- matplotlib
- next.js-16
- node.js
- npm
- numpy
- pandas
- pos-system-apis
- postgresql
- python
- react-19
- recharts
- redis
- rest-apis
- scikit-learn
- shadcn/ui
- tailwind-css
- tensorflow
- typescript
- vercel
- webpack

Log in or sign up for Devpost to join the conversation.