-
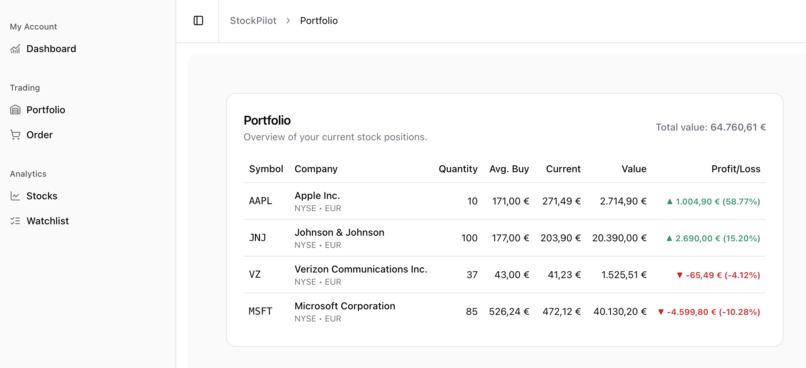
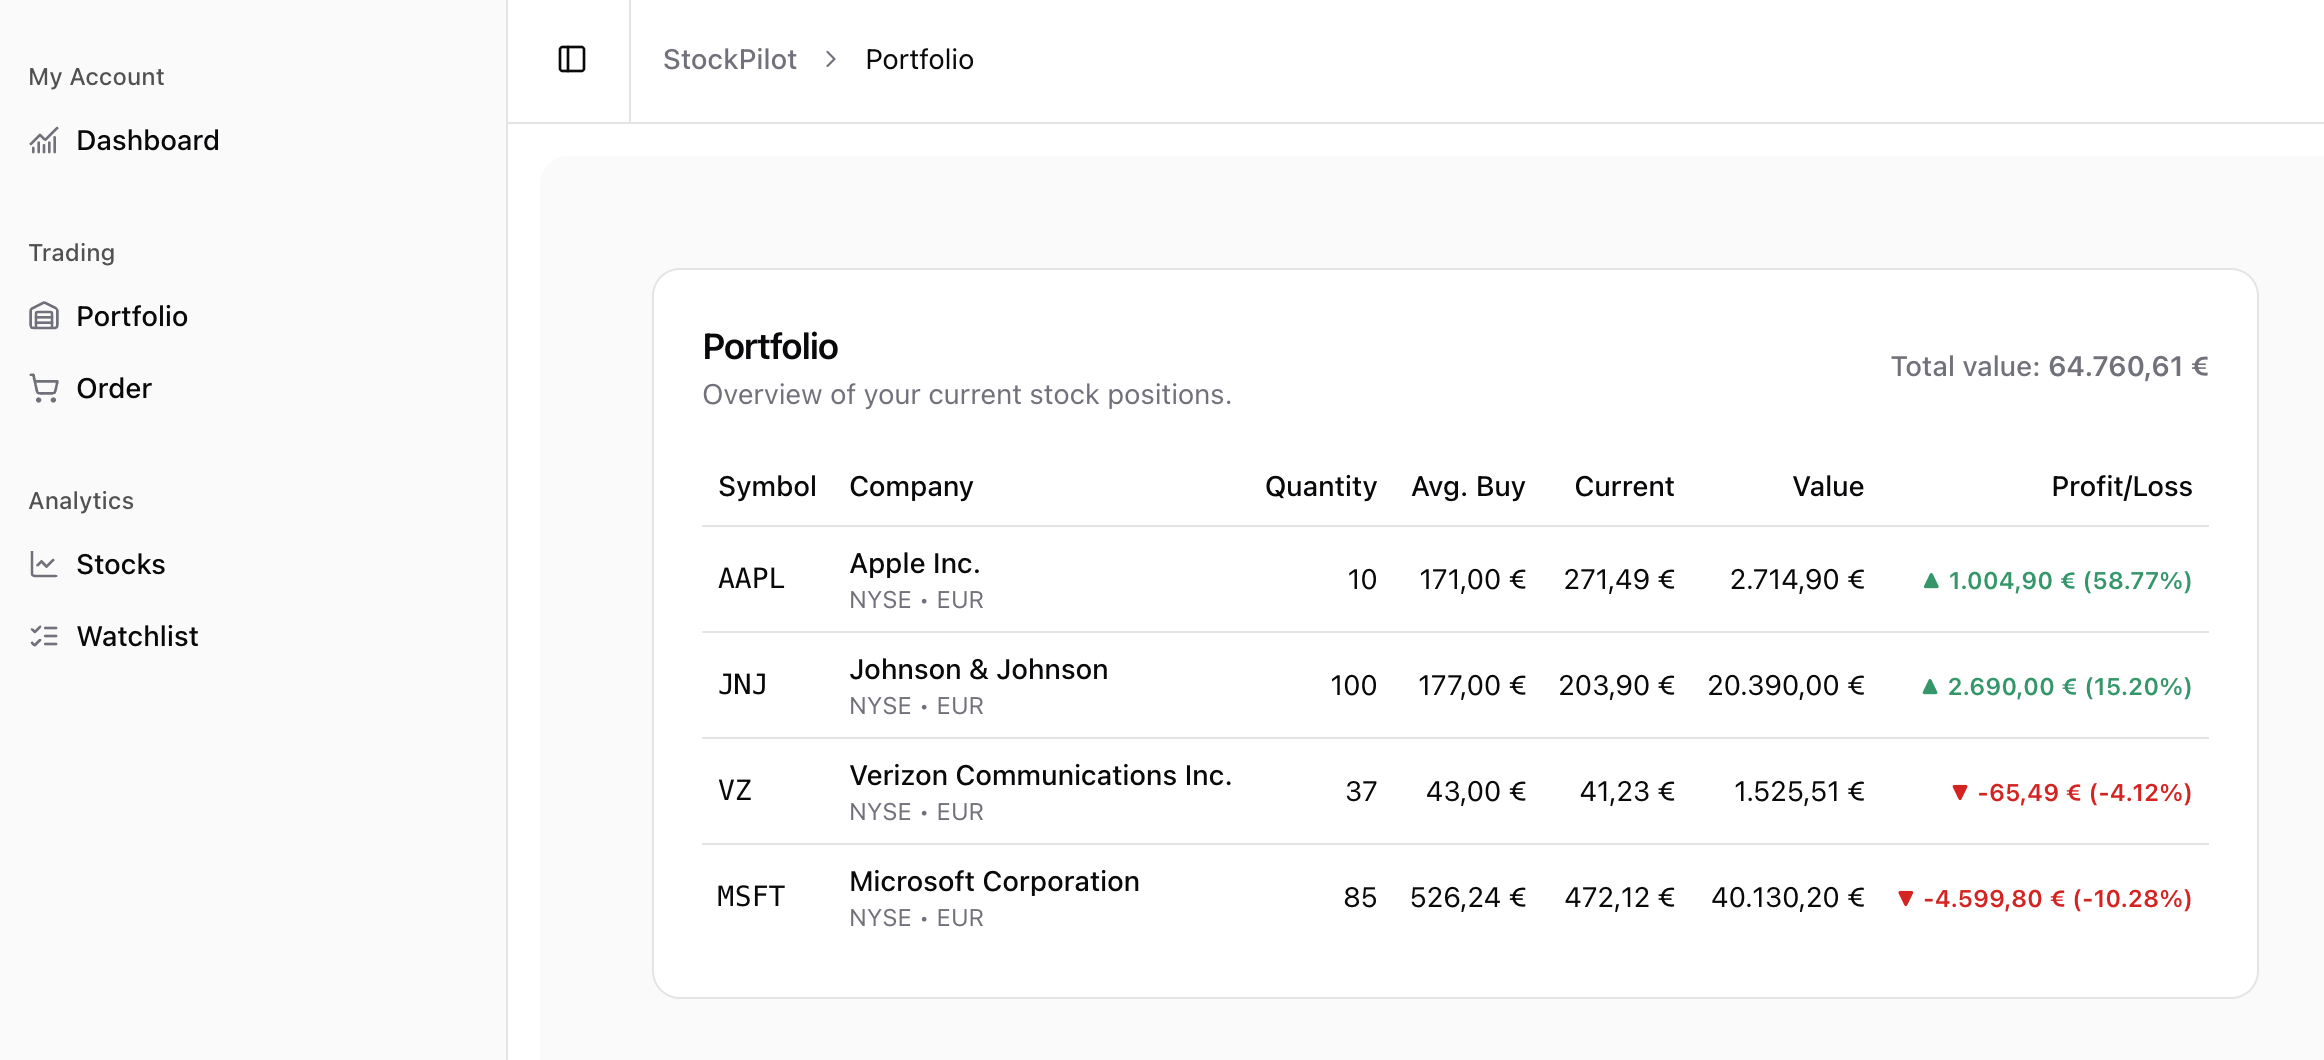
Overview about your current stock portfolio.
-

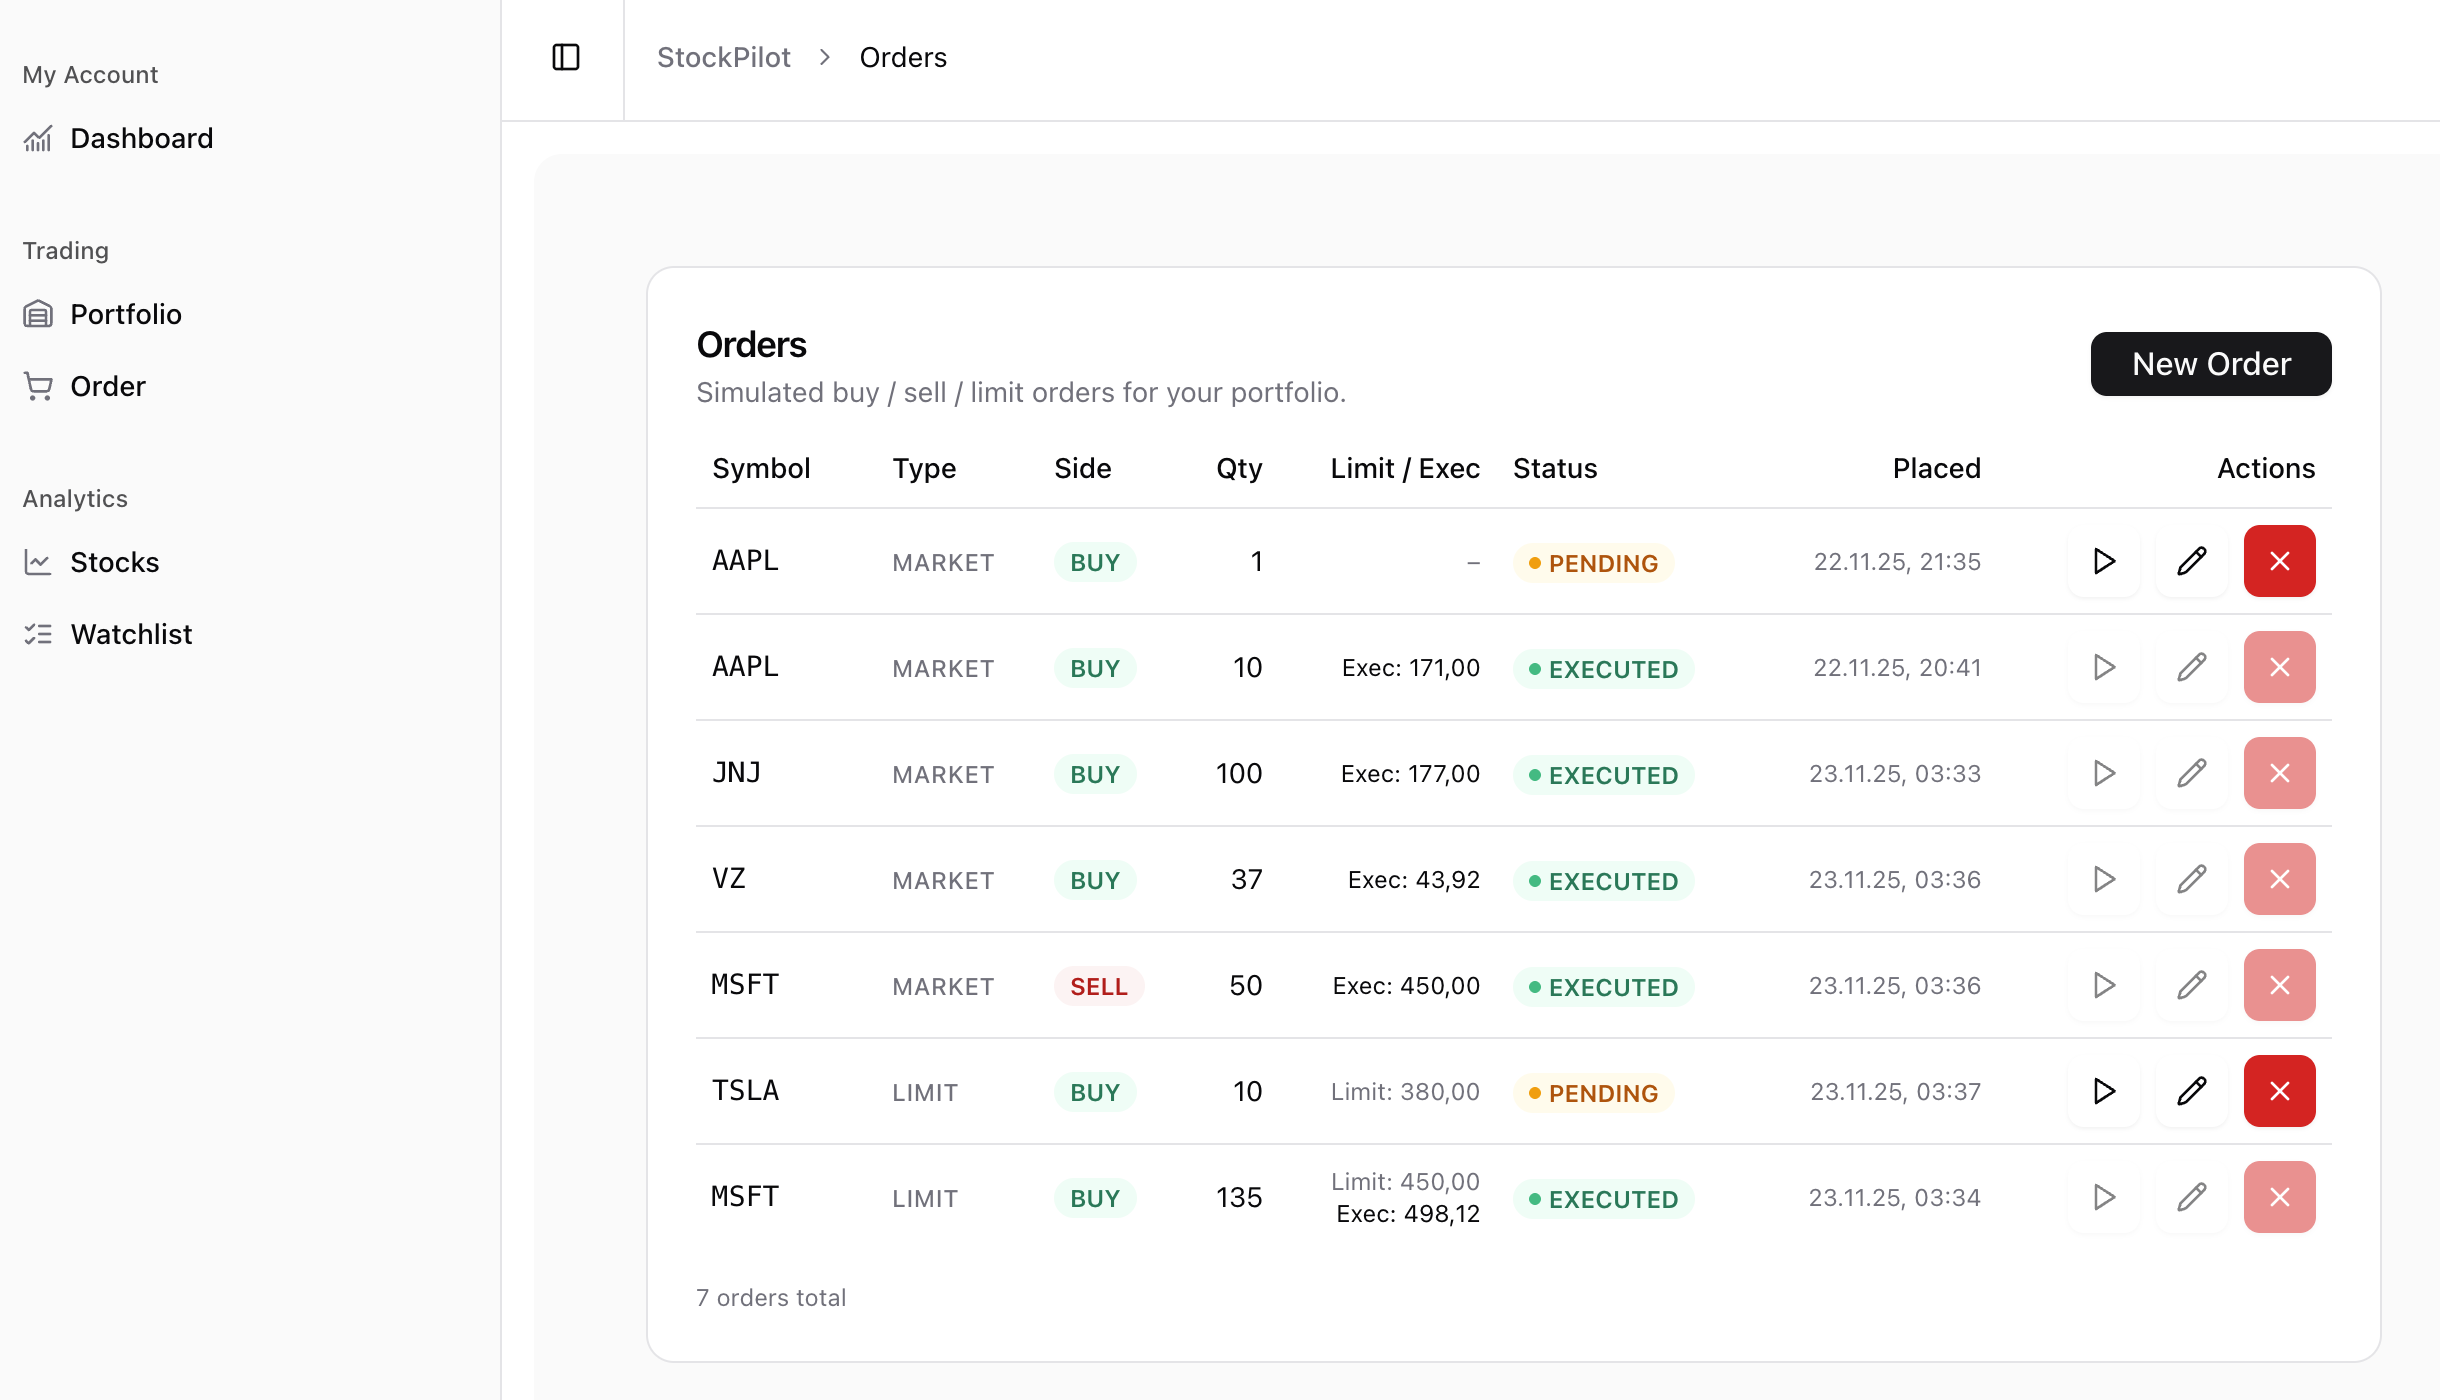
Interface to manage and organize all types of orders in the stock market
-
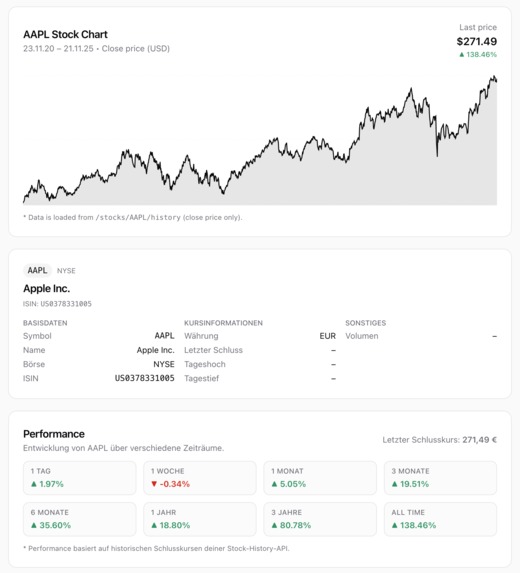
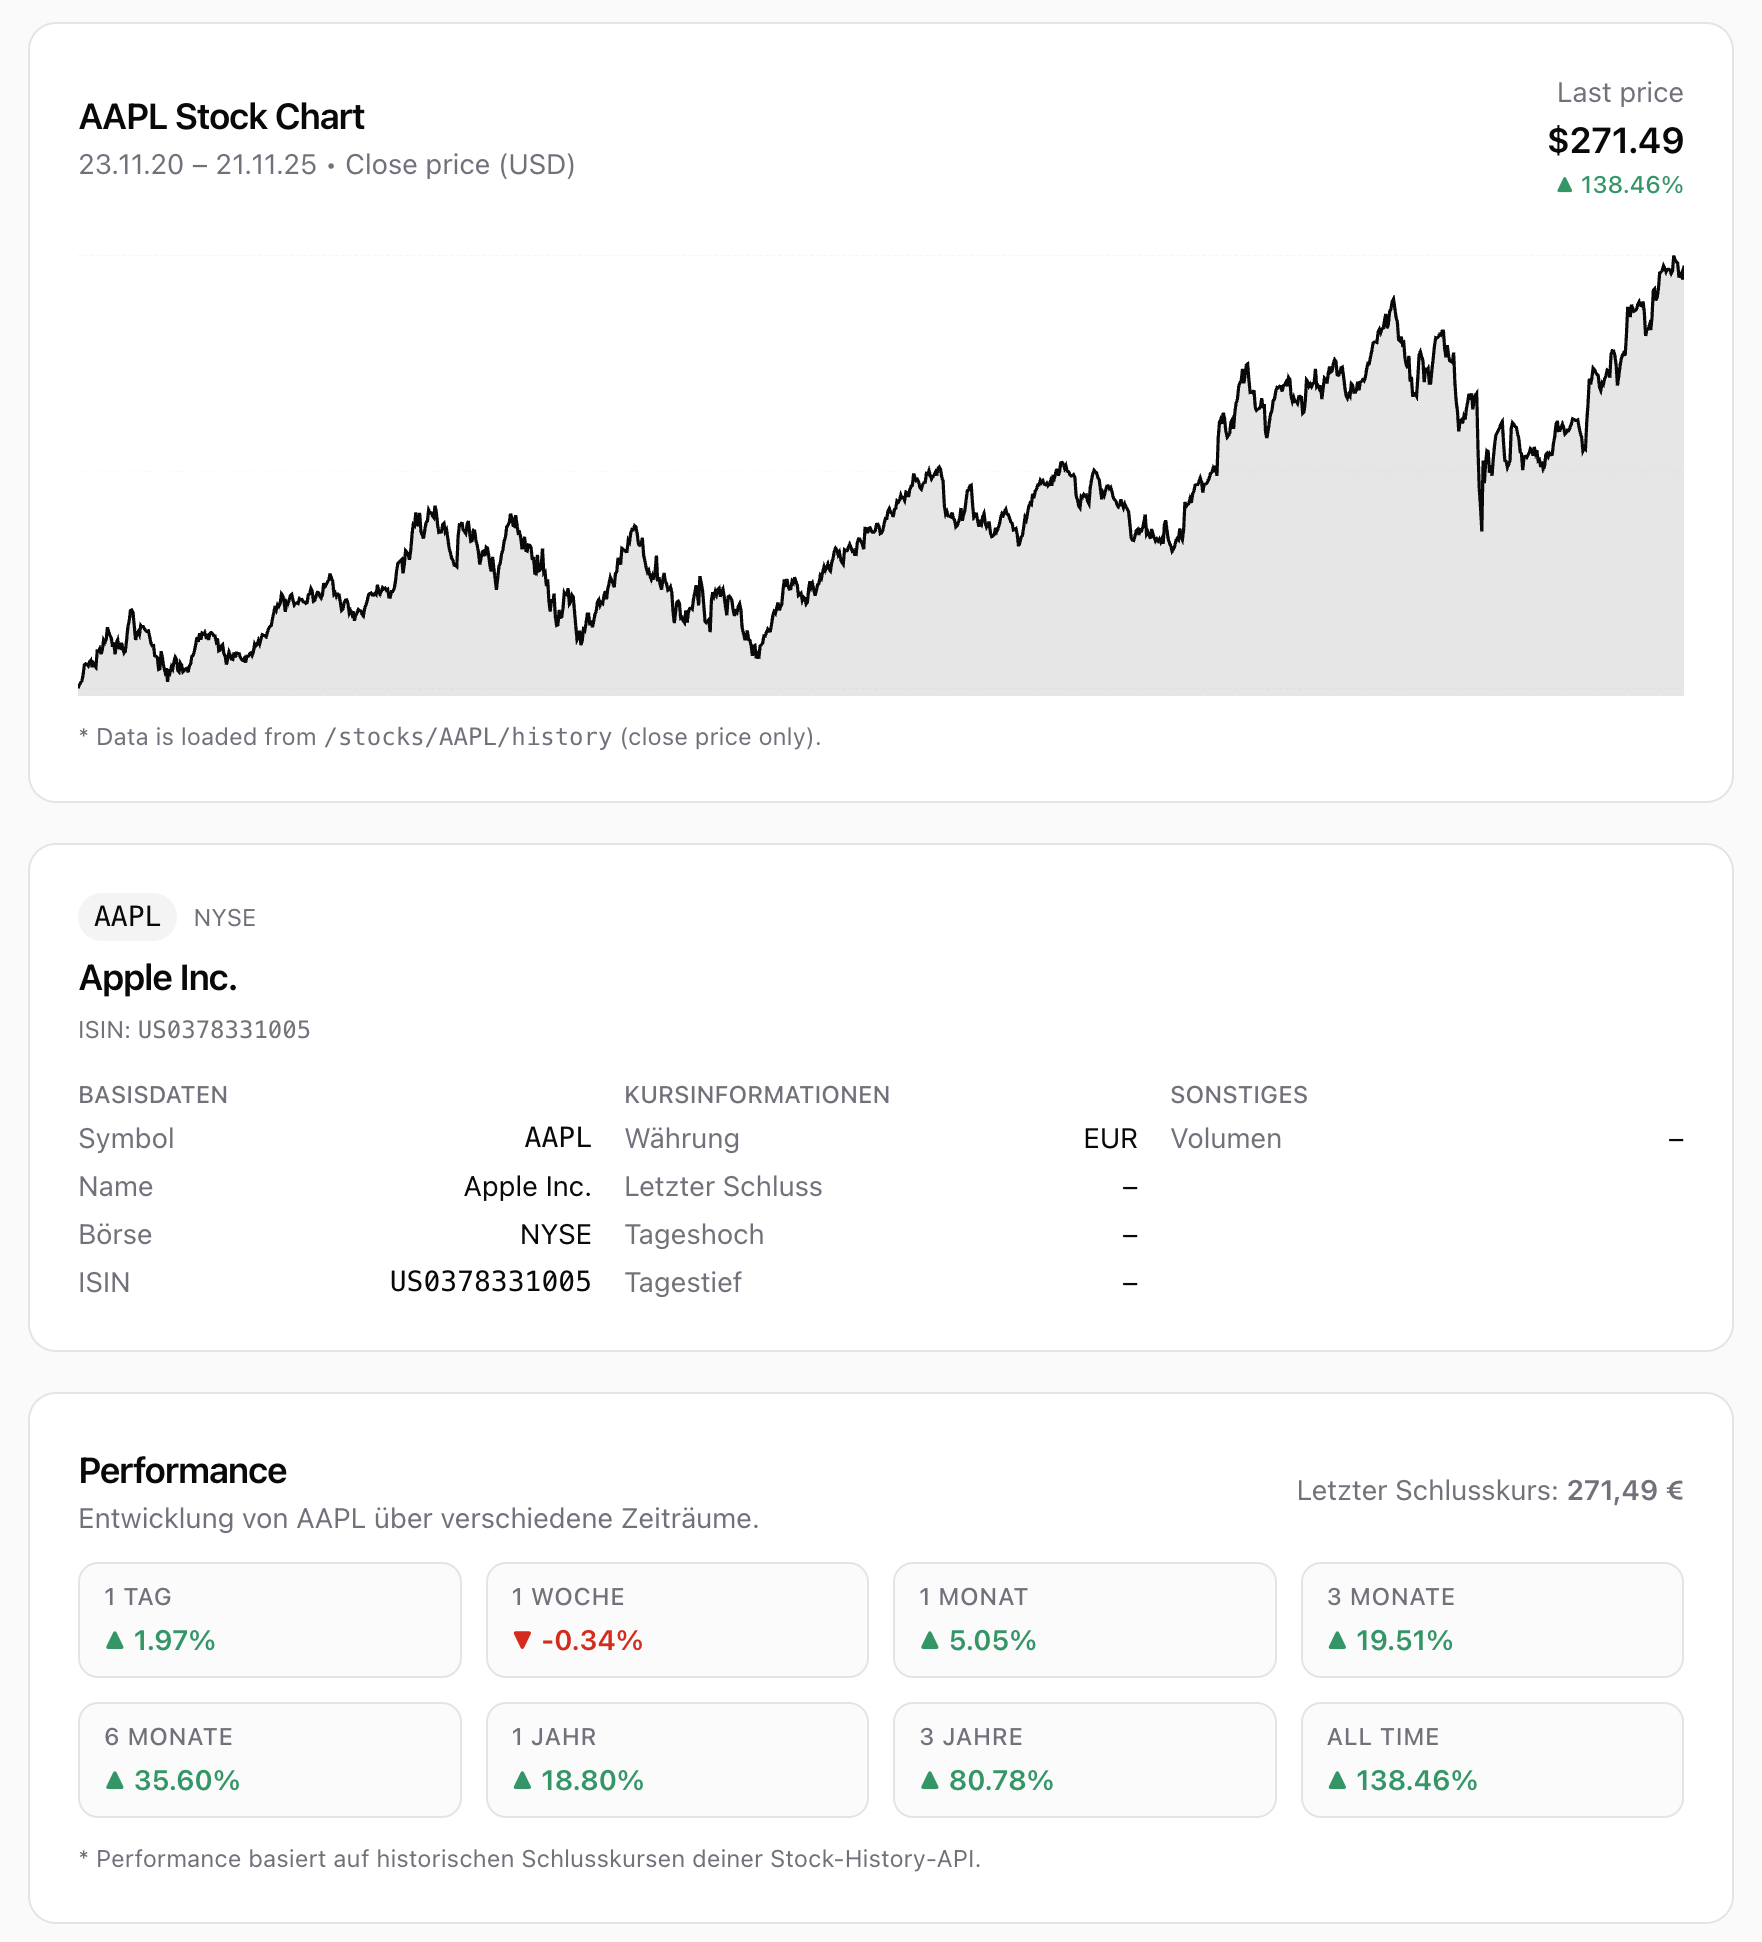
Stock Insights (here Apple stock)
-
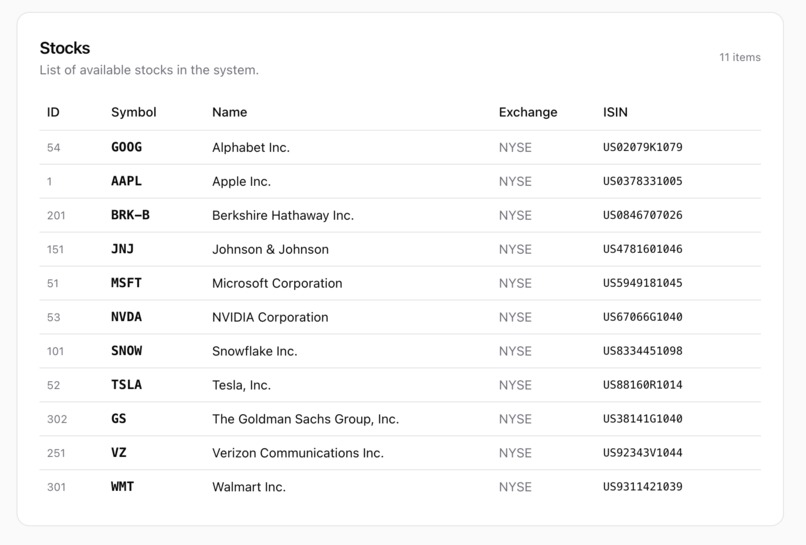
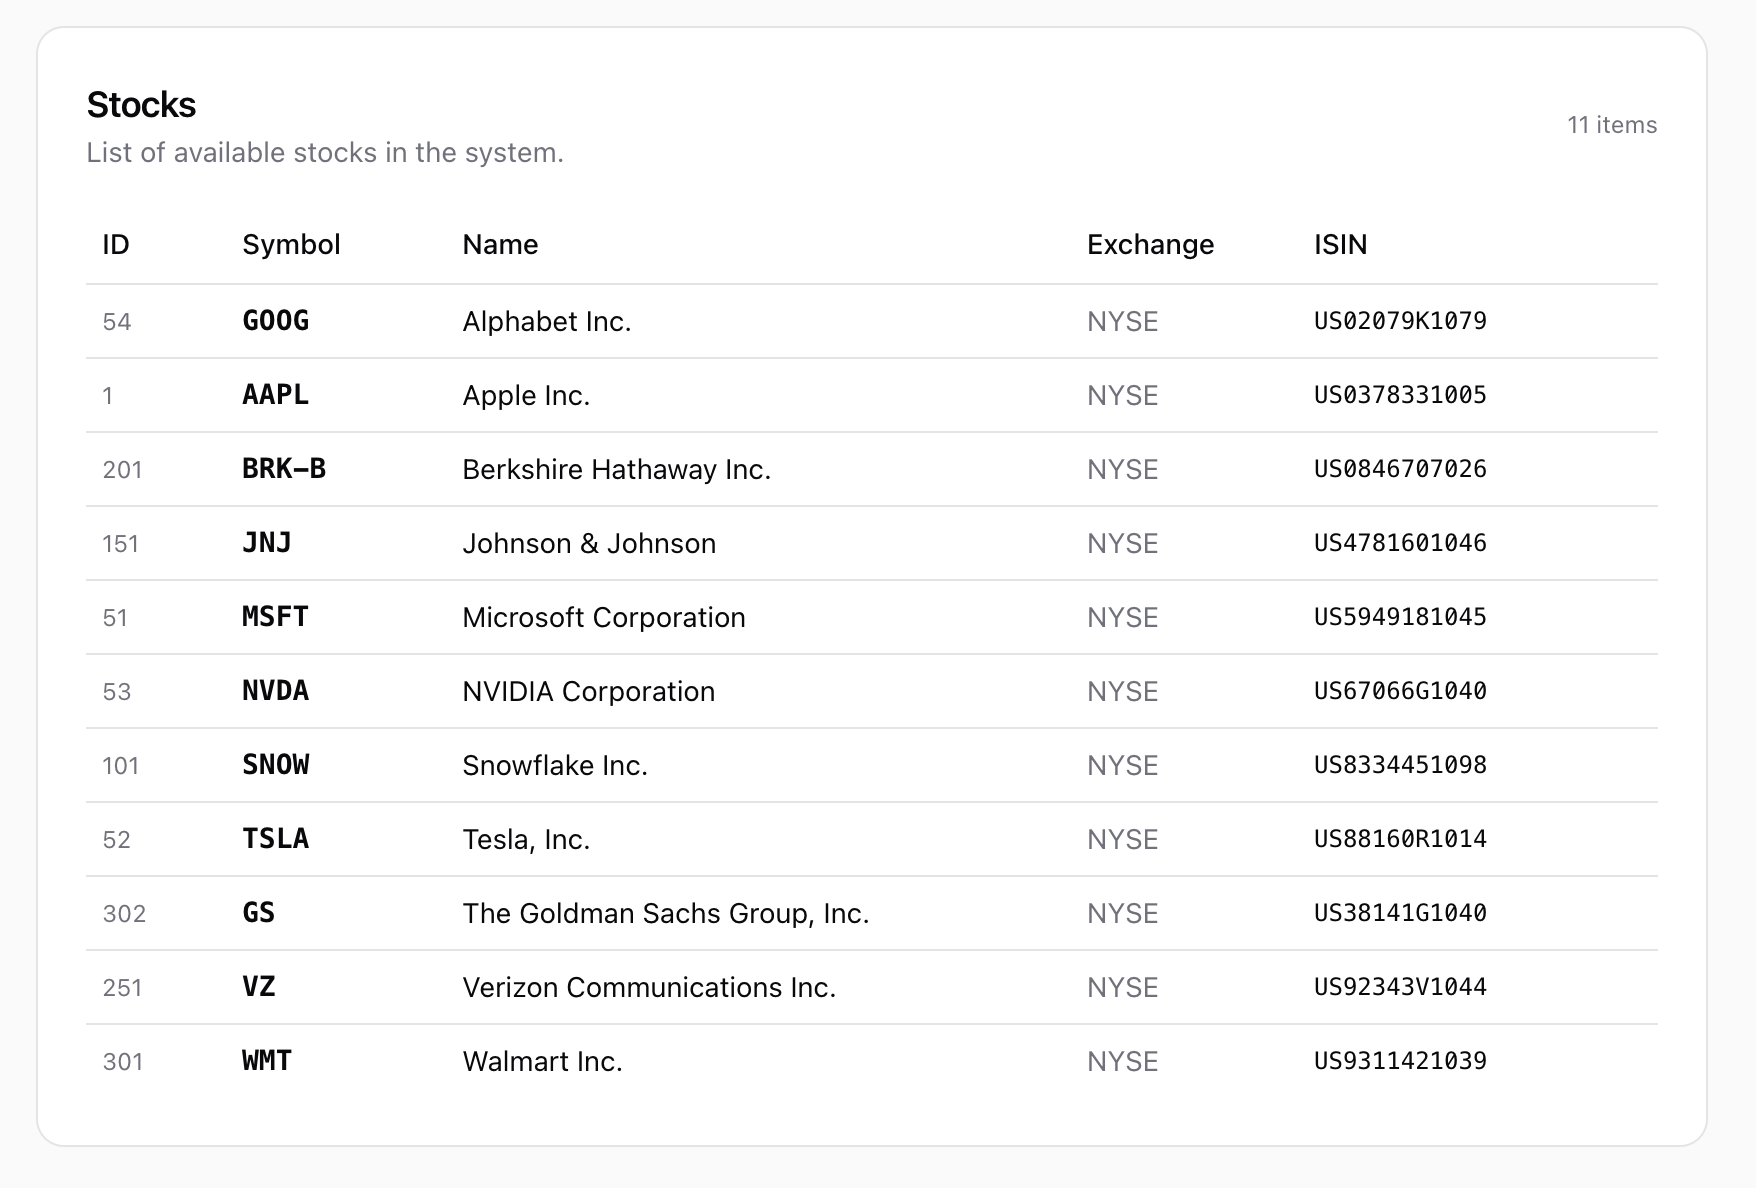
List of managed stock tickers by StockPilot
-
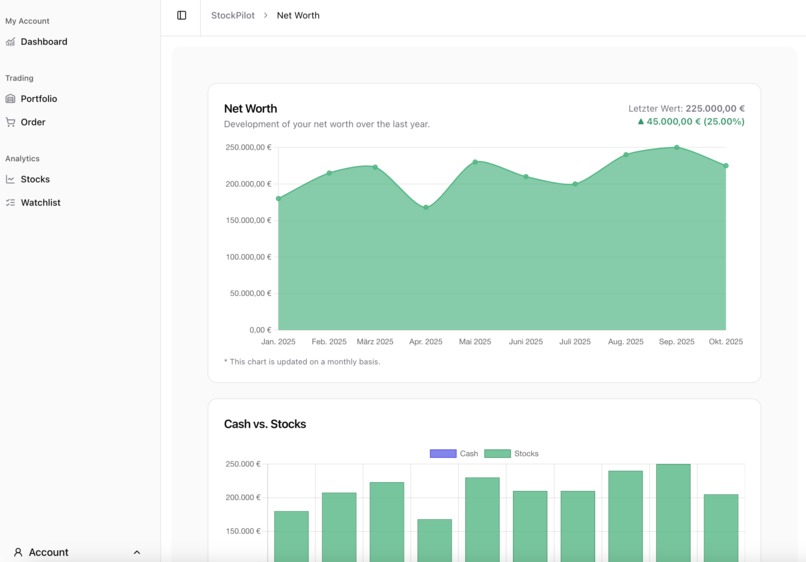
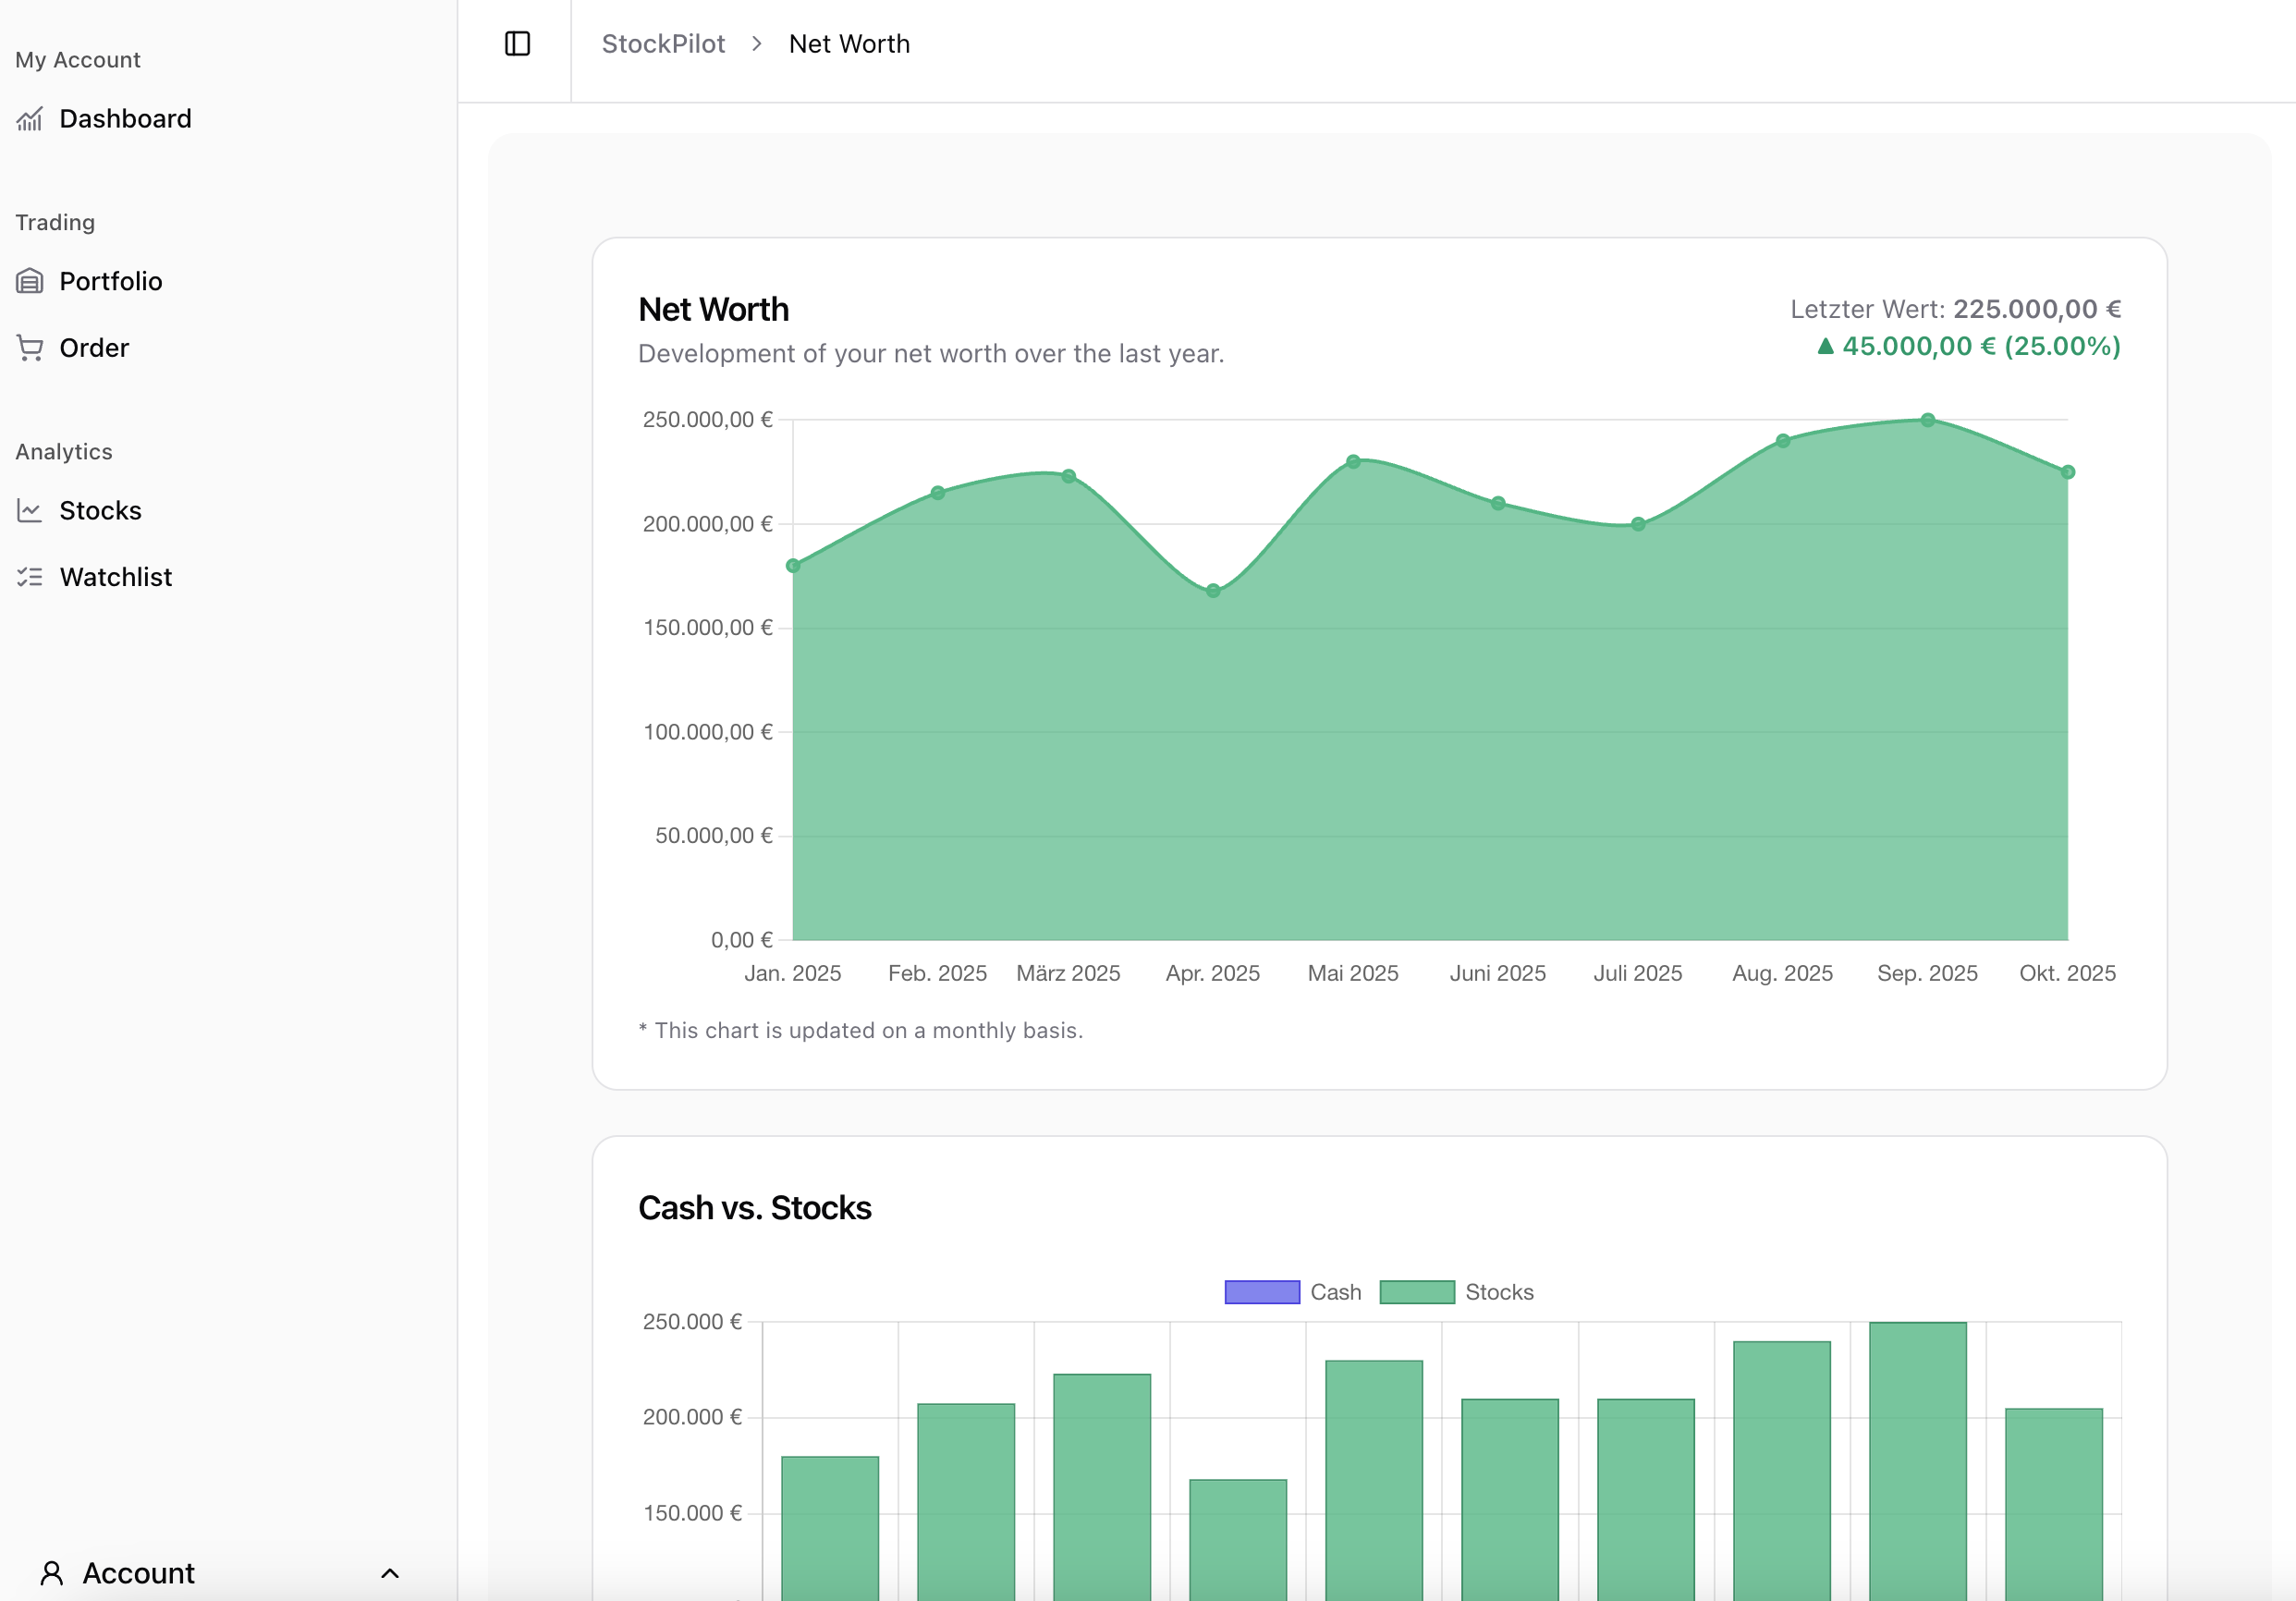
Comprehensive dashboard to keep track of financial growth
-
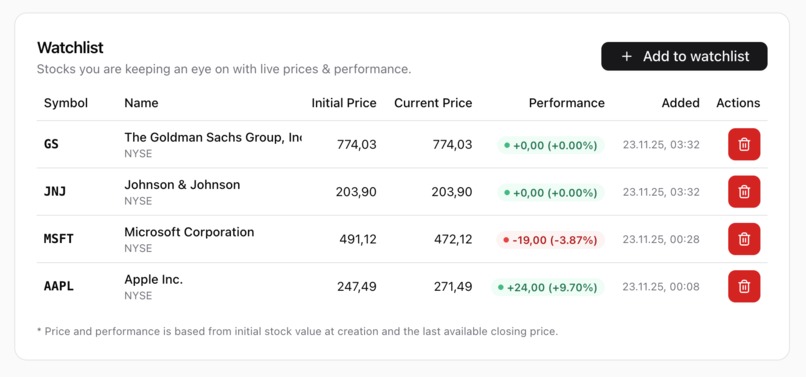
Add interesting stocks to watchlist

PortfolioPilot is a lightweight, smart portfolio management tool designed to give investors a clear, real-time understanding of their assets. Built within a 24-hour hackathon, the project focuses on transforming complex financial data into simple, actionable insights — all in one intuitive interface.
Managing multiple brokers, tracking performance, and staying on top of market movements is often chaotic. PortfolioPilot centralizes everything: from holding your positions to fetching live prices, evaluating technical trends, and visualizing your long-term wealth development. The goal is to help users understand their portfolio instantly and make smarter investment decisions without unnecessary noise.
✨ Core Features
Portfolio Management: Add and edit stock positions, track quantities, purchase prices, and total exposure.
Live Price Updates: Retrieve and refresh market data in real time through connected APIs.
Technical Trend Analysis: Simple moving averages (SMA) and trend indicators give quick insights into price direction.
Company Metrics: Key financial figures like P/E, market cap, and sector information (depending on available data).
Order Simulation: Create buy, sell, and limit orders as part of a local trading workflow (no real broker integration).
Wealth Overview: Visualize your net worth growth and portfolio allocation over time.
Clean Dashboard: A modern UI providing clarity without complexity.
🎯 Why We Built It
Professional financial tools like Bloomberg Terminals often cost thousands of euros per month — far beyond what private investors can afford.
👉 With PortfolioPilot, we want to prove that it’s absolutely possible to build a free, open-source, and lightweight platform that:
- looks and feels professional
- is intuitive and effortless to use, better than using MS Excel ;)
- visualizes real market and portfolio data
- and helps investors make smarter, more informed decisions
All without the price tag of enterprise finance software. PortfolioPilot aims to be the sweet spot — a tool that makes financial awareness accessible and insightful.
🏗️ Tech Stack
Frontend: Vue (with Tailwind / Shadcn), Chart.js for visualization
Backend: Java, Quarkus
Database: PostgreSQL
APIs: Market data providers (e.g., Alpha Vantage, Finnhub, Yahoo Finance wrappers), we used FinancialModelingPrep (FMP) api to load historical stock prices.
🚀 Status
This is an early-stage prototype created during a hackathon. The foundation is built for easy extension — such as broker integrations, advanced analytics, tax reports, or automated rebalancing in the future. Advanced features like stock splits or real time stock pricing updates.
Built with ❤️ during HackaTUM 2025.
Built With
- java
- javascript
- postgresql
- quarkus
- schadcn
- vue

Log in or sign up for Devpost to join the conversation.