-
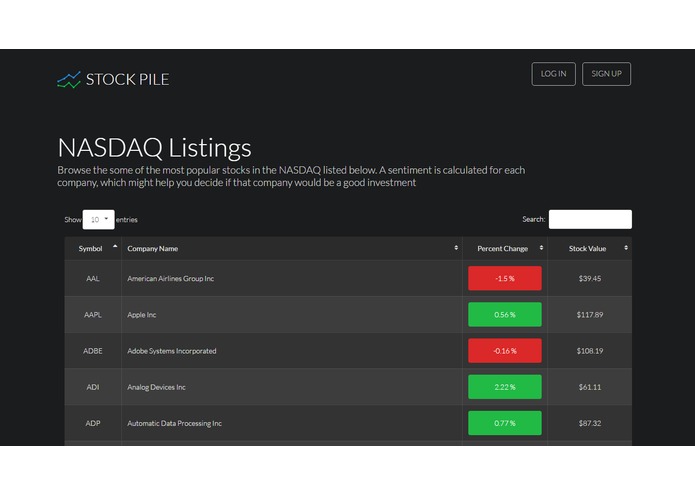
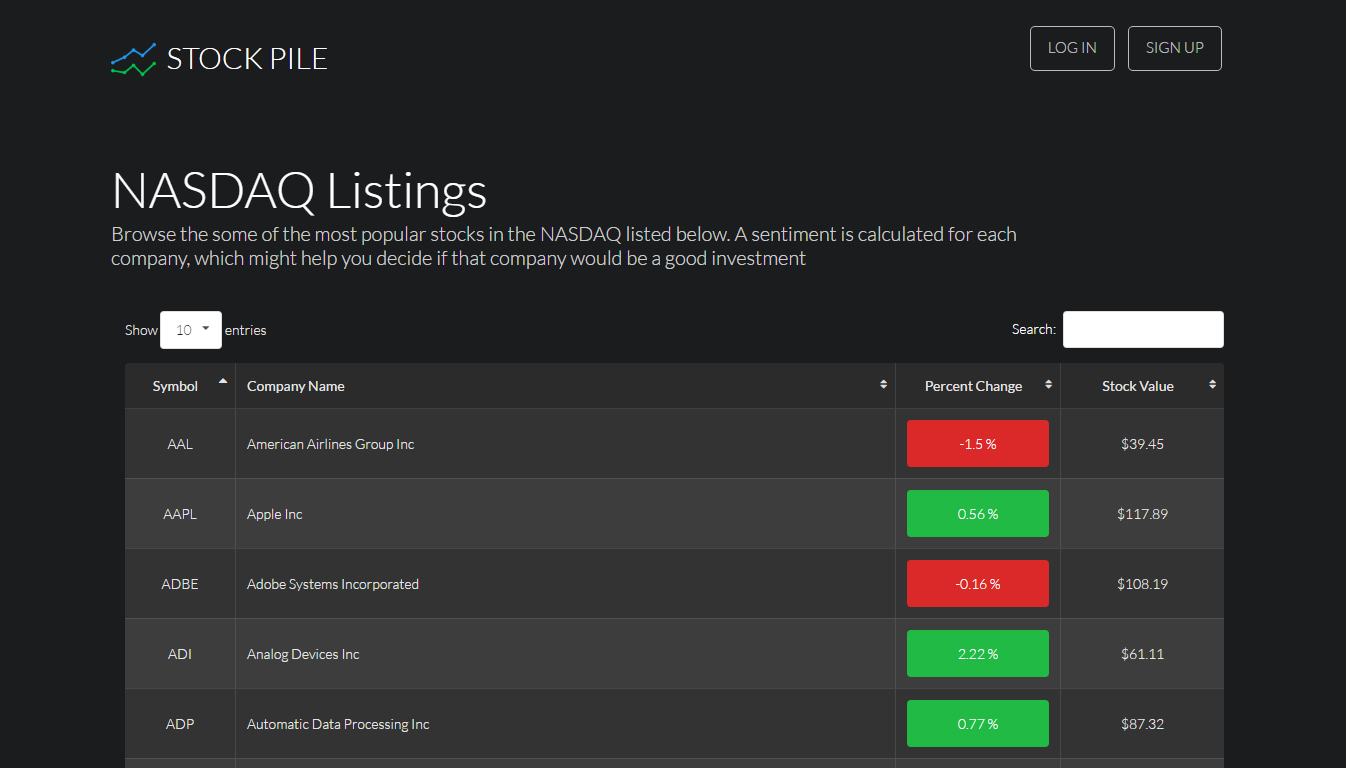
A view of our main page
-
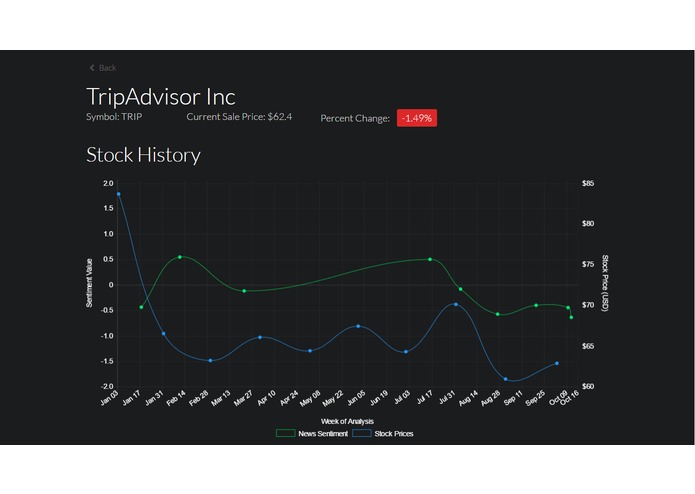
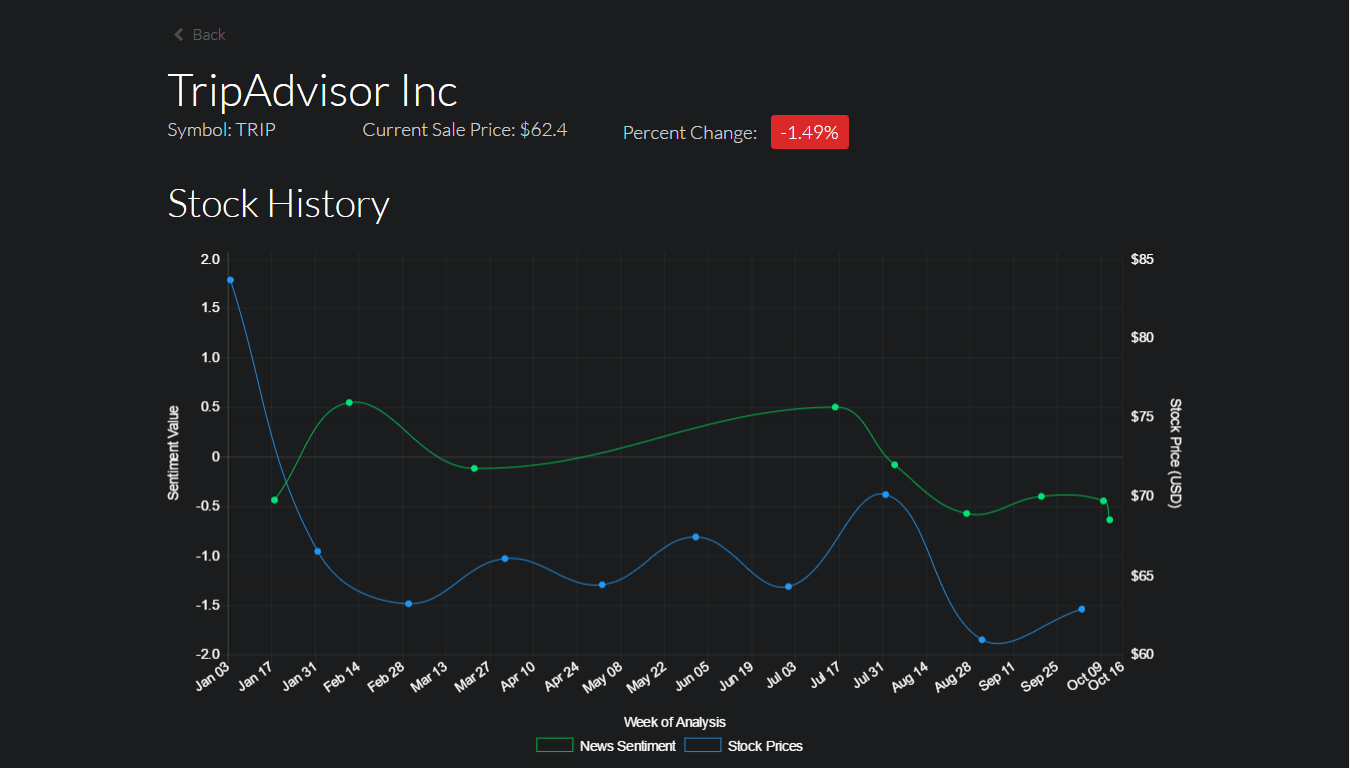
A view of our stock information
-
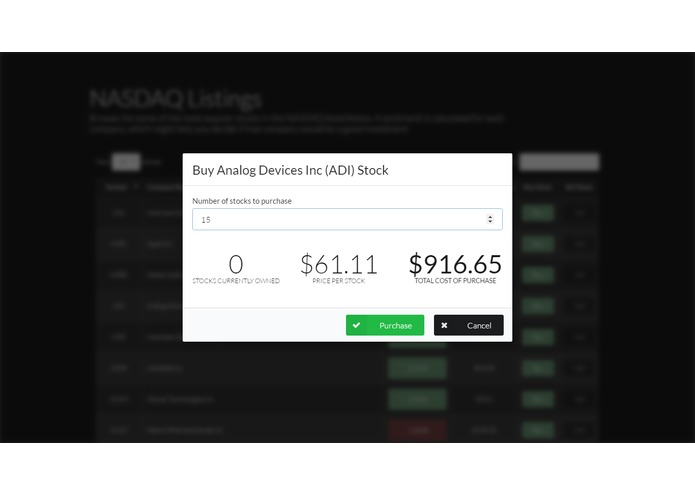
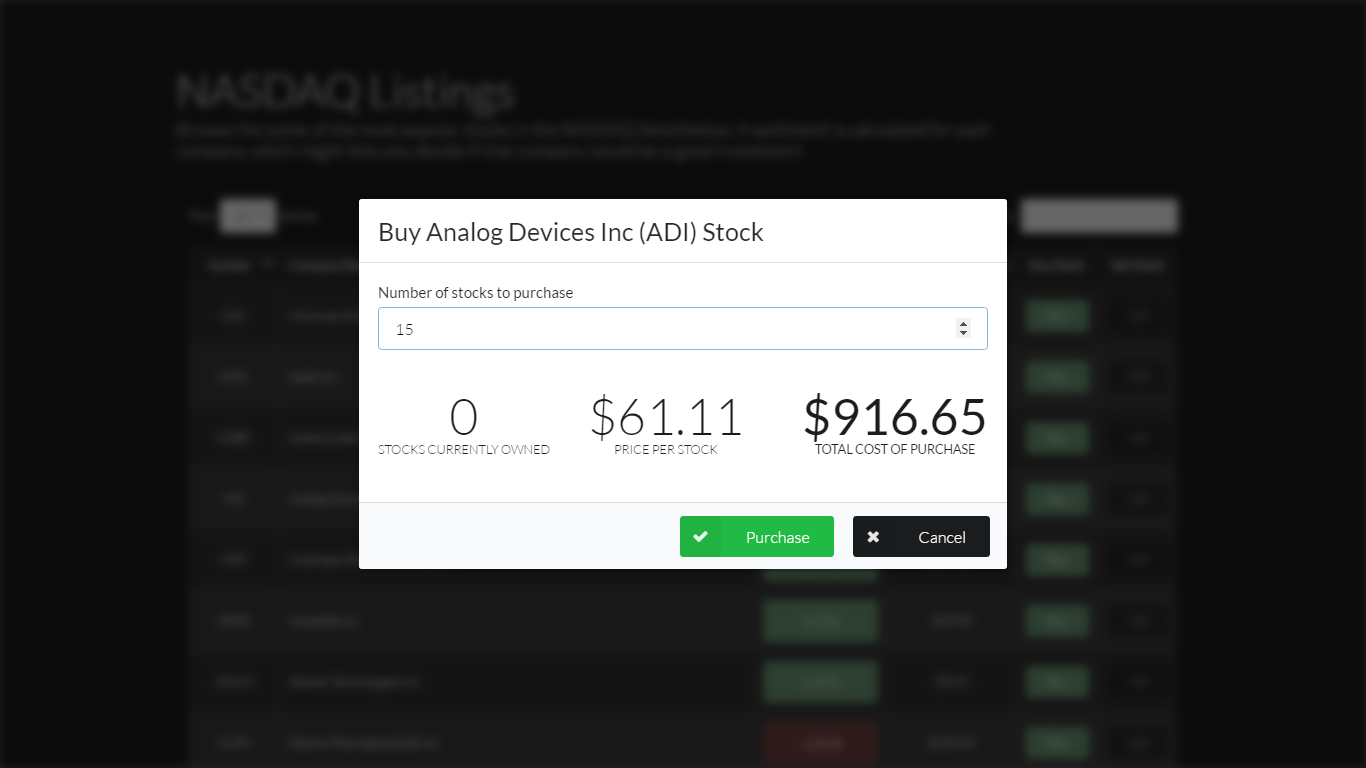
Simulate buying stocks with real-time information
Inspiration
Success in financial technology used to be completely proportional to the amount of data a company owned. Though the amount of data you have still remains a key factor to financial success, companies are needing to find new ways to apply their data, in order to see increasingly beneficial results.
Our inspiration is rooted in the idea that data is not only about how much you have, but about how well you use what you have. StockPile is an application that focuses on taking data to another level, where companies and individuals will be able to use deeper analysis to gain a competitive advantage in their fields.
What it does
StockPile is a web-based application that provides a unique spin on managing stock portfolios. By using sentiment analysis, StockPile can plot data about how a company is being reported about in social media (for the purposes of this hack-a-thon, we will pull information from the New York Times). This data will provide a further insight into the potential of success or failure a company may have. The data will be plotted along with each company's stock trends for an easier analysis.
The ultimate goal is to provide the users with a new tool for analyzing stock trends. Since social media can have a serious impact on business, it is logical to think that the positive or negative articles being written about certain companies can have an impact on their shares.
StockPile also provides the ability to simulate the buying and selling of stocks, and to manage a personal portfolio of one's stock data. The application encourages the use of storing a user's stock portfolio (including real dollar amounts), and allowing the user to observe sentiment analysis trends to provide assistance in deciding when to buy or sell stocks.
How We built it
The implementation of StockPile was divided across the team. One member focused on processing the data through the Node.js server, while the other member focused on implementing front-end logic in JavaScript and EJS templating.
On the back-end, Express routes were set up to provide access to many different views and handle user sessions. Then, the focus shifted to gather data by interacting with the external APIs. New York Times API was used to gather news articles on each company, then these were fed into the Dandelion API for Sentiment Analysis. Once the data was retrieved, it was parsed and put into clean formats for use on the front-end. The server required use of many different "node modules" or npms, in order to drive the development and make data processing easier to manage.
On the front-end, the implementation of Data Tables created an organized way to store and view stock information. It also provided simple access to the sentiment analysis data specific for each stock. Then, the buying and selling of stocks were implemented along with user profiles to keep track of portfolios for each user. The Chart.js library was used to visualize our results, providing a plot of sentiment data, along with the Yahoo! Finance stock trend information.
In terms of technology, Node.js was used as the server, with primarily JavaScript/JQuery as the client. EJS (Embedded JavaScript) was used as a templating engine for different views, and mixed nicely with the CSS of Semantic UI.
Challenges We ran into
Publicly accessible free APIs caused several issues during the development of this project. Originally, we had chosen to obtain our sentiment analysis information from IBM Watson's AlchemyNews API. This API was perfect for what we wanted to accomplish because it queried it's own storage of news articles, without us having to retrieve the articles ourselves. However, the problem was that the API limit was exceeded after only a few requests, making it a frustrating process to work around. In the end, we ended up using two separate APIs to complete the task, which required a little extra effort.
Accomplishments that We're proud of
Going into this project, we were not certain that the results we obtained were going to in-fact show accurate results. It was indeed a gamble to assume that we would see stock prices contain a correlation to news articles. We are proud to say that after implementing our application, we were correct to assume that the stock prices would indeed fluctuate with the sentiment analysis retrieved from news articles. This was a huge bonus for us to know that our implementation is indeed useful and correct.
What We learned
Financial technology has not been a focus of ours, therefore we feel we learned a lot about the financial technology sector. We also learned a lot about different types of sentiment analysis, as we had to go through many external APIs before we found one that suited our needs, after our original API fell through. This was a unique experience, as these APIs certainly provide an advanced way to write code.
What's next for StockPile
- Implement different types of cognitive analysis to be plotted and observe their trends against stock data
- Implement real-time stock trading to centralize the task of buying and selling with the tools that make the process more efficient
- Implement machine learning to recognize further trends against stock information
- Implement cognitive assistance to help suggest stocks to buy/sell based on stock information and sentimental analysis
Built With
- chart.js
- css
- dandelion
- data-tables
- ejs
- express.js
- html
- javascript
- mongodb
- new-york-times
- node.js
- semantic-ui
- yahoo-finance

Log in or sign up for Devpost to join the conversation.