-

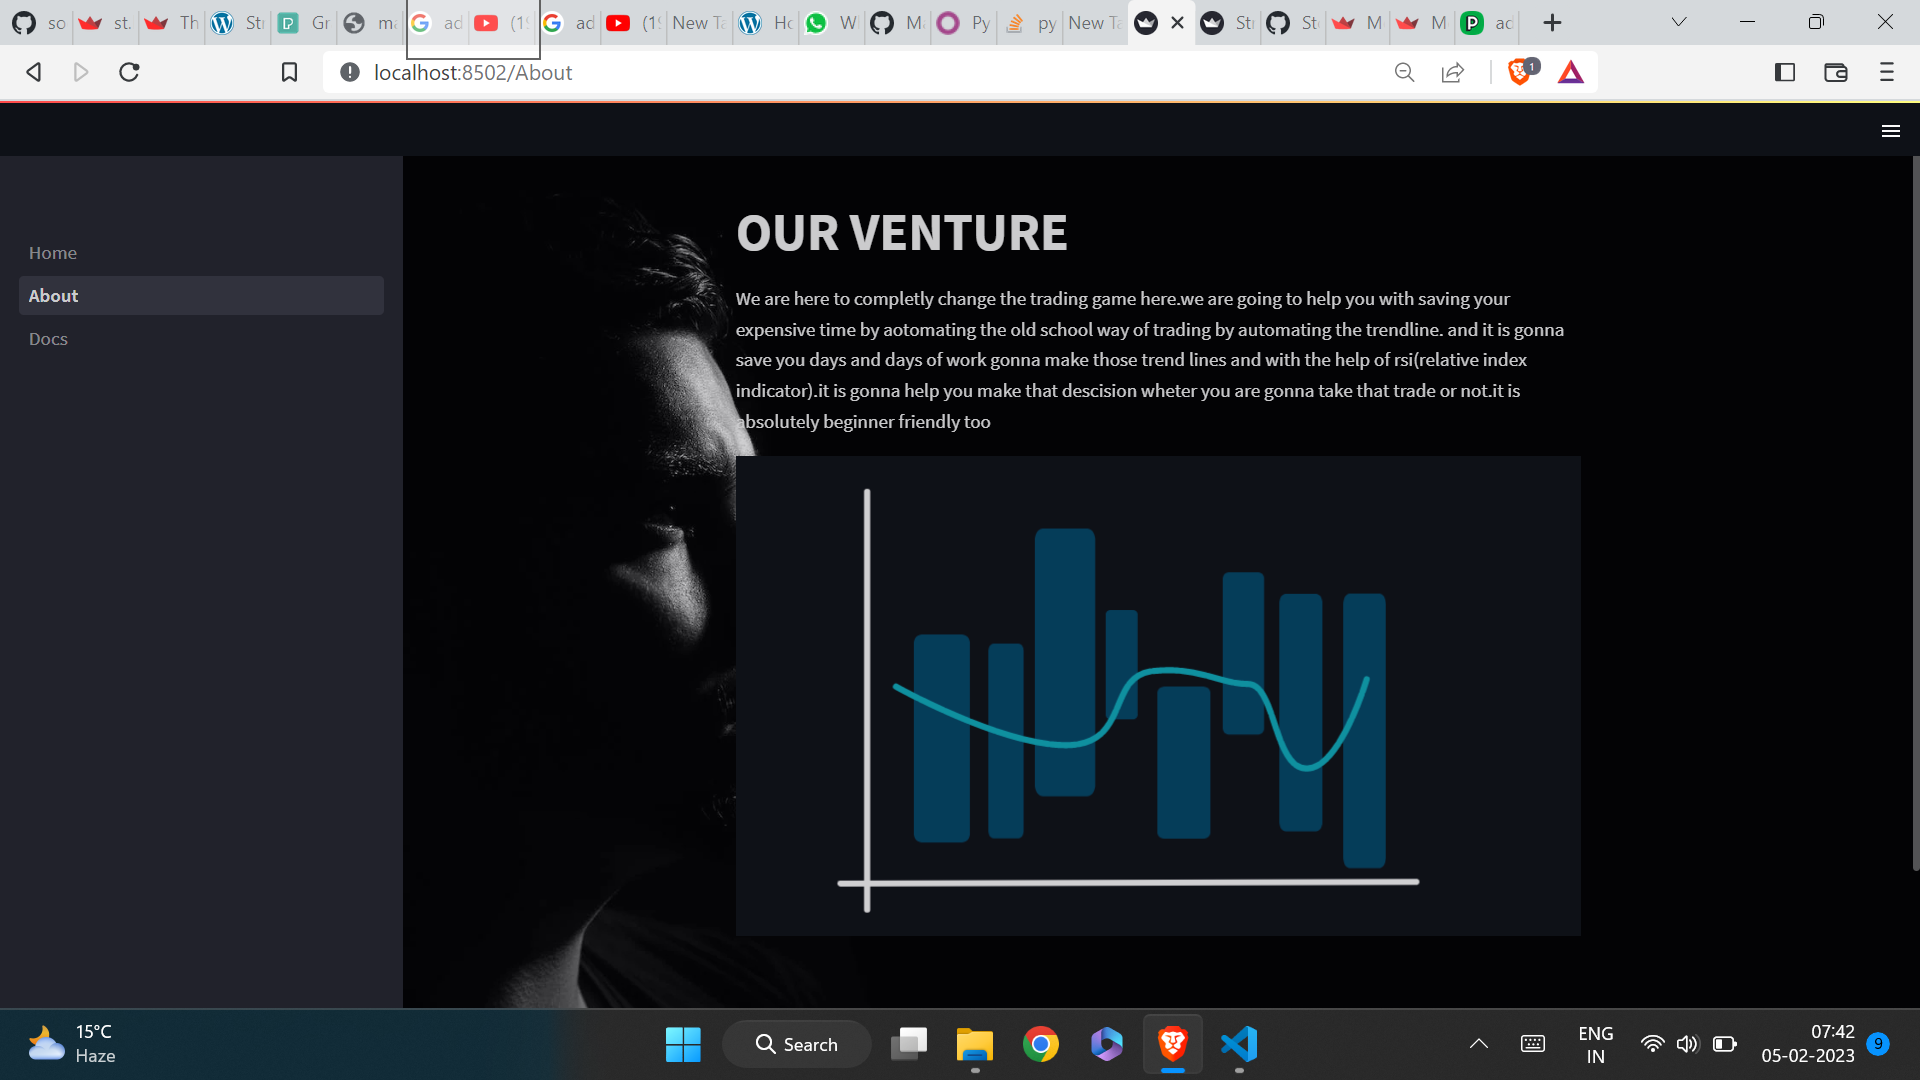
About page
-
Working model
Inspiration
We as traders found it difficult to identify the stock chart patterns, and make timely investments. So, we collaborated to build a tool to analyze the chart patterns fast and accurately.
What it does
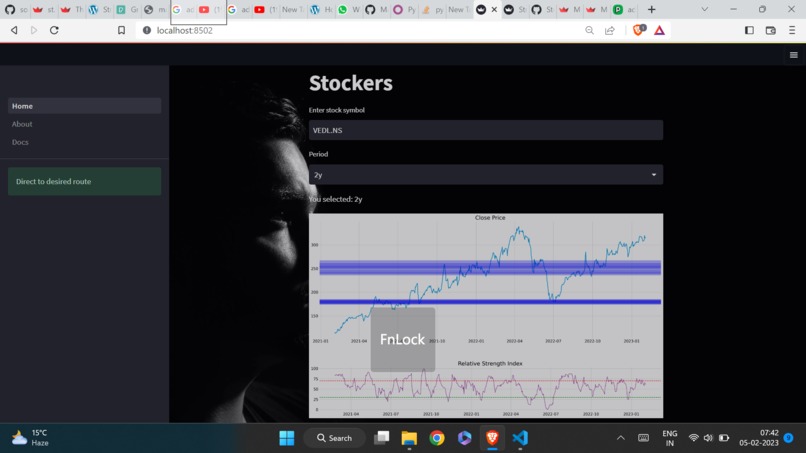
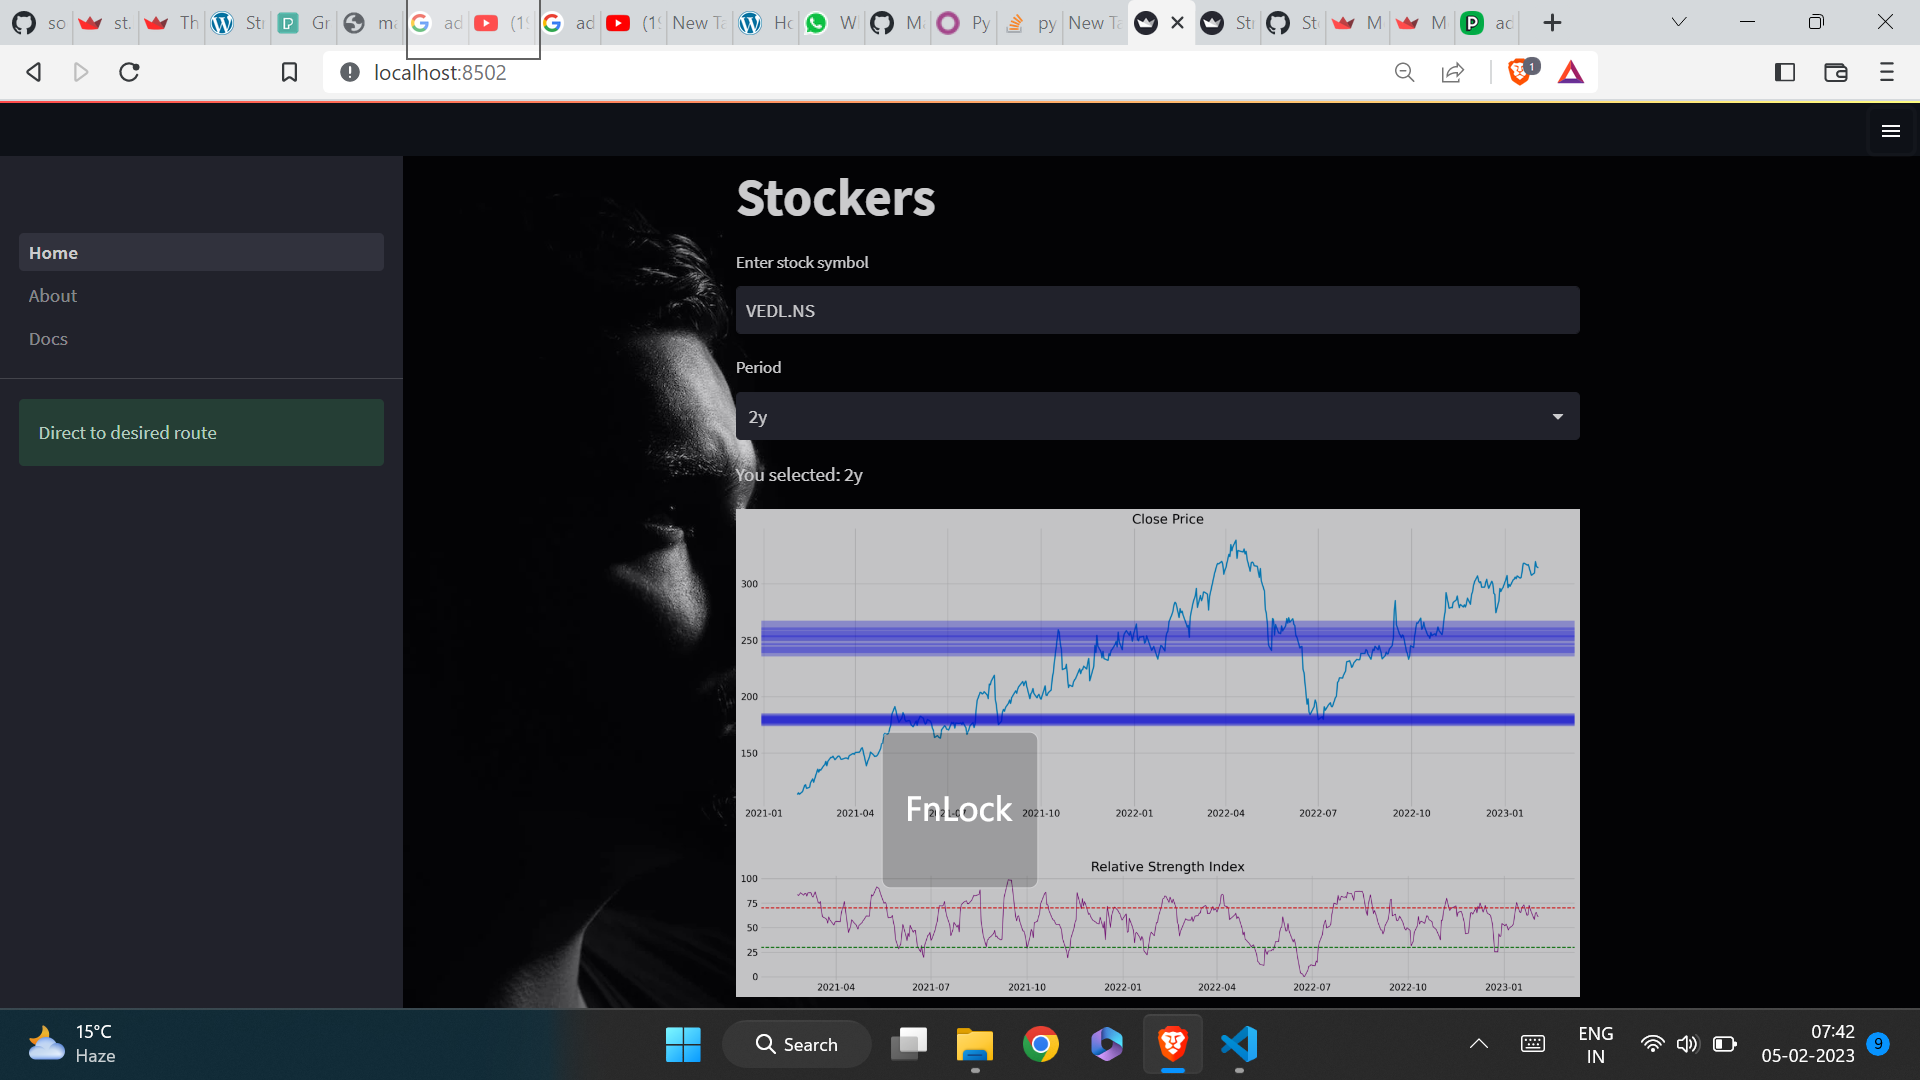
It automates the process of drawing out support and resistance zones as well as trend-lines on the stock chart, in real-time. Novice traders are incapable of identifying correct stock price indications and movements, so our project helps them to get into the domain of stocks.
How we built it
We incorporated our entire project using python, we used MatPlotLib for the chart analysis and Streamlit for the web-development. First we used Plotly to draw our charts, then we used MatPlotLib. We were confused to use JavaScript, but then we thought of Streamlit as it incorporates python programs easily.
Challenges we ran into
We were new to the domain of charts and data analysis, also this being our first hackathon was a hassle in itself. Our 36-hour journey was full of ups and downs, but we were able to overcome every single bump with ease and finesse.
Accomplishments that we're proud of
We are proud of being selected into a hackathon event, more so to be able to accomplish our goals set for our first such competition. We are happy that we faced and defeated all the troubles that came our way.
What we learned
We learned teamspirit and comradery, we learned technical skills which were unknown to us.
What's next for STOCKERS
We as a team have just began our journey, we wish to go towards the horizon and see the vastness that the world beholds.


Log in or sign up for Devpost to join the conversation.