-
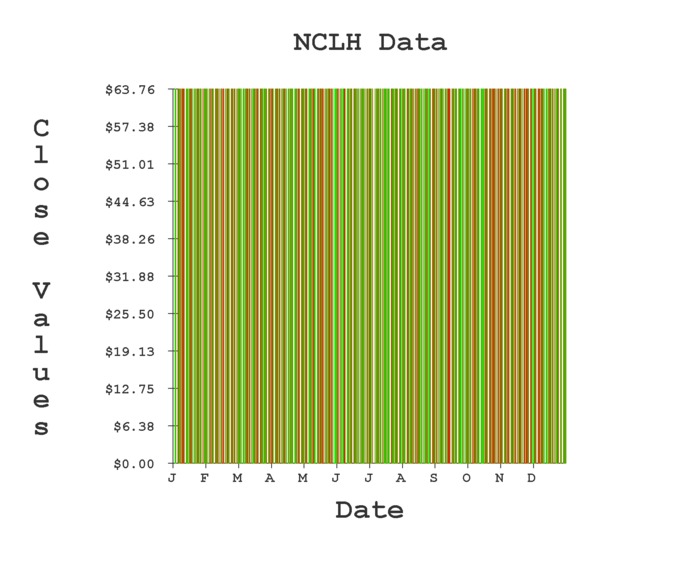
NCLH Gradient Data
-
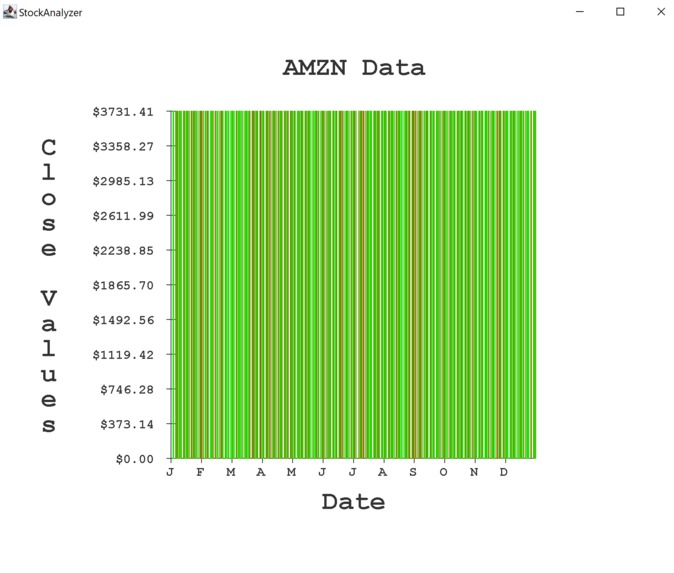
AMZN Gradient Data
-
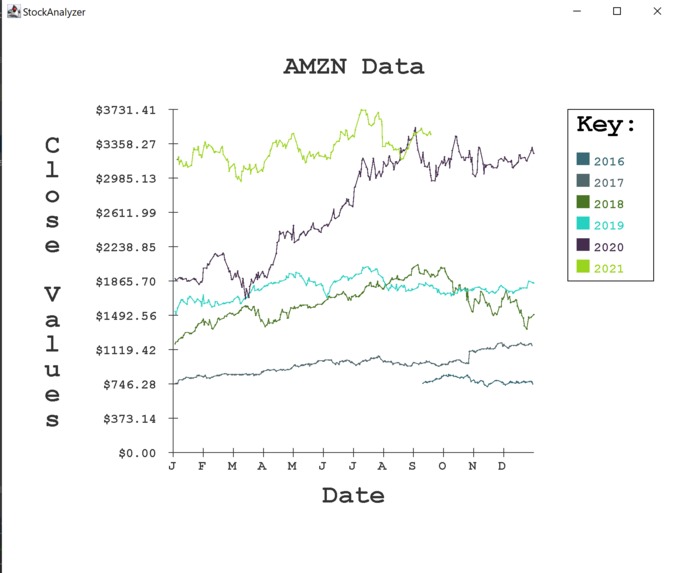
AMZN Cyclical Close Values


Inspiration
I recently got into investing in the stock market in June and I wanted to combine two of my passions (computer science and stocks) and create a cohesive project.
What it does
Using three different graphs, I can analyze how stocks behave cyclically and make financial decisions. An example of a decision I made is that I plan to sell my NCLH stock because the stock tends to go down from October to December.
How we built it
Using a download link from Yahoo Finance, I imputed the url into a reader, which will read the csv file from a start time to current time.
Challenges we ran into
A challenge I faced in this program was trying to eliminate outputting to the IDE and instead inputting on the application. I learned that inputting and using graphics in java do not mix and I had to improvise a solution (Create two different frames: one for graphics, one for input).
Accomplishments that we're proud of
An accomplishment I was proud of was being able to see the different colored graphs drawn perfectly in a way such that the data was readable.
What we learned
I learned how to take my creativity and translate it into great code. The idea of a gradient graph is a completely unique idea I came up with and I feel I executed well.
What's next for StockAnalyzer
As I learn more about the stock market, the more I will learn how to display my data in unique ways. In the future, I hope to be able to create more graphs that can help me with my future stock market endeavors


Log in or sign up for Devpost to join the conversation.