-
-

-
-

Stock Volatility Analyzer

Inspiration
I wanted to create something simple, yet useful. I enjoy data analytics and visualizing data, and I was thinking about how I could merge that passion with using Perplexity in a single product. Data visualizations help us uncover insights, but sometimes a chart alone doesn’t tell the full story. Having direct access to additional context while reading a chart is not just helpful, it can be critical in certain circumstances. That’s why I decided to blend analytics with live context and research provided by Perplexity. While my use case focuses on financial data for the hackathon, the idea could easily be expanded to other areas as well.
What it does
Historical Monitor
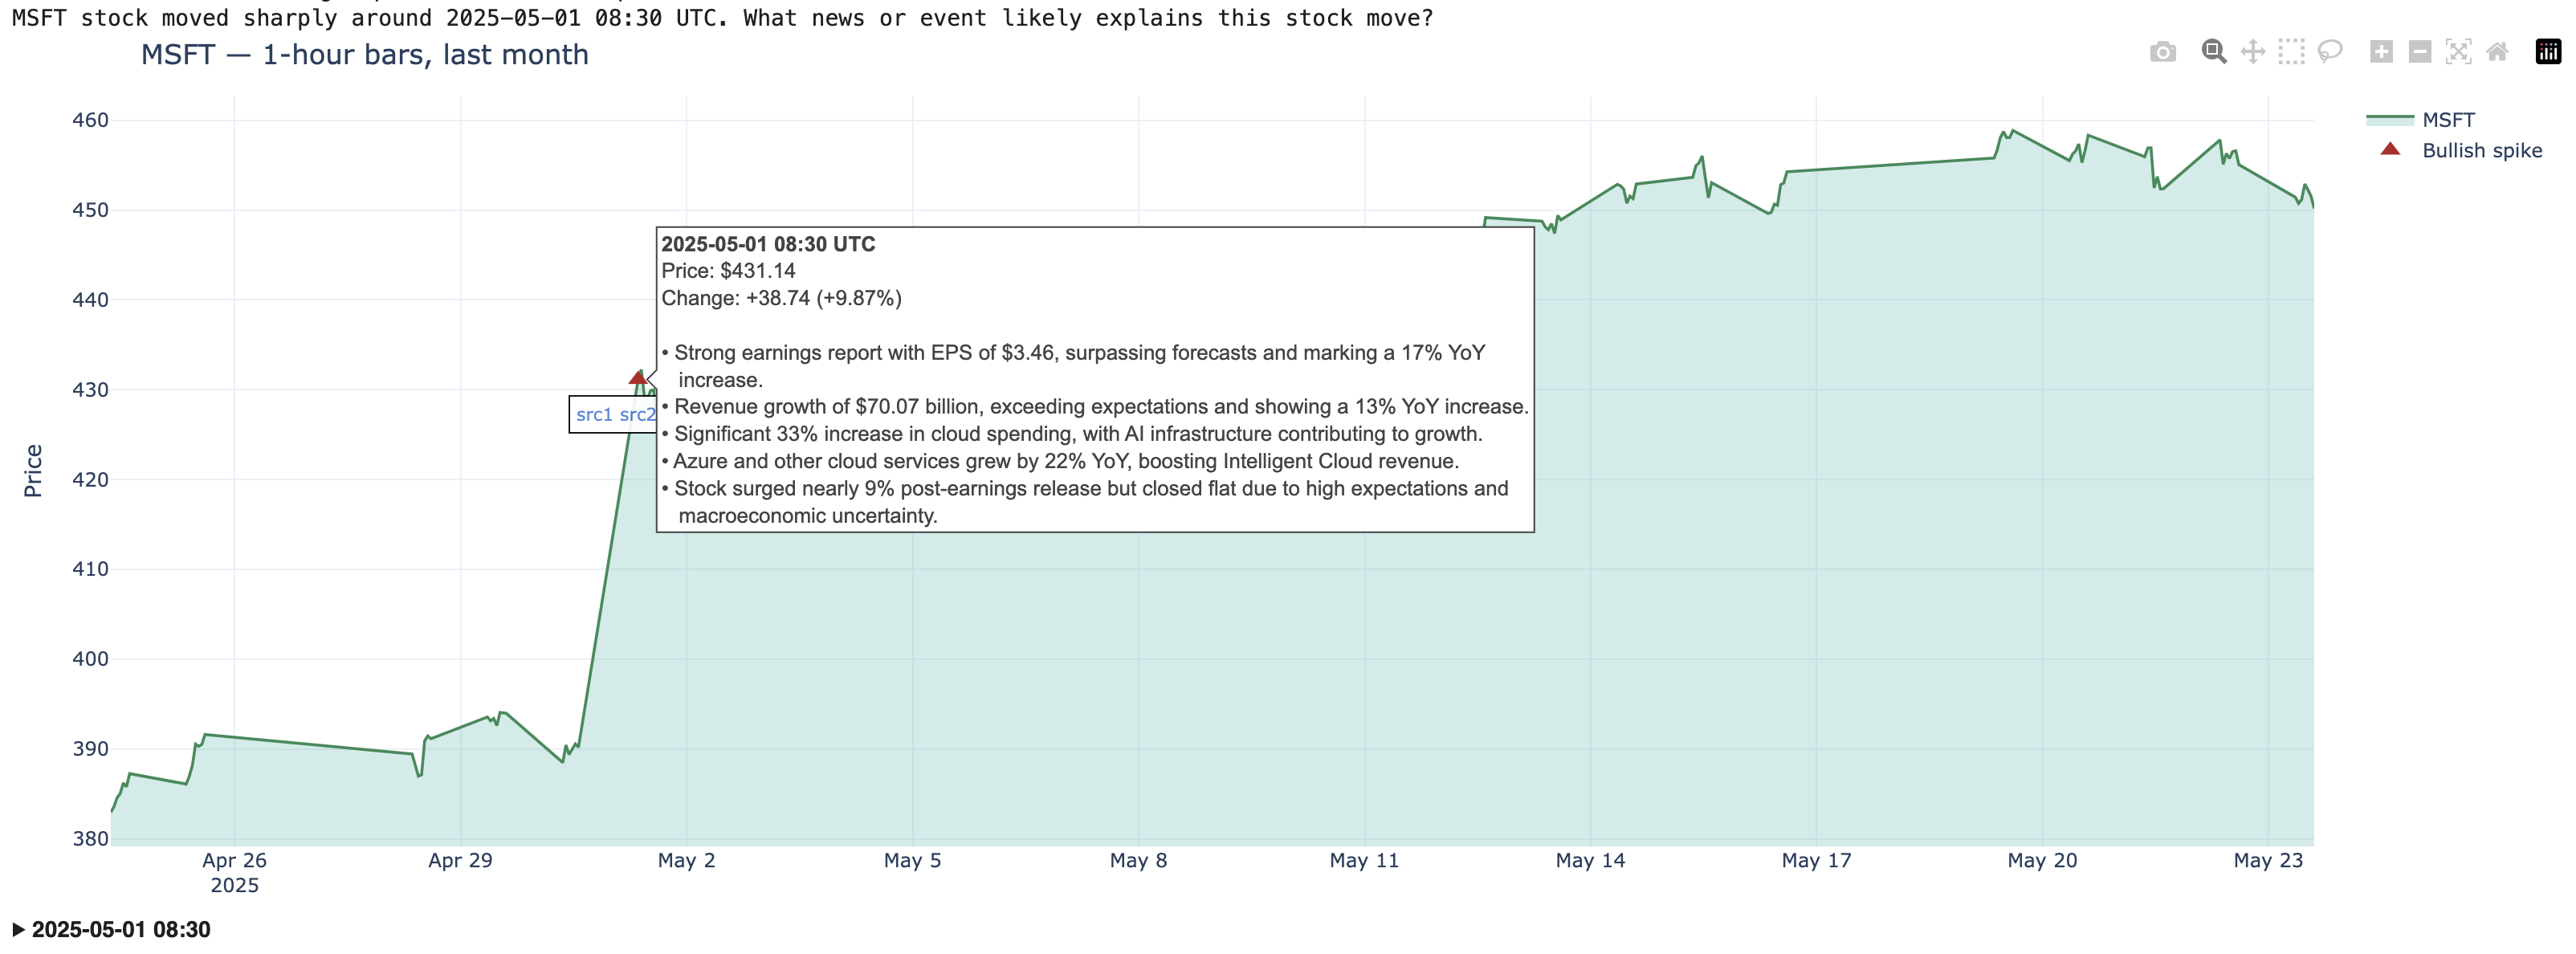
- Monitors historical 1-hour price movements for a given stock over a specified period, flags volatility spikes/dips based on a user-defined threshold (delta), and annotates them on a price chart with research based summaries generated by Perplexity to explain the volatility.

Live Monitor
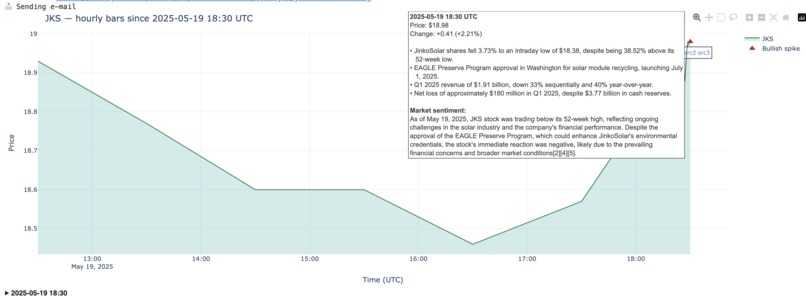
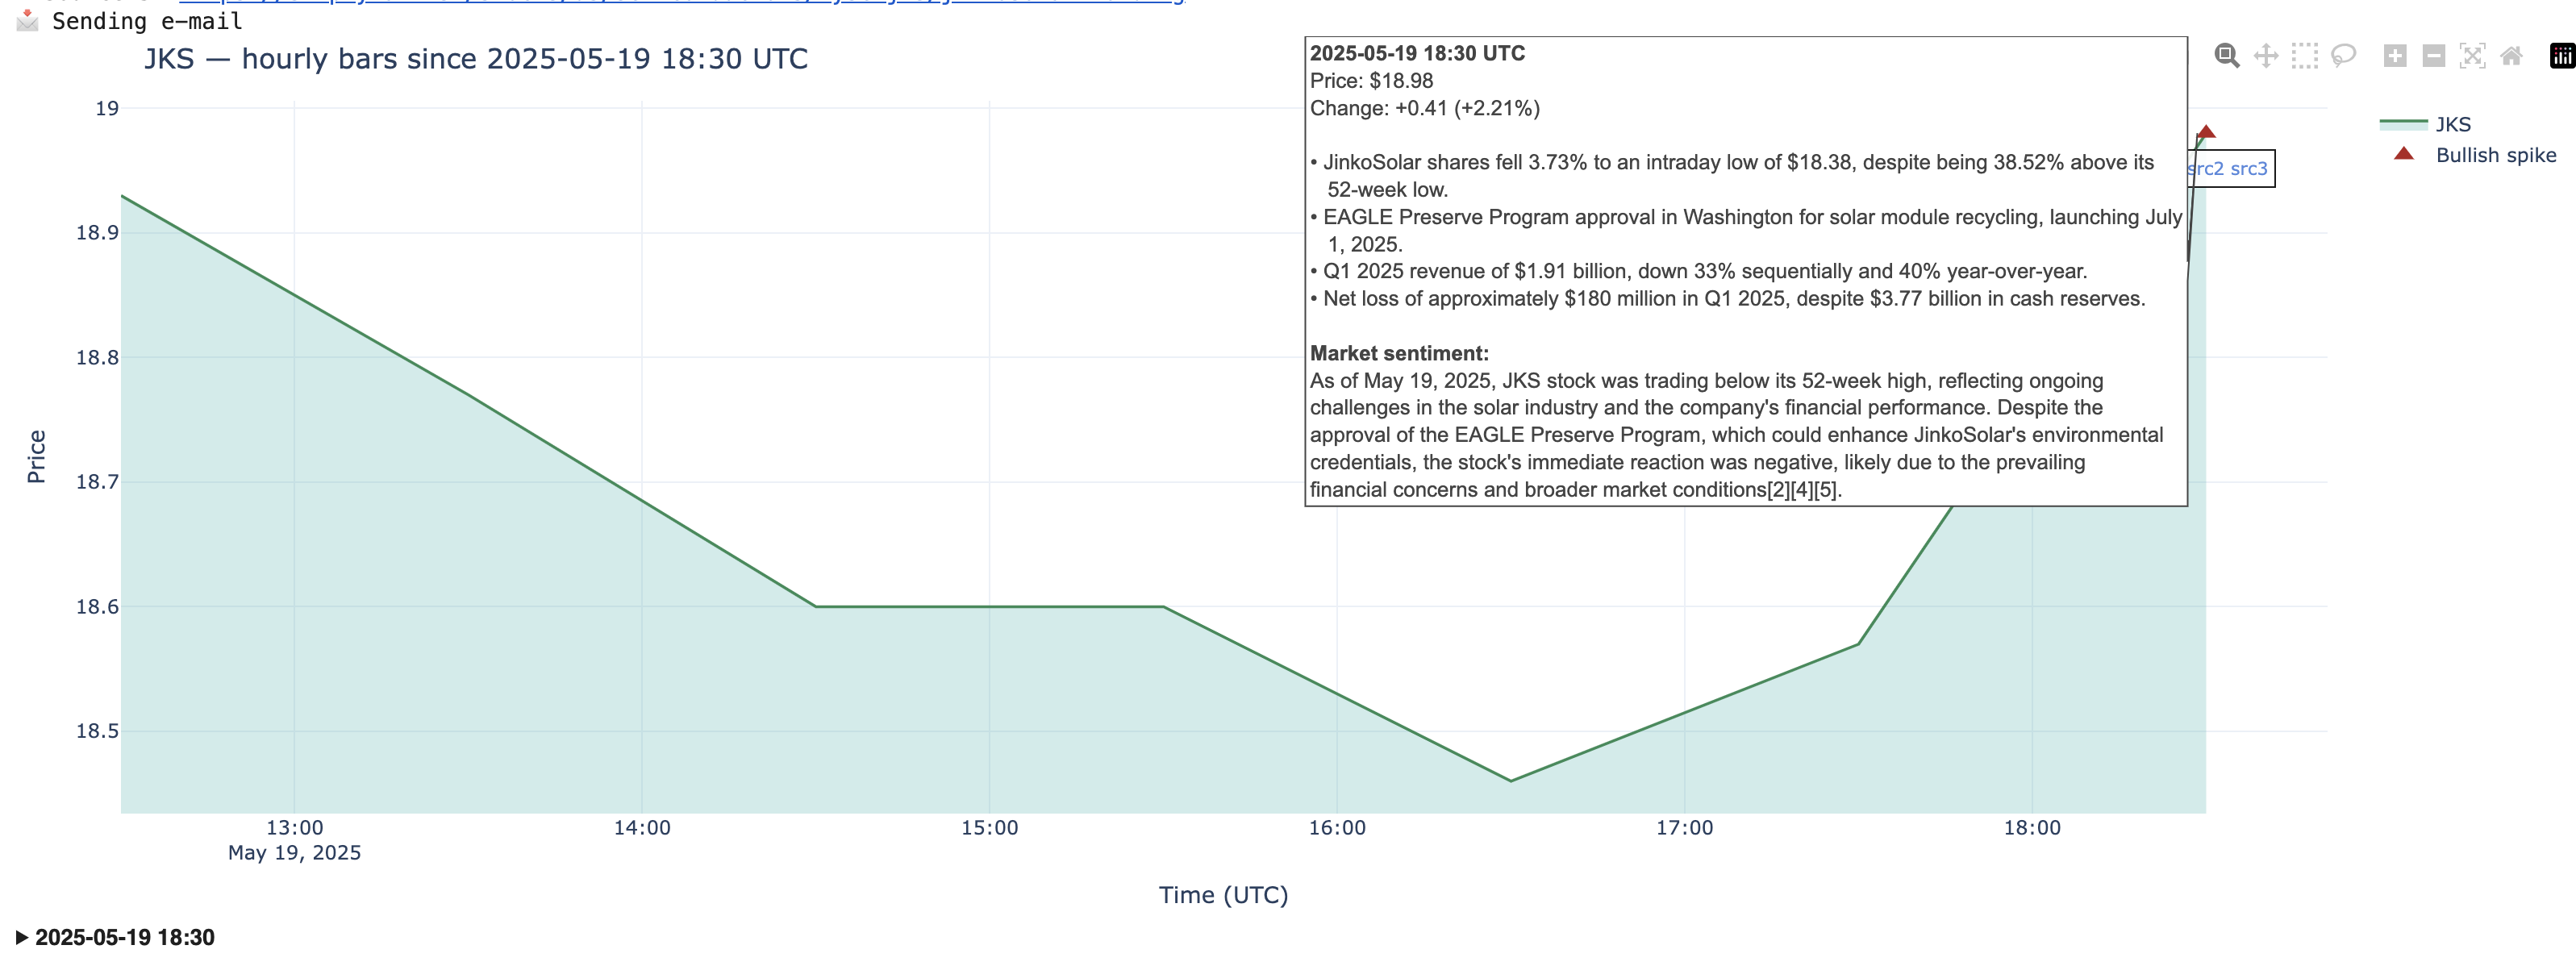
- Monitors hourly stock price movements using Yahoo Finance, flags spikes based on a user-defined threshold (absolute or percentage), and annotates them on a mountain chart with Perplexity-powered research summaries and market sentiment. Starts from midnight UTC each day and continues polling once per hour. When enabled, email notifications are sent for each detected spike.
How I built it
Historical Monitor
- Data pull: Download the last month, 3 months or 6 months stock trading data in 1‑hour interval for any ticker you pass in.
- Spike/dip detection: Flags price moves exceeding the configured delta. Supports both absolute and percentage-based change modes.
- Spike explanation: For each spike, craft a time‑stamped query and ask Perplexity for the most relevant answers + URLs (sources).
- Summarise: Compress Perplexity's answer into a short, readable bullet points (powered by gpt-4o)
- Visualize: Plot a “mountain” area chart (Plotly) with:
- Price line & filled area
- Triangles on spikes (up = bullish, down = bearish)
- Hover label containing summary text
- Under each spike an annotation holds up to three “sources” as clickable links for direct access.
- Price line & filled area
- Full explanations: Below the chart, collapsible sections are displayed for each spike, showing the full Perplexity explanation and all source links. These are ordered by spike time.
Live Monitor
- Start time: Begins tracking from midnight UTC of the current day, fetching 1-hour interval historical data from Yahoo Finance to initialize the monitor.
- Live tracking: Continuously monitors 1-hour candles of a specified stock. The tool runs on an hourly schedule, aligned to full UTC hours.
- Every hour:
- Fetches new 1-hour candle(s) since the last update
- Appends data to the historical record and deduplicates
- Detects new volatility spikes based on a user-defined threshold (delta), measured as either percentage or absolute price change
- For each detected spike:
- If already explained → skip
- If not yet explained:
- Generates a time-specific query (e.g., "Why did [TICKER] move sharply around 15:00 UTC?")
- Sends it to the Perplexity Sonar API
- Summarizes the response using GPT‑4o into up to 5 concise bullet points
- Stores source links and explanation details
- Spike/dip detection: Flags price moves exceeding the configured delta. Supports both absolute and percentage-based change modes.
- Explanation + Sentiment: Perplexity provides both a factual explanation and a market sentiment section. The sentiment is shown unaltered (no processing by gpt-4o, Perplexity output is used) in the spike label on the chart.
- Visualize: Updates a dynamic mountain chart (Plotly) showing:
- A filled price line chart with 1-hour granularity
- Triangle markers at spike points (up = bullish, down = bearish)
- Hover tooltips with summarized explanation and market sentiment
- Annotations under each spike with up to 3 clickable sources
- A filled price line chart with 1-hour granularity
- Full explanations: Below the chart, collapsible sections are displayed for each spike, showing the full Perplexity explanation and all source links. These are ordered by spike time.
- Notifications (optional): If enabled, email alerts are sent for each newly explained volatility event.
Challenges I ran into
It was mostly smooth sailing, and I spent time exploring different strategies for displaying Perplexity data in the visualization. There are many interesting ways to approach this.
It would be very helpful if Perplexity provides a built-in highlight or summary attribute (with a customizable max_tokens limit) directly in the API because this would remove the need to call another LLM just to generate a summary.
Accomplishments that I am proud of
I like that I found a way to tightly couple Perplexity with the tools I built, using it not just to retrieve relevant data but as an integrated part of the experience. The original responses and links are preserved and seamlessly embedded.
This enabled:
- Bridging stock price moves and narrative - traders can see what moved and instantly read why, without leaving the chart.
- Interactive experience - works entirely within a Jupyter notebook or Colab, with links that open live articles.
- Full automation - no manual tagging; it runs for any symbol and any recent period.
What I learned
I learned the capabilities of the Sonar API in detail, for example, that it supports parameters like search_recency_filter and search_domain_filter.
What's next for stock-volatility-analyzer
Since hackathons are meant to prove a concept rather than deliver a fully polished product, I believe I’ve achieved my goal.
When it comes to stock trading, there are many analytical perspectives that could benefit from deeper context to support portfolio decisions. Even within volatility itself, the time interval and method of calculation can be adjusted to suit a trader's individual style.
This is an open project that can be further customized by anyone who wants to build on top of it.


Log in or sign up for Devpost to join the conversation.