-
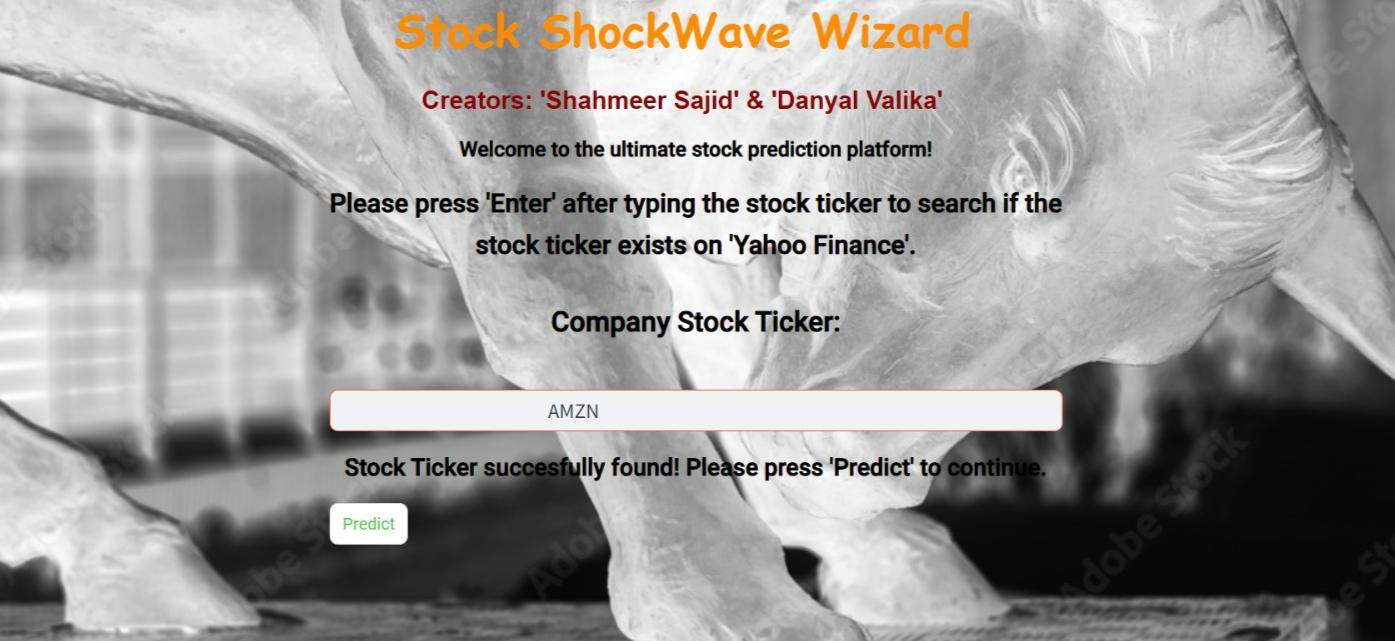
Home Page
-

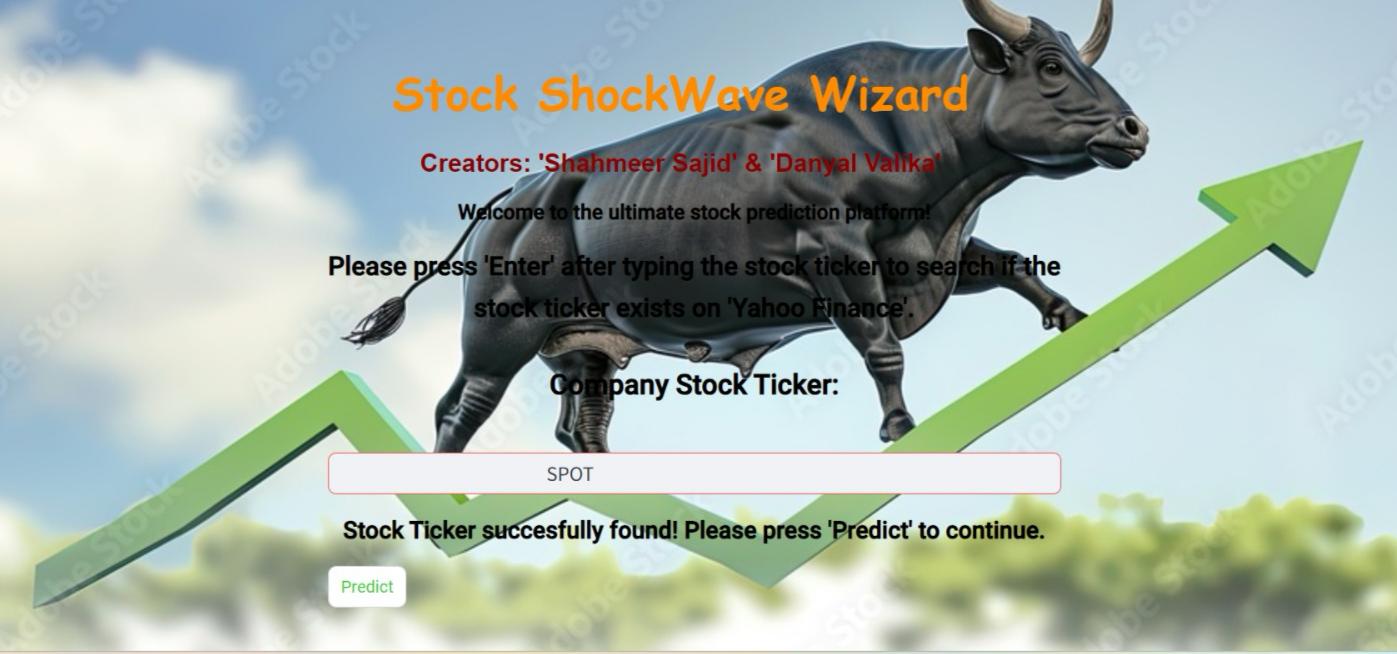
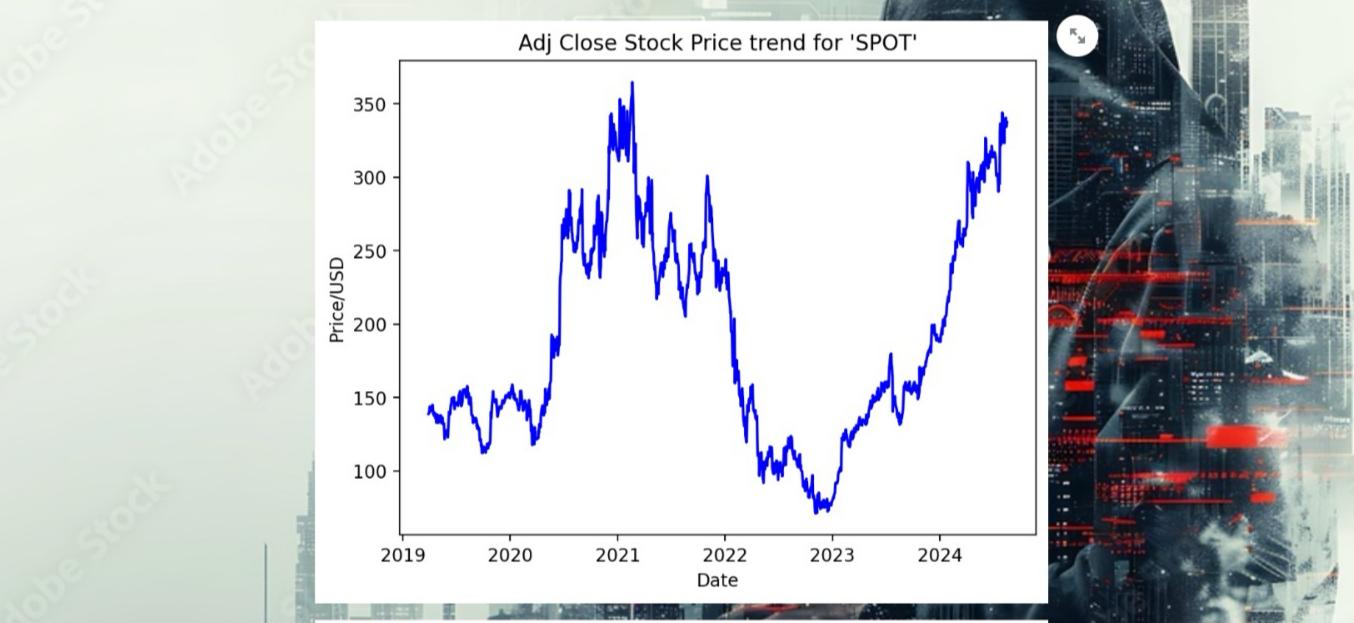
Stock Ticker 'SPOT' Entered
-
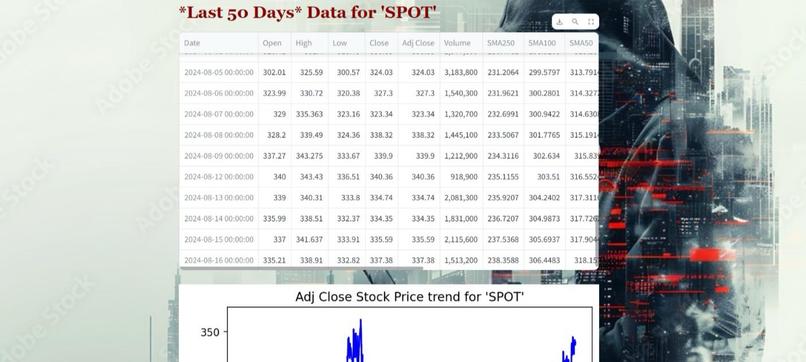
Last 50 Days for 'SPOT'
-
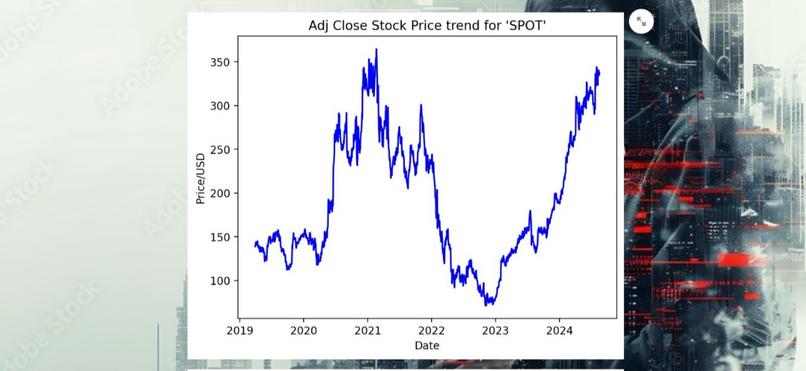
Adjacent Close Prices for 'SPOT' Graph
-

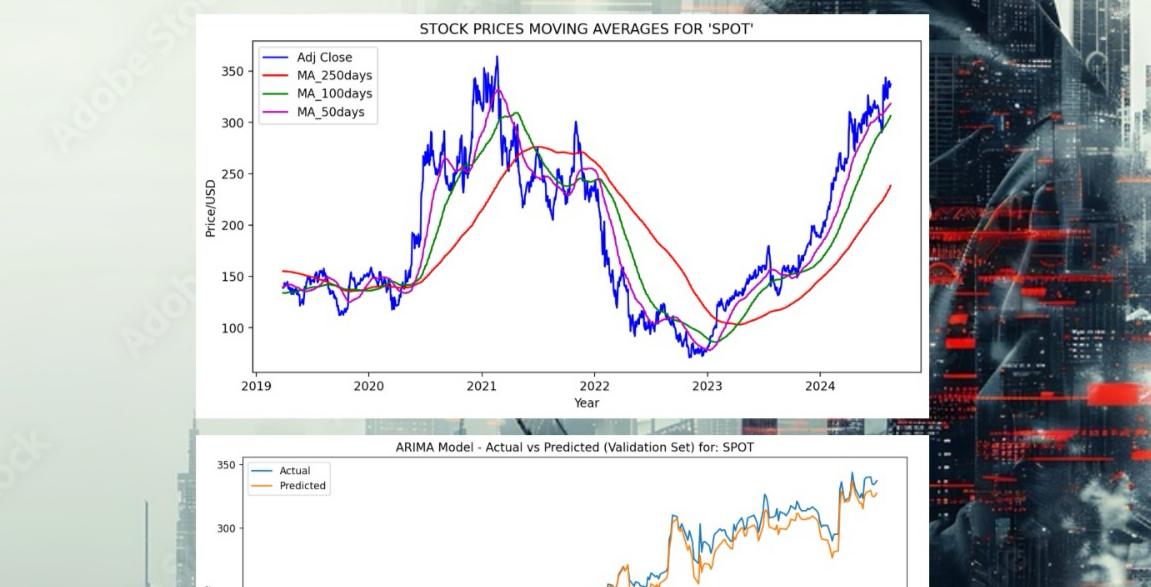
Moving Averages For Analysis Purposes
-

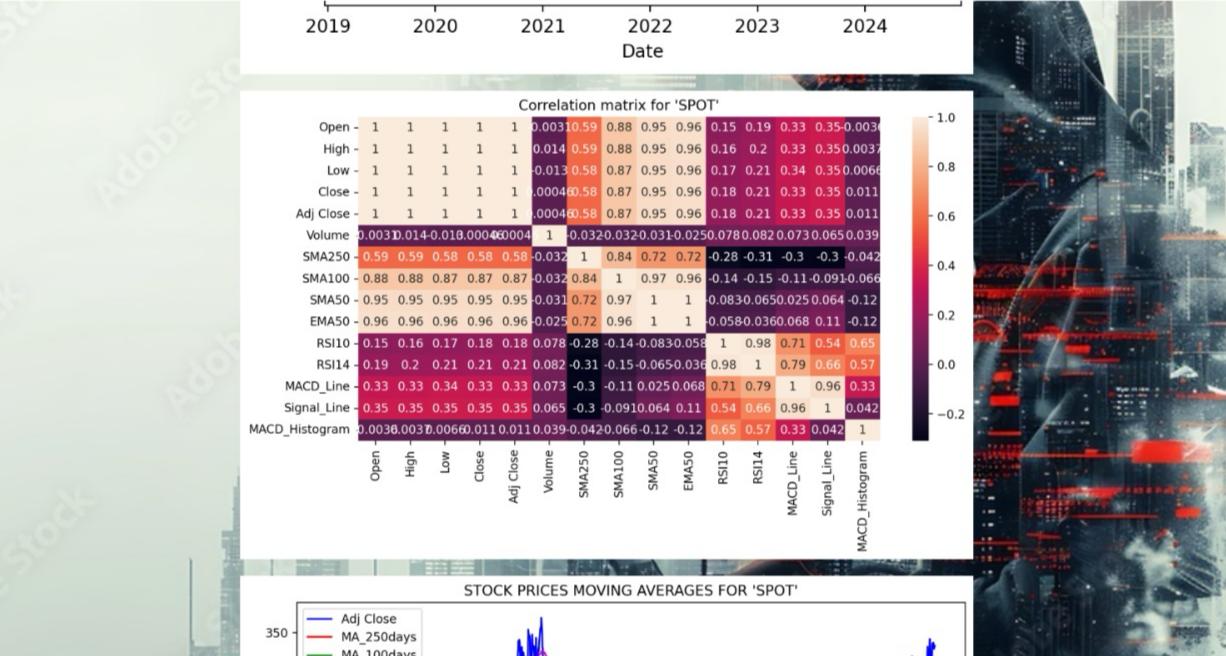
Correlation Matrix for Analysis Purposes
-
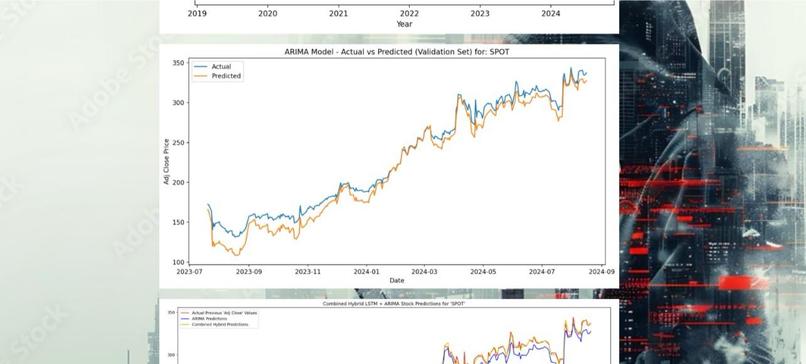
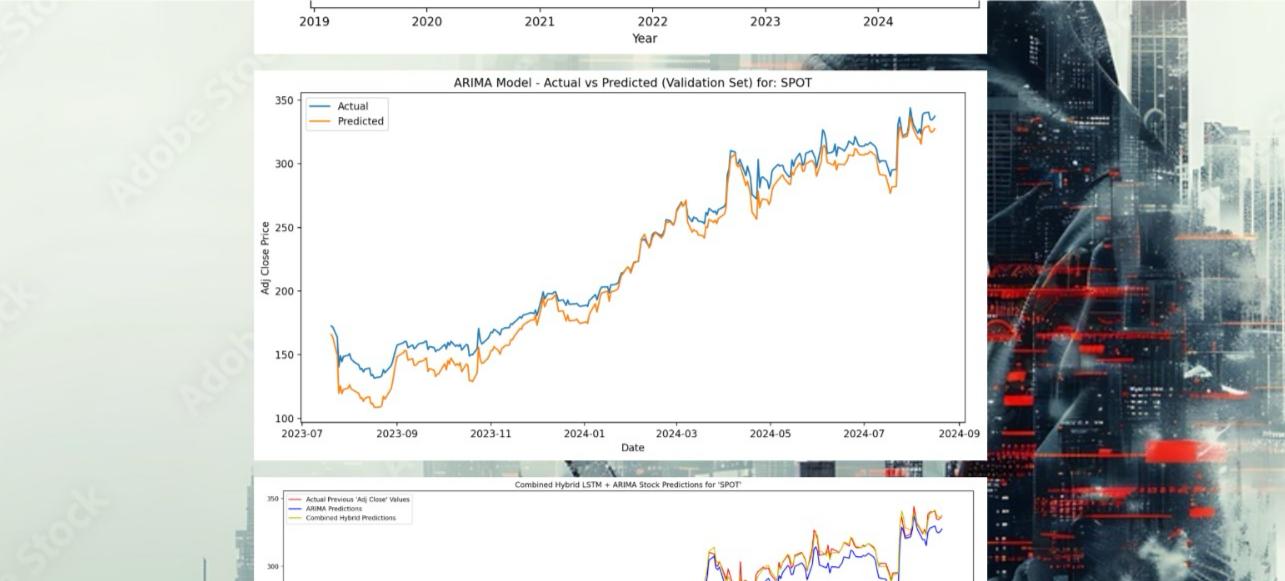
ARIMA Predictions Graph
-

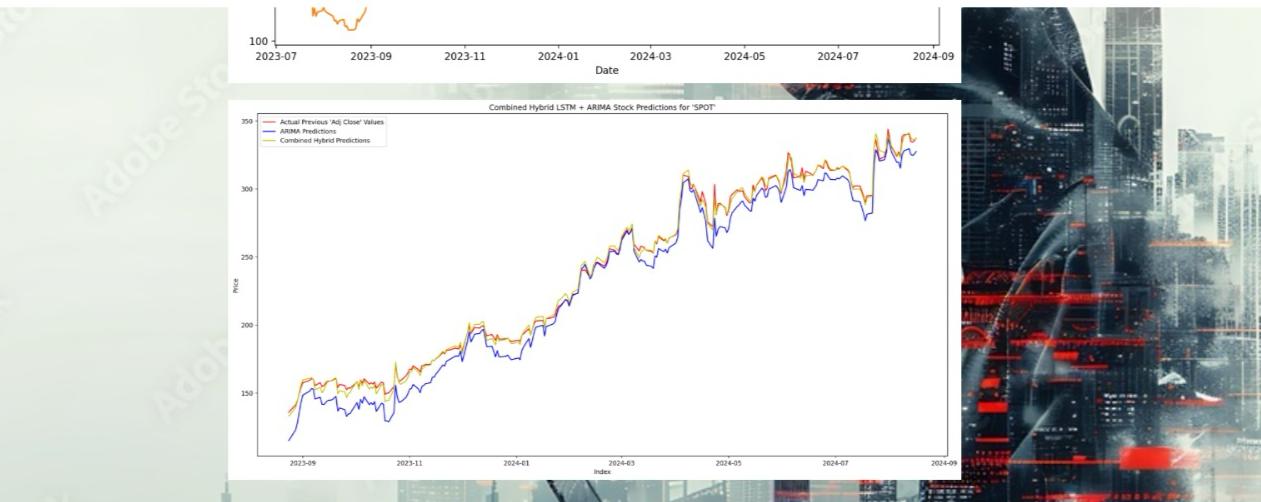
Hybrid Integrated Model Predictions
-

Future 10 Day Predictions for 'SPOT'
-

Invalid Stock Ticker Entered
-

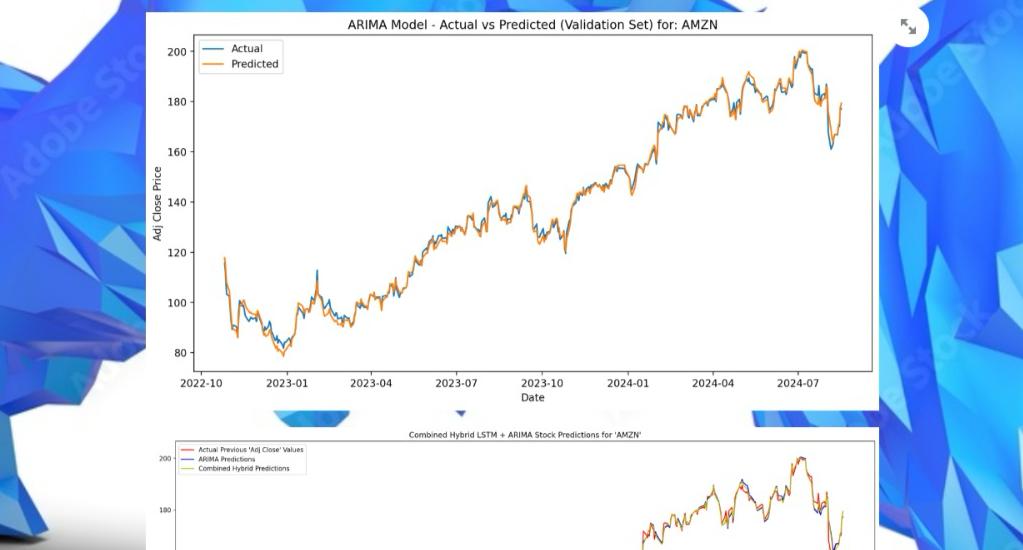
Stock Ticker 'AMZN' Entered
-
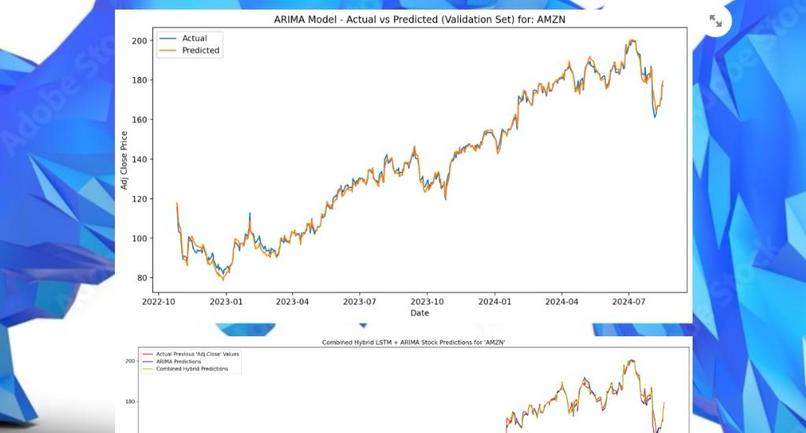
ARIMA Predictions Graph
-

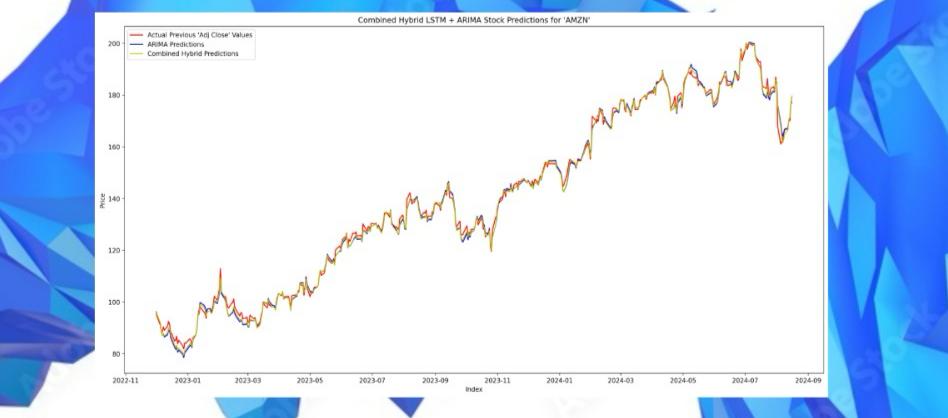
Hybrid Integrated Model Predictions
-

Future 10 Day Predictions for 'AMZN'


Inspiration
The idea for Stock ShockWave Wizard came from the ongoing challenge of predicting stock market trends. With the market’s frequent ups and downs, we wanted to create something that goes beyond guesswork and provides real, dependable insights. Our aim was to add a bit of precision to stock market predictions, without relying on guesswork or unproven methods.
What it does
Stock ShockWave Wizard takes historical stock data and uses it to predict future prices. It processes this data by calculating technical indicators such as SMA, EMA, MACD, and RSI. We then created a hybrid model by combining ARIMA, which is effective for identifying straightforward trends, with LSTM, which excels in recognizing complex patterns.
The process involves first using ARIMA to model the simpler aspects of the data and then obtaining the residuals—essentially the differences between the actual and ARIMA-predicted values. These residuals are then fed into the LSTM model, which handles the more intricate, non-linear patterns. This approach allows us to leverage the strengths of both models, significantly enhancing our evaluation metrics. It’s akin to having a data scientist and a fortune teller working together—only more reliable and far less mystical.
How we built it
We began by collecting stock data using yfinance to provide the foundation for our model. To gain a comprehensive view, we calculated various technical indicators, such as SMA, EMA, MACD, and RSI, and tested different combinations to determine which indicators provided the most value. For making predictions, we combined ARIMA and LSTM models. ARIMA was used to handle linear trends, while LSTM tackled more complex, non-linear patterns. To enhance our model, we fed the residuals from ARIMA into LSTM, which significantly improved our evaluation metrics. This approach allowed us to capture both linear and non-linear trends more effectively.
Tuning the model was a challenge, involving extensive use of GridSearchCV to find the best hyperparameters. It felt like an endless process of "find the right settings," requiring us to try numerous combinations and experiment extensively. We also used the Dickey-Fuller test to check for stationarity in our data, ensuring that our models were built on a solid foundation. Throughout, we spent many hours graphing and analyzing results to understand the model's performance, which often felt like chasing shadows in the quest for optimal accuracy.
Challenges we ran into
One of the most significant challenges was the time-consuming nature of hyperparameter tuning. Running GridSearchCV was akin to watching a pot boil—excruciatingly slow and seemingly never-ending. Integrating ARIMA and LSTM models also presented difficulties. Combining these models was complex, much like trying to mix oil and water, as they each excel in different areas: ARIMA for linear trends and LSTM for non-linear patterns. Ensuring that these two models worked well together required careful balancing and extensive adjustments.
Another challenge was managing the multitude of technical indicators. Initially, we tested numerous indicators, only to find that many were redundant or unnecessary. This process felt like sifting through a lengthy list of options to find the truly valuable ones.
Additionally, handling market closure days when comparing our model’s predictions with actual closing prices added another layer of complexity. We needed to account for these non-trading days to ensure our model’s accuracy and reliability. This task was crucial for maintaining the validity of our performance comparisons.
Accomplishments that we're proud of
We are pleased with our achievement in integrating ARIMA and LSTM models to develop a robust prediction tool. Our Streamlit application has been designed with user experience in mind, ensuring that even those without a technical background can easily obtain valuable insights by simply entering a stock ticker.
We are particularly satisfied with the accuracy of our predictions, which have shown promising evaluation metrics. We hope that this tool will be beneficial for position traders, helping them make more informed decisions and potentially avoid costly mistakes.
What we learned
We learned that hyperparameter tuning is crucial for model performance and can be quite time-consuming. Our experience also showed that using a large number of indicators does not always lead to better accuracy. Instead, carefully selecting and integrating the right indicators is more effective.
The process of combining ARIMA and LSTM models proved to be challenging, emphasizing the importance of a well-structured project flow. Working with time series data was particularly intriguing and required us to grasp its fundamentals to effectively implement LSTM.
This journey also introduced us to various stock indicators and provided a deeper understanding of market dynamics.
What's next for Stock ShockWave Wizard
Looking ahead, we could continue to fine-tune the model to potentially improve prediction accuracy. There’s also the possibility of extending our approach to other financial markets, such as forex, which could broaden the tool’s applicability. Additionally, exploring advanced front-end development techniques might offer opportunities to enhance the user interface and overall user experience, making the tool even more intuitive and accessible.
Built With
- arima
- dickeyfullertest
- lstm
- matplotlib
- numpy
- pandas
- python
- scikit-learn
- seaborn
- streamlit
- tensorflow
- timeseriesanalysis
- yfinance

Log in or sign up for Devpost to join the conversation.