-
-

Welcome page with log in and register options, along with functionalities description upon scrolling.
-
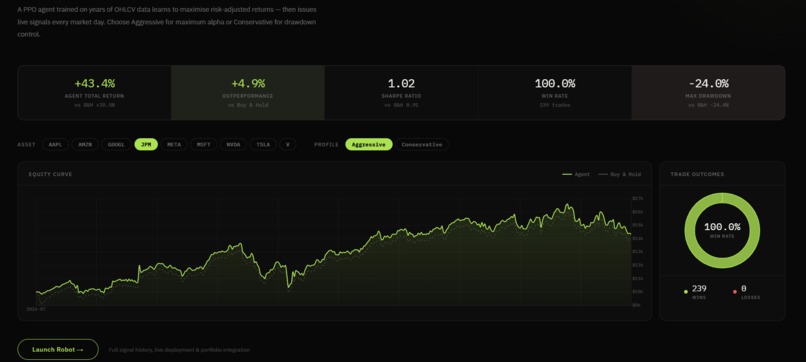
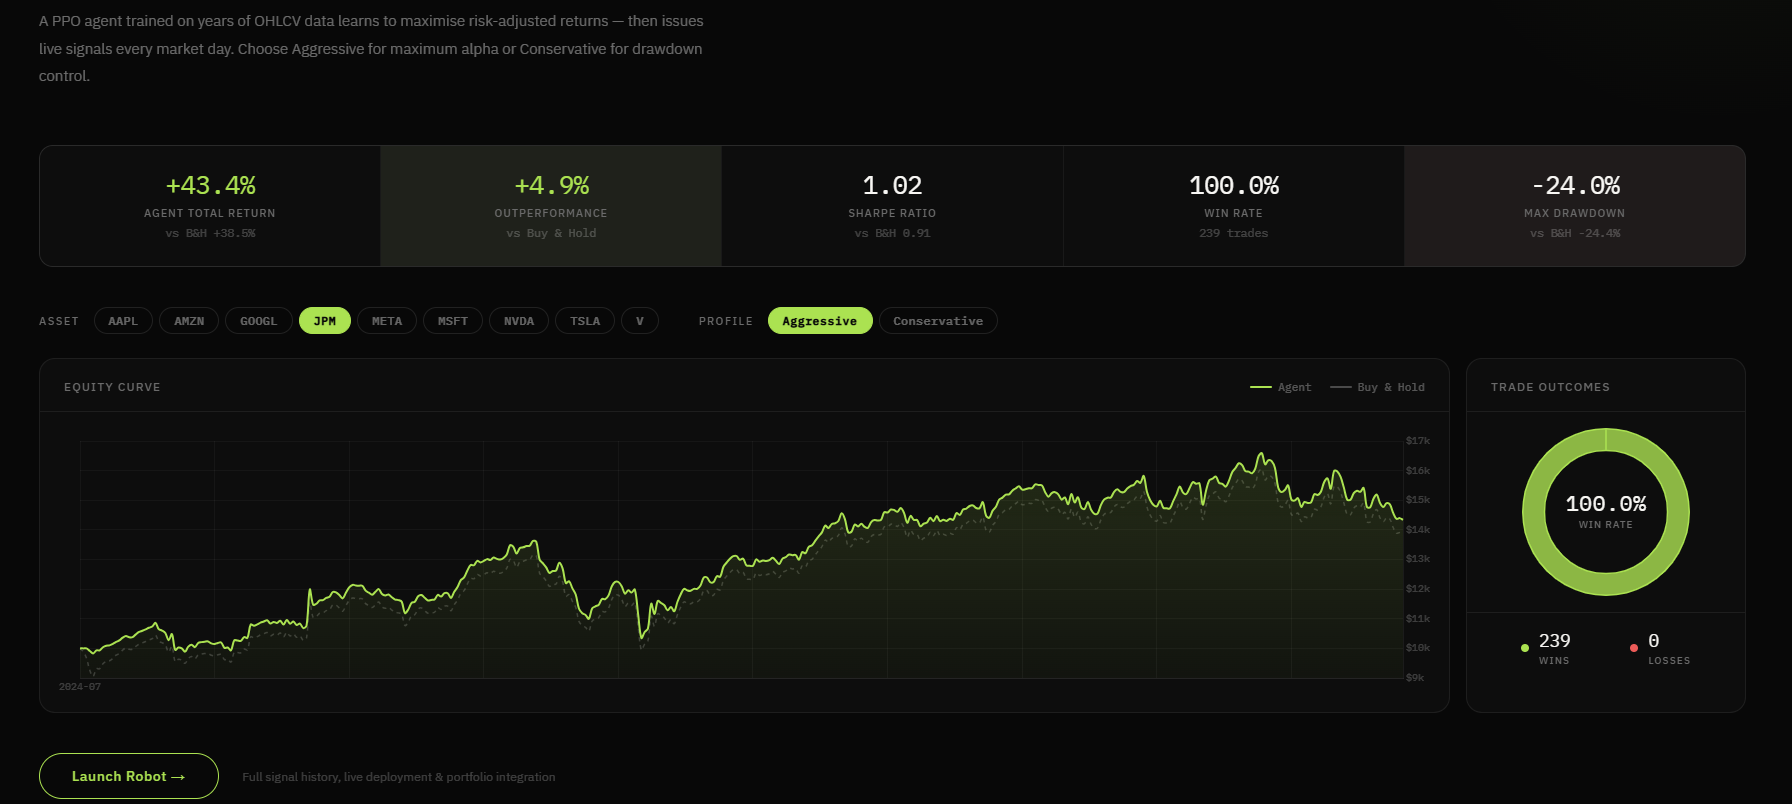
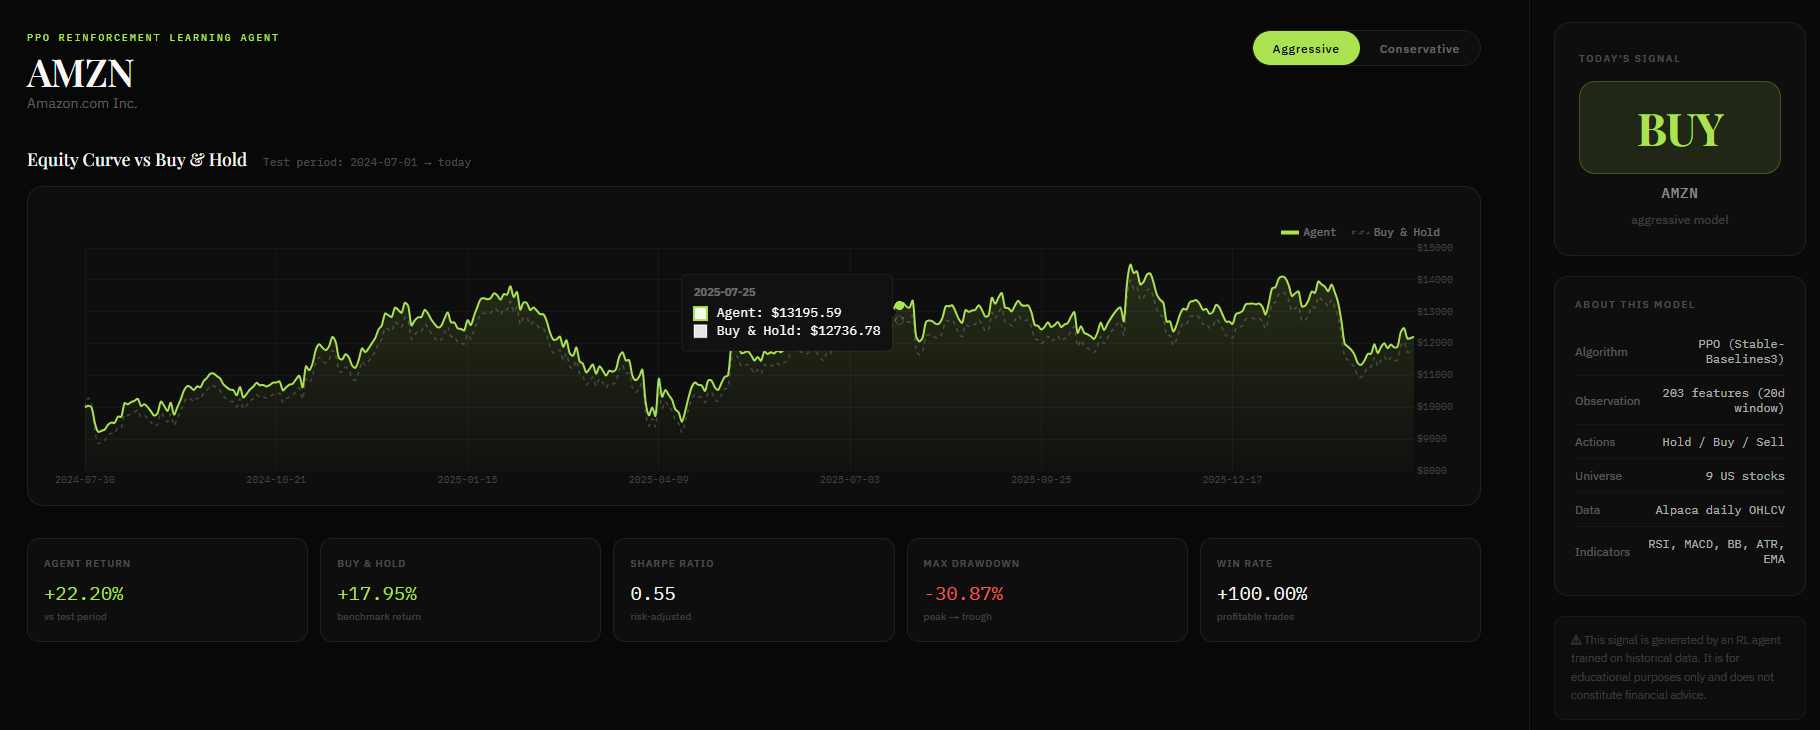
AI Agent proposed strategy performance metrics on historical data with regard to the 'Buy and hold' strategy.
-
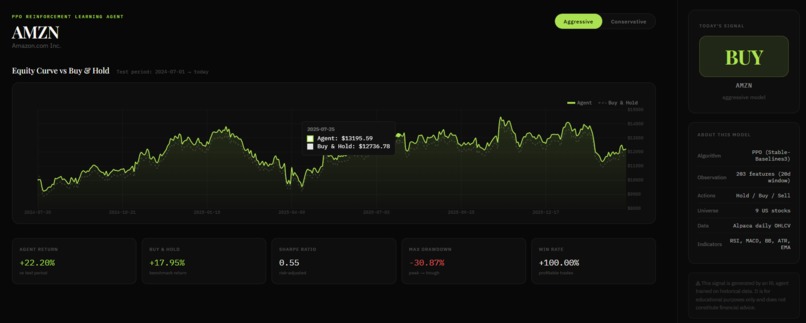
AI Agent Strategy suggestion along with its technical details and evaluation metrics to provide full transparency and reliability.
-
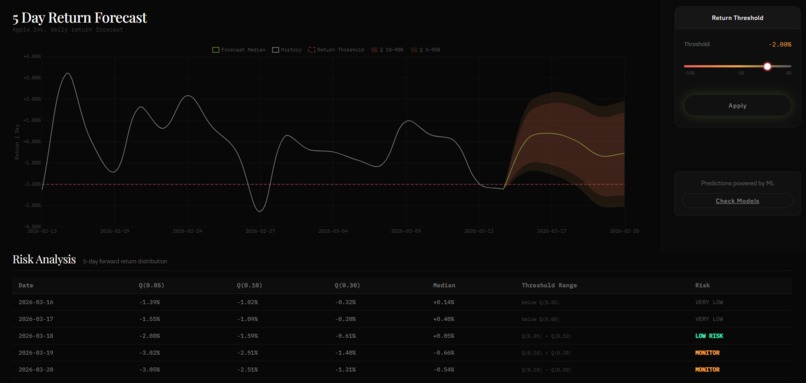
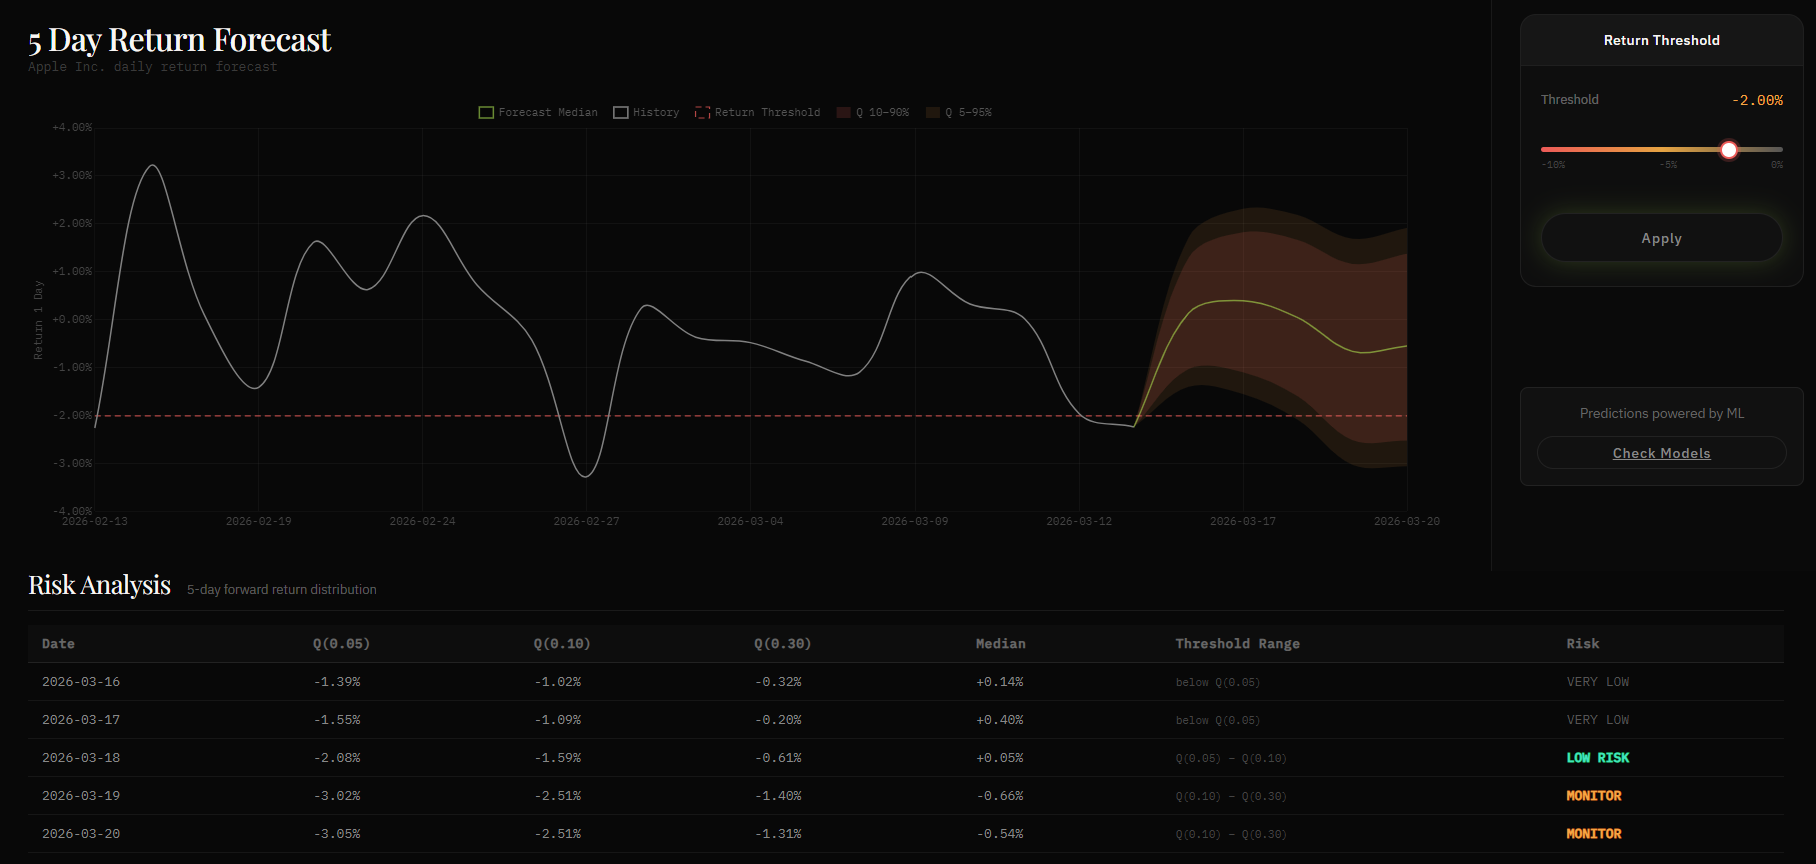
5 Day forecasting plot visualizing the probabilistic predictions of daily returns generated by the final ML model along with risk alerts.
-
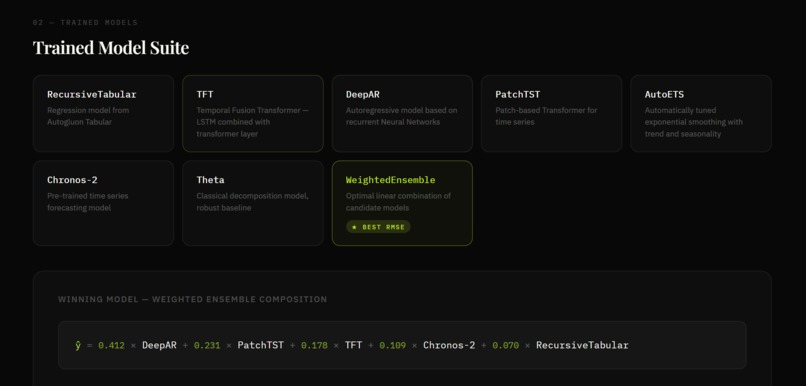
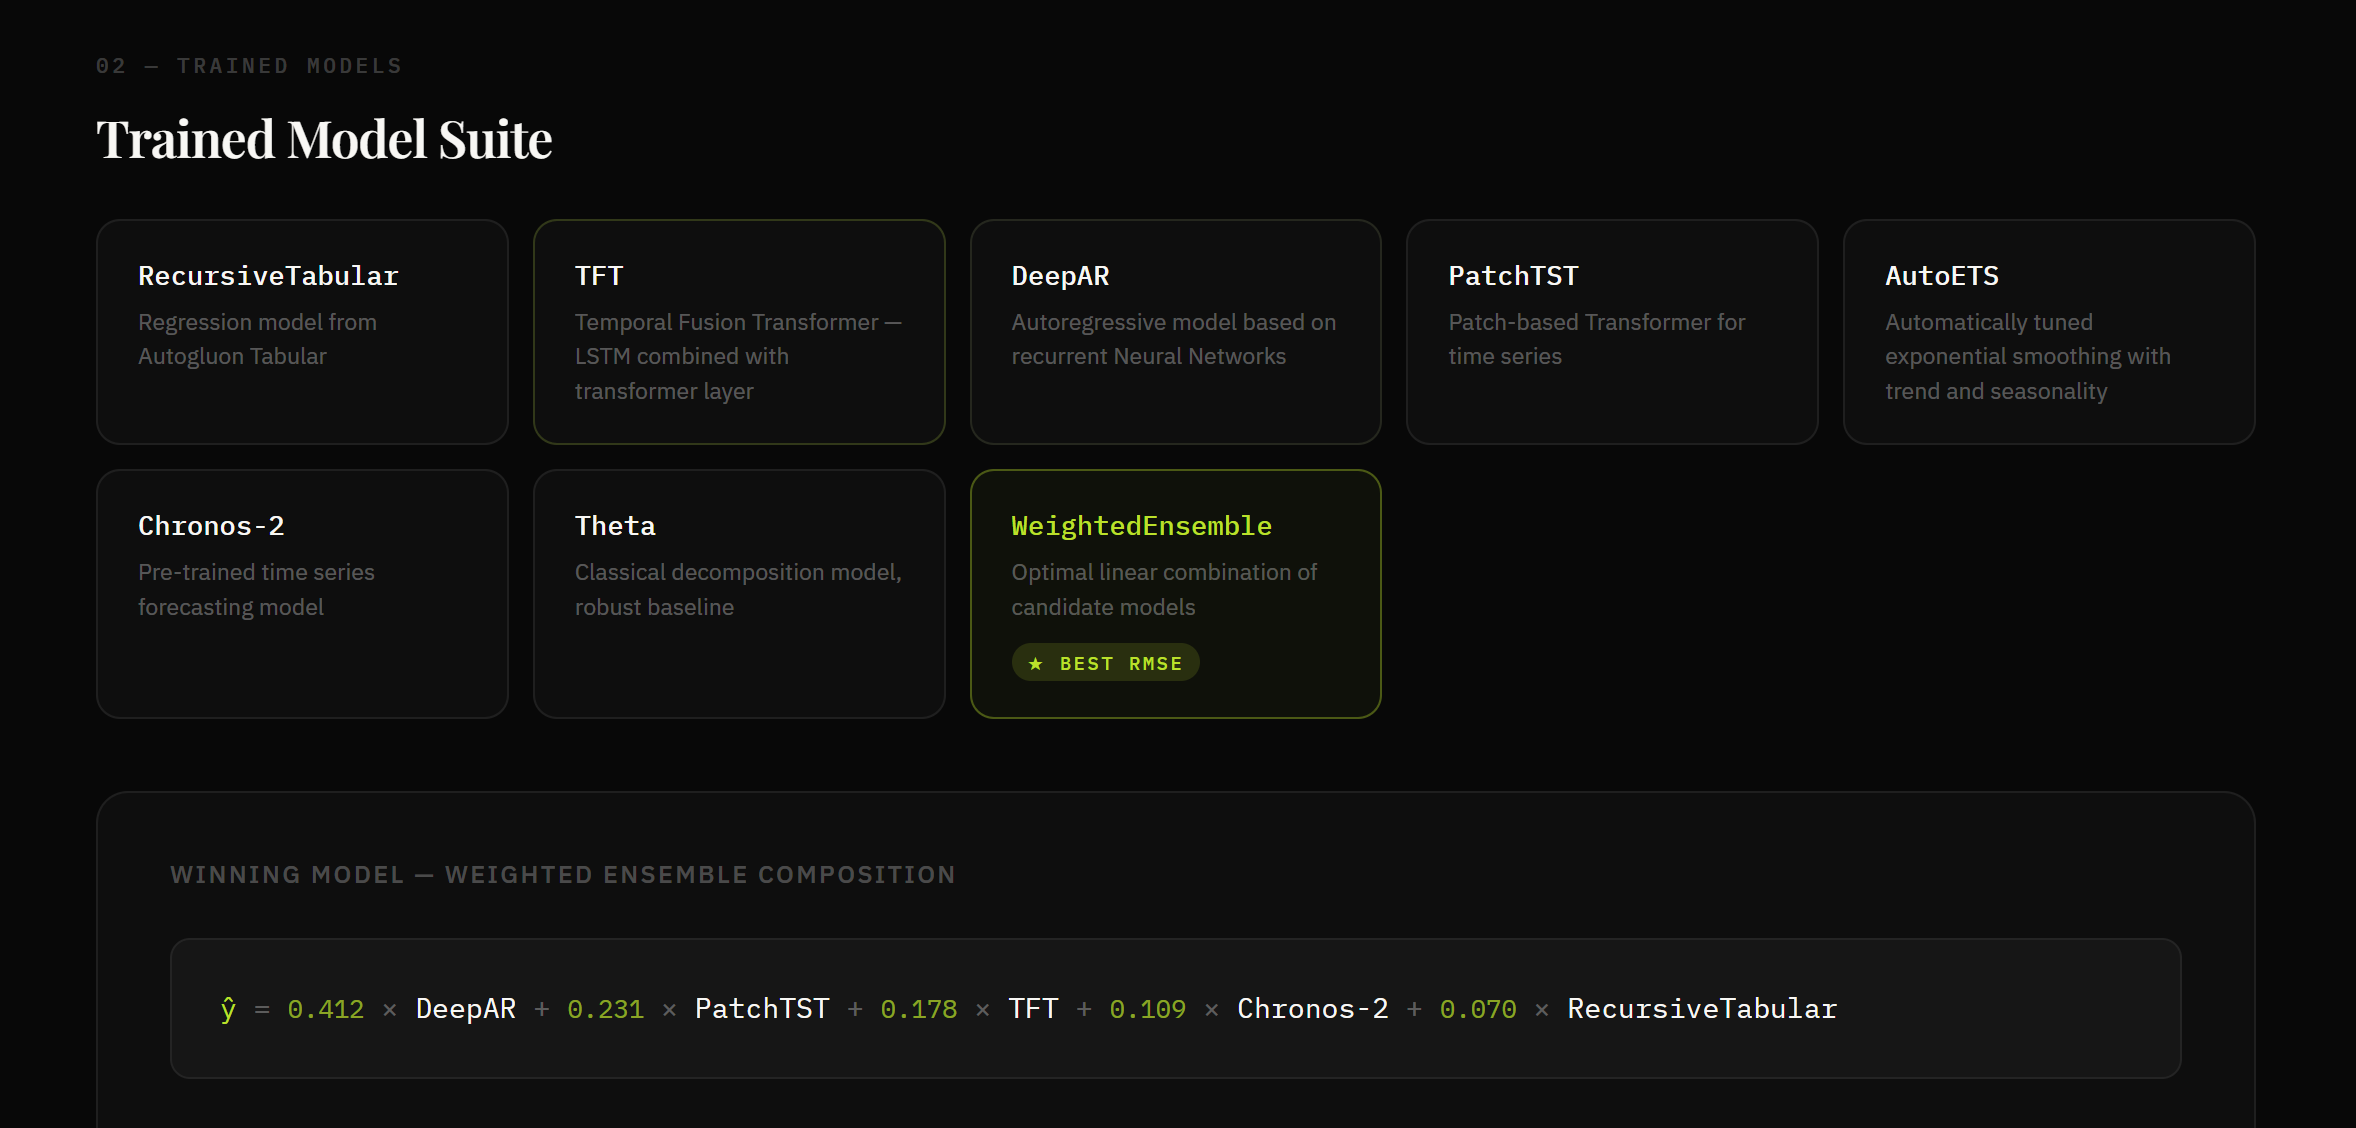
ML Models evaluation page where users can find details about forecasting ML models that are used to generate 5 day predictions.
-
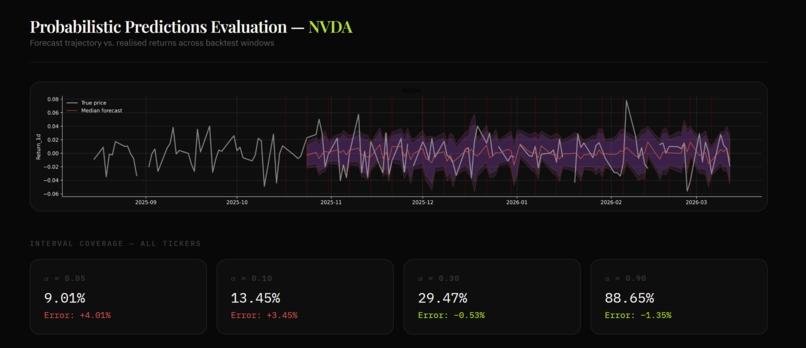
Backtest results page illustrating how the model performed during backtesting. Covers point and probabilistic predictions for each ticker.
-
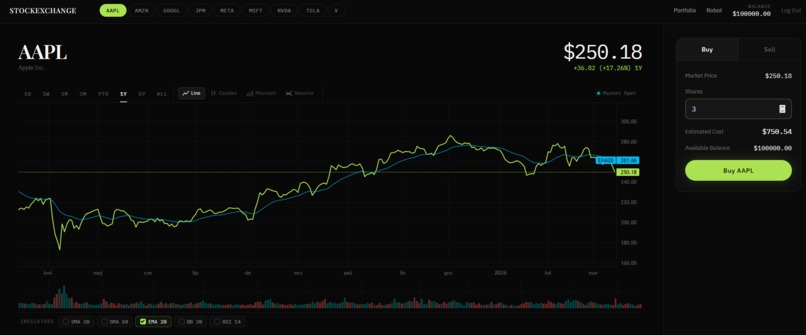
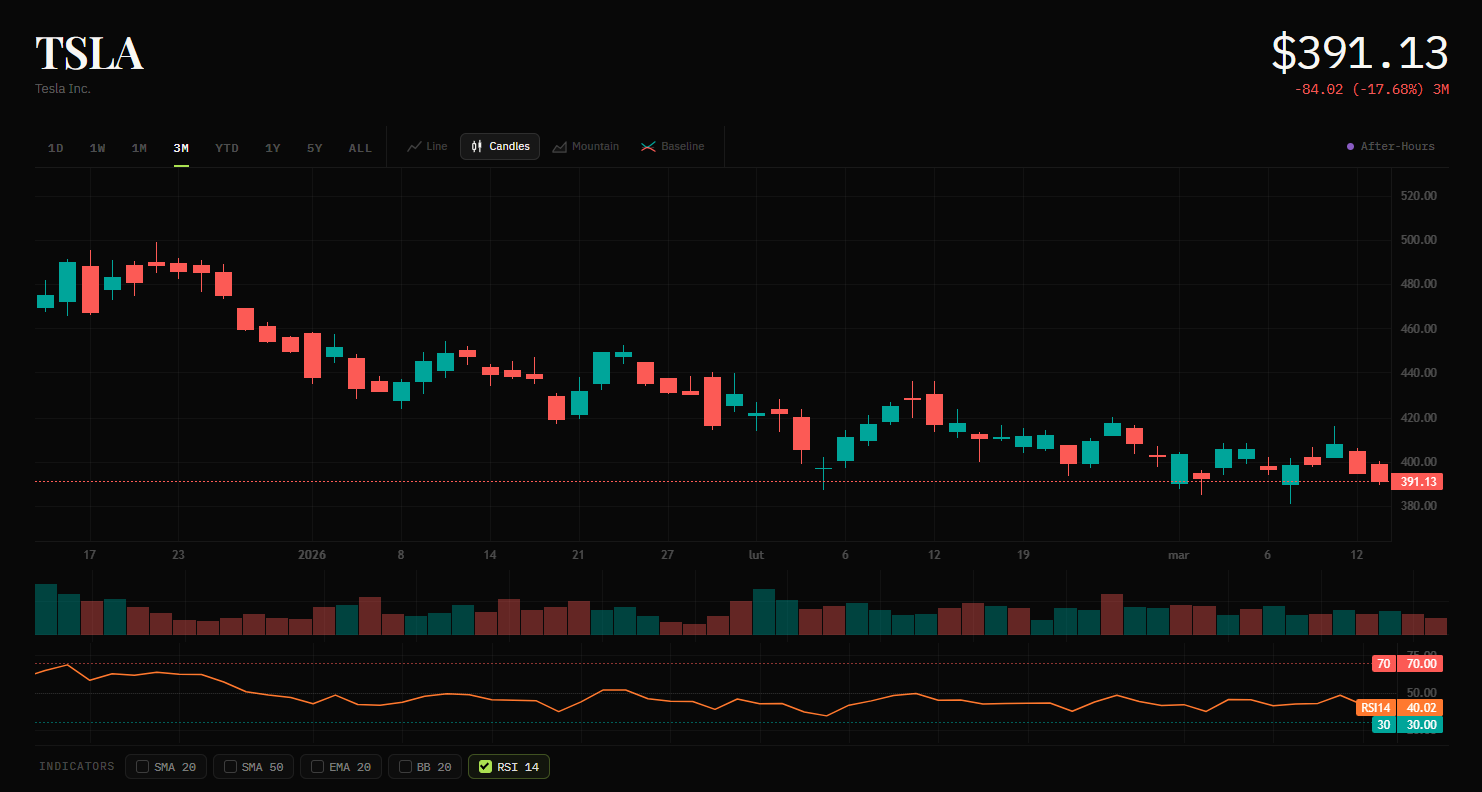
Price and other financial indicators analysis plot enabling interactive analysis of the selected ticker.
-
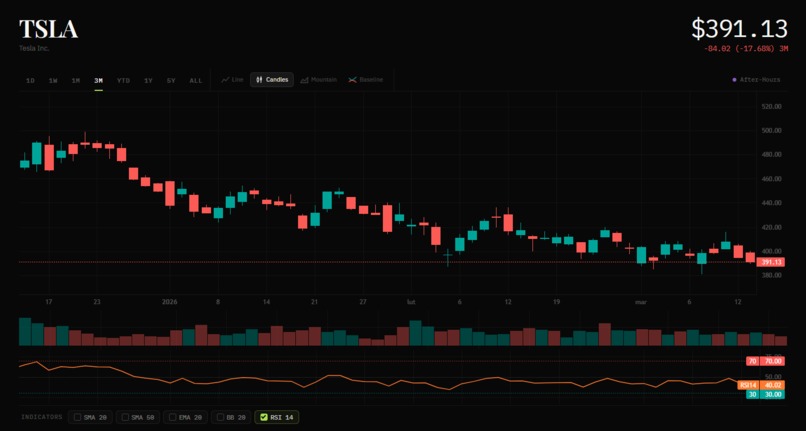
Price analysis using the selected horizon, frequency and candles plot type along with the calculated RSI indicator for Tesla.
-

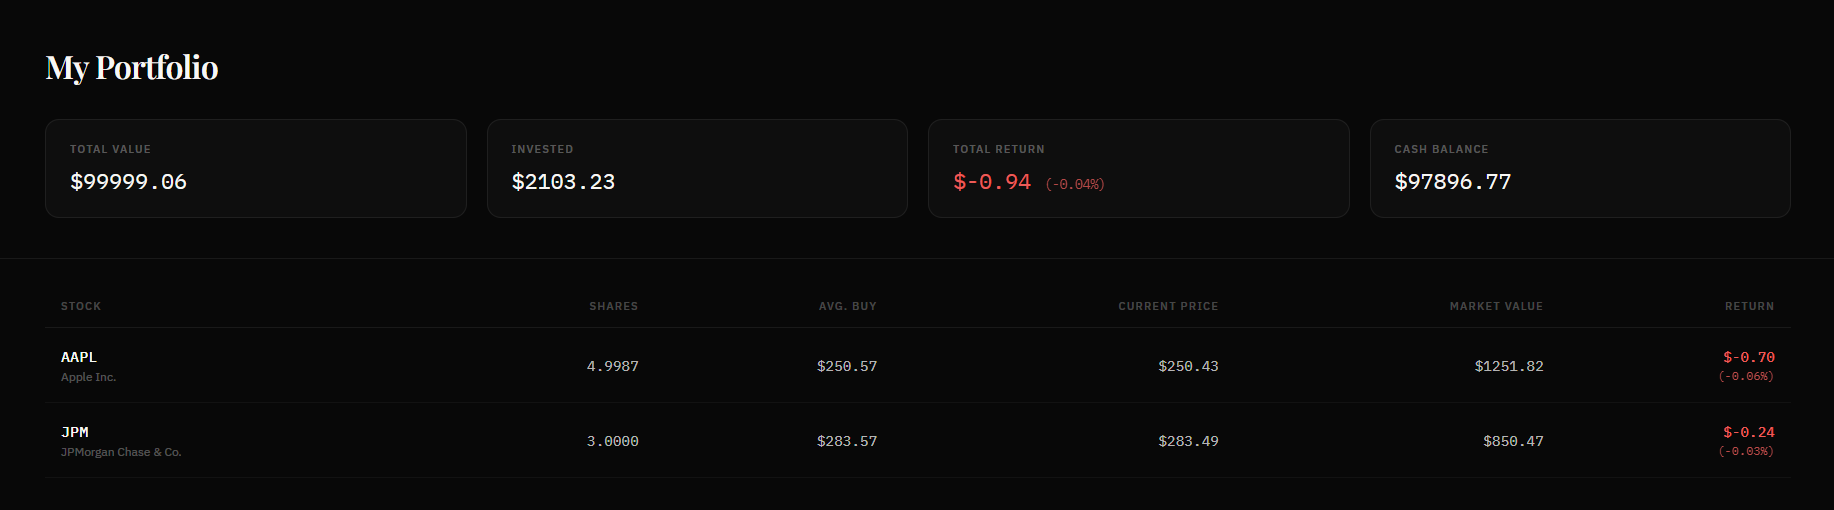
Trading simulation portfolio with the current return and bought assets. It enables experimentation with trading strategy without real money.
-

Log in page with an option to create a new account or save credentials.


Inspiration
Stock market data is one of the most challenging types of real-time data due to its high level of noise and unpredictable movements. As a result, predicting its behavior can be difficult, time-consuming, and often requires expert knowledge. We aimed to address these challenges by incorporating AI agents, deep learning, and statistical models to generate accurate predictions without the need for manual market analysis. Our goal was to learn more about feature engineering for financial time series data, experiment with various types of models and select the best-performing ones, and finally create a comprehensive, user-friendly application that enables experimentation, custom parameter settings, and exploration of different investment strategies.
What it does
We developed a comprehensive web application featuring the following key functionalities:
Stock Price Analysis
Interactive charts allow users to explore stock prices and financial indicators across multiple timeframes, ranging from 1 day to 5 years. The current price is displayed precisely, and returns are highlighted for quick insights.
Trading simulation
Upon creating an account, each user receives virtual credit to experiment with various trading strategies using real-world NYSE data. Users can buy and sell assets while tracking their account performance in real time.
Market Forecasting
For every ticker, we implemented a machine learning model that predicts daily returns over a 5-day horizon. Users can analyze forecasts for upcoming business days, helping them make informed trading decisions. Predictions are presented as the median expected return, accompanied by quantiles to clearly communicate the uncertainty of the forecast.
Customized Alerts
Users can define a minimum acceptable return for the coming days. An interactive slider lets them visualize predictions relative to this threshold. If the predicted return falls below the set limit, a “High Risk” alert is displayed. Additionally, risk levels are continuously monitored across all five forecasted days using quantile distributions.
Trading Bot
AI Agent that autonomously decides whether to buy, hold, or sell a given stock each trading day. Users deploy it with a custom budget and it executes trades independently every day at market close, updating their demo portfolio automatically.
Models overview
To ensure full transparency and reliability, users can visit the Model Overview page to explore the machine learning models used for predictions. The page provides backtesting results and probabilistic evaluation scores, allowing users to assess the confidence and accuracy of the model's forecasts.
How we built it
We developed our web application using Django, with custom HTML and CSS for frontend design, and Python scripts integrated with various libraries such as Autogluon, Stable-Baselines3, Pandas, Numpy, and more. The development process can be described in the following steps:
Fetching real-time market data
We used the Alpaca API to fetch real-world data for 9 selected tickers, including Apple, Alphabet (Google), and Tesla. The end date was set to the latest available timestamp to ensure the most recent updates. The returned dataset included columns such as timestamp, open, close, low, high, and volume.
Feature engineering
Next, we performed feature engineering to extract additional insights about risk, volatility, and market patterns. We created various lagged features representing prices and volume from the past 1, 2, 5, and 30 days. We also calculated rolling averages, skewness, RSI, SMA, EMA, BB, Z-Score, and the direction of returns. These additional features served two purposes:
- They could be visualized in plots to enable exploratory analysis.
- They provided enriched input for training machine learning models.
Plotting Stock prices and other indicators
Using custom JavaScript, Plotly and Django backend endpoints, we created interactive plots that visualize both historical and real-time prices for selected tickers, along with technical indicators such as SMA, EMA, Bollinger Bands (BB), and RSI.
Trading Simulator
Each user receives a virtual dollar balance and can trade all 9 supported stocks without risking real capital. All prices come from Alpaca Markets and reflect real market data.
Stock Chart
The trading page is built around a professional-grade interactive chart with the following options:
Chart types — the user can switch between four display modes:
- Line — a simple closing price line, colour-coded green or red based on the period's direction
- Candlestick — full OHLC candles with green/red colouring
- Mountain — a filled area chart below the closing price line
- Baseline — a dual-coloured chart that splits above and below a user-defined baseline price; the baseline can be dragged up and down directly on the chart
Timeframes — 1D (5-minute bars), 1W (hourly), 1M, 3M, YTD, 1Y, 5Y, and ALL. Scrolling to the left edge of the chart automatically loads older data. For the 5Y and ALL timeframes, the data is served from pre-downloaded Parquet files to work around Alpaca's IEX history limit.
Technical indicators — overlaid on the main chart:
- SMA 20 and SMA 50 (simple moving averages)
- EMA 20 (exponential moving average)
- Bollinger Bands (20-period, ±2σ)
RSI panel — a separate sub-chart below the volume bars showing the 14-period Relative Strength Index with overbought (70) and oversold (30) reference lines.
Volume bars — synchronised with the main chart (scroll and zoom are locked together), colour-coded teal for up-days and red for down-days.
A market status indicator in the header shows whether the US market is currently Pre-Market, Open, After-Hours, or Closed, updating every minute based on Eastern Time.
Order Panel
The order panel on the right side of the trading page lets the user place simulated Buy and Sell orders:
- Buy — enter the number of shares or a dollar amount; the estimated total is shown before confirmation; the order is validated against the user's current virtual balance
- Sell — only available when the user holds a position in that stock; shows the current number of shares held, average buy price, unrealised P&L, and percentage return on the position
After executing an order, the balance, position size, and unrealised P&L update immediately on the page.
Training and evaluating ML models for forecasting
After preparing the dataset, we experimented with various models, including Random Forests, XGBoost, and LightGBM, trained to predict both closing prices and returns using different training techniques, such as rolling and expanding windows. Model performance was initially evaluated using a backtesting method. Since these popular models struggled to capture the complex patterns inherent in stock market data, we explored more advanced models using the AutoGluon TimeSeries module with different presets, parameters, and evaluation metrics. The models trained in these experiments included:
Statistical models such as ETS and Theta
Neural network-based autoregressive models
Temporal Fusion Transformers (TFT)
Pre-trained Chronos2 AutoGluon models
The best-performing model was a weighted ensemble of DeepAR, PatchTST, TFT, Chronos2, and Recursive Tabular models from AutoGluon. As AutoGluon time series models generate probabilistic predictions, we evaluated them on two levels:
Point estimation using metrics such as RMSE and MASE
Quantile-level evaluation using metrics such as WQL, Winkler Score, and Quantile Coverage
Additionally, we measured the hit ratio, defined as the number of days when the model correctly predicted the direction of the return (profit or loss). All metrics were calculated based on 20 backtesting windows and averaged for each ticker. The final model achieved MASE < 1.0 for all tickers, indicating better performance than a naive baseline. Moreover, all hit ratios exceeded 50%, demonstrating that the model predicted return directions better than random guessing. A detailed analysis of all metrics is available on our website.
Finally, we created an interactive plot using JavaScript that visualizes historical prices, forecasted values, and quantile bands for the next five days. The plot is powered by the saved AutoGluon predictor, which provides both point estimates and multiple quantiles for risk-aware forecasting. In addition, we developed backend scripts to perform automated backtesting of the models and to save evaluation metrics—including RMSE, MASE, Winkler Score, Quantile Coverage, and hit ratios—into CSV files. These metrics are then displayed in the application, ensuring transparency, reliability, and enabling users to assess model performance over multiple tickers.
Customized alerts
Along with return predictions, we implemented a customizable threshold for the minimum return that users are willing to accept. Based on the quantile-level predictions from the forecasting model, we classify risk levels as follows:
Threshold below Q0.05 – Very low risk
Threshold between Q0.05 and Q0.1 – Low risk
Threshold between Q0.1 and Q0.3 – Monitor
Threshold above Q0.3 – High risk
All five forecasting days are analyzed, and the risk estimation is presented in a table alongside the precise quantile values.
AI Agent - investment robot
The robot is trained using the Proximal Policy Optimization algorithm (Stable-Baselines3) and makes Buy / Hold / Sell decisions based on the current market state. It operates on two risk profiles that reflect different trading personalities:
- Aggressive — larger position sizes, higher trading frequency, higher potential returns but also higher volatility and drawdown
- Conservative — smaller positions, fewer entries, prioritises capital preservation and lower drawdown over maximising returns
Today's Signal
After selecting a ticker and a risk profile, the robot replays the full historical market data to reconstruct the current market state, then issues a single signal for today: BUY, HOLD, or SELL. The signal is displayed as a prominent badge alongside the active risk profile label.
Backtest
Beyond the daily signal, the robot page runs a full backtest episode — the agent steps through the entire historical dataset and trades autonomously. The results are presented in two ways:
Equity curve chart — an interactive line chart showing the agent's portfolio value (starting from $10,000) plotted against a passive Buy & Hold strategy over the same period. The agent's line is colour-coded green when it finishes above B&H and red when it underperforms. Both series share a crosshair tooltip showing the exact dollar value on any given date.
Performance metrics panel — a set of key statistics shown side by side with their B&H equivalents:
| Metric | Description |
|---|---|
| Total Return % | Cumulative return of the agent over the full episode |
| B&H Return % | Return of a passive buy-and-hold strategy over the same period |
| Outperform % | Agent's return minus B&H return — how much alpha was generated |
| Sharpe Ratio | Risk-adjusted return (agent vs B&H) |
| Max Drawdown % | Largest peak-to-trough decline during the episode |
| Win Rate % | Percentage of closed round-trip trades that were profitable |
| Trades | Total number of completed Buy→Sell round-trips |
Trade log table — a full breakdown of every round-trip trade in the backtest, with columns for buy date, sell date, number of shares, buy price, sell price, P&L per trade, and portfolio net worth at the time of the sell. Open positions (bought but not yet sold by the end of the episode) are flagged with an "Open" badge and show the current price as the reference exit.
Deploying the Robot
On the robot page the user can deploy the agent to trade live on their paper account. Before deploying, the user sets a budget (minimum $100) — the portion of the virtual balance allocated to this robot session. Once deployed, a green status dot appears alongside the active profile and budget. The robot can be stopped at any time, which closes the session and returns control to the user. Each ticker has its own independent session, so multiple robots can run simultaneously on different stocks.
Challenges we ran into
The main challanges that we faced during the development process:
Selection of the data platform - For the final project, we used the Alpaca API to access official stock market data. However, it imposed a limitation on the number of API calls, which significantly reduced the size of the training set for our ML models. Prior to that, we experimented with the yfinance package, but its data, obtained through web scraping, was less reliable than Alpaca.
Irregular frequency of stock market data - The data is available only for business days and often excludes public holidays, creating additional challenges for ML algorithms that require consistent time series input.
Time series ML model selection - Finding the right model to capture meaningful patterns and deliver accurate predictions required extensive experimentation. We tested Gradient Boosting Models, Random Forests with parameter tuning, and various AutoML models before achieving satisfactory results.
Methodology and workflow - We explored multiple feature engineering strategies, target definitions, and training techniques such as Rolling Window and Expanding Window approaches, along with different AutoML configurations and evaluation metrics, until our models produced reliable and satisfactory predictions.
Accomplishments that we're proud of
We developed a multifunctional application designed to support experimentation with trading, decision-making, and market forecasting without involving real money. Our platform allows users, even without prior expert knowledge, to explore financial indicators, trading strategies, and historical patterns in real-world stock data. Moreover, we integrated machine learning and AI models to assist the decision-making process from both forecasting and strategic perspectives. We are proud of the wide range of functionalities consolidated into a single, comprehensive system, capable of meeting the needs of diverse users.
Throughout the development process, we also expanded our understanding of the financial sector, advanced models, transformers, and trading agents—their capabilities as well as their limitations. Our application introduces a novel approach to trading, enabling users to test strategies safely before committing real funds, balancing experimentation with caution while avoiding costly losses.
What we learned
During this project, we significantly expanded our knowledge of computer modeling and analysis of financial data. We gained hands-on experience working with time series data and explored a variety of relevant features that can be engineered when handling market data, including lagged returns, rolling statistics, and technical indicators.
We also discovered new machine learning techniques, experimenting with different model training approaches such as rolling and expanding windows, and explored advanced models that we had never used before, including Temporal Fusion Transformers, DeepAR, PatchTST, and ensemble methods. This gave us insight into the strengths and weaknesses of various algorithms when applied to noisy financial time series.
In addition, we developed an AI agent using reinforcement learning, a completely new area for us, which allowed us to experiment with decision-making strategies in a simulated trading environment. This exposed us to practical challenges in reinforcement learning, such as reward shaping, exploration-exploitation trade-offs, and model stability.
We also learned about different investment strategies and approaches to applying forecasts, from conservative to aggressive, and how model predictions and quantile distributions can be used to inform risk-aware decisions.
On the technical side, we became proficient with new Python libraries such as AutoGluon for time series forecasting and Stable-Baselines3 for reinforcement learning. We also gained experience in building interactive, user-friendly web applications with the Django framework, integrating real-time data, visualizations, and ML-powered insights.
Finally, this project taught us about the limitations and opportunities of working with noisy financial data, best practices for model evaluation, and the practical considerations for deploying AI-driven tools for decision support in trading.
What's next for Stock Market Forecasing with Machine Learning and Agentic AI
In the future, we plan to expand the application by incorporating the following functionalities:
Increasing the number of available tickers to give users access to a broader set of real-world stocks.
Adding additional financial indicators that can be visualized alongside stock prices, providing deeper insights for analysis.
Developing more precise forecasting models and supporting multiple prediction targets, such as closing prices, low prices, or other key metrics.
Continuously improving the AI agent to suggest increasingly effective strategic decisions and trading actions.
Allowing users to select the ML model used for predictions, giving advanced users more flexibility and control over forecasting strategies.
Built With
- alpaca
- autogluon
- css
- django
- html
- javascript
- matplotlib
- numpy
- pandas
- python
- pytorch
- reinforcement-learning
- scikit-learn
- stable-baseline3
- transformers

Log in or sign up for Devpost to join the conversation.