
Inspiration
Our team's ideation for the Stock Market Delusion Calculator (SMDC) began as a risk mitigation tool. Initially, we explored various degrees of the efficient market hypothesis, wherein arbitrage opportunities seldom present themselves in markets with a high degree of communication between academia and large market players. Indeed, the distinct lack of PhDs at hedge funds in developing markets creates opportunities to employ algorithmic strategies that no longer generate significant alpha in U.S. markets. Notable strategies include the Piotroski F-score and momentum trading, which served as the intuition behind our model's decisions.
However, as the name suggests, the Stock Market Delusion Calculator is not a trading tool. Instead of focusing on generating profits, the SMDC provides stronger insights into abnormal market behavior that could be harmful to hedging positions. The meme-stock revolution of 2020 shifted the status quo of short-squeeze risk and exposed a glaring weakness in hedge fund decision analytics. Fundamental traders often fail to account for the behavior of non-institutional agents. While firms have begun incorporating sentiment analysis into their strategies, significant room for improvement remains.
What it does
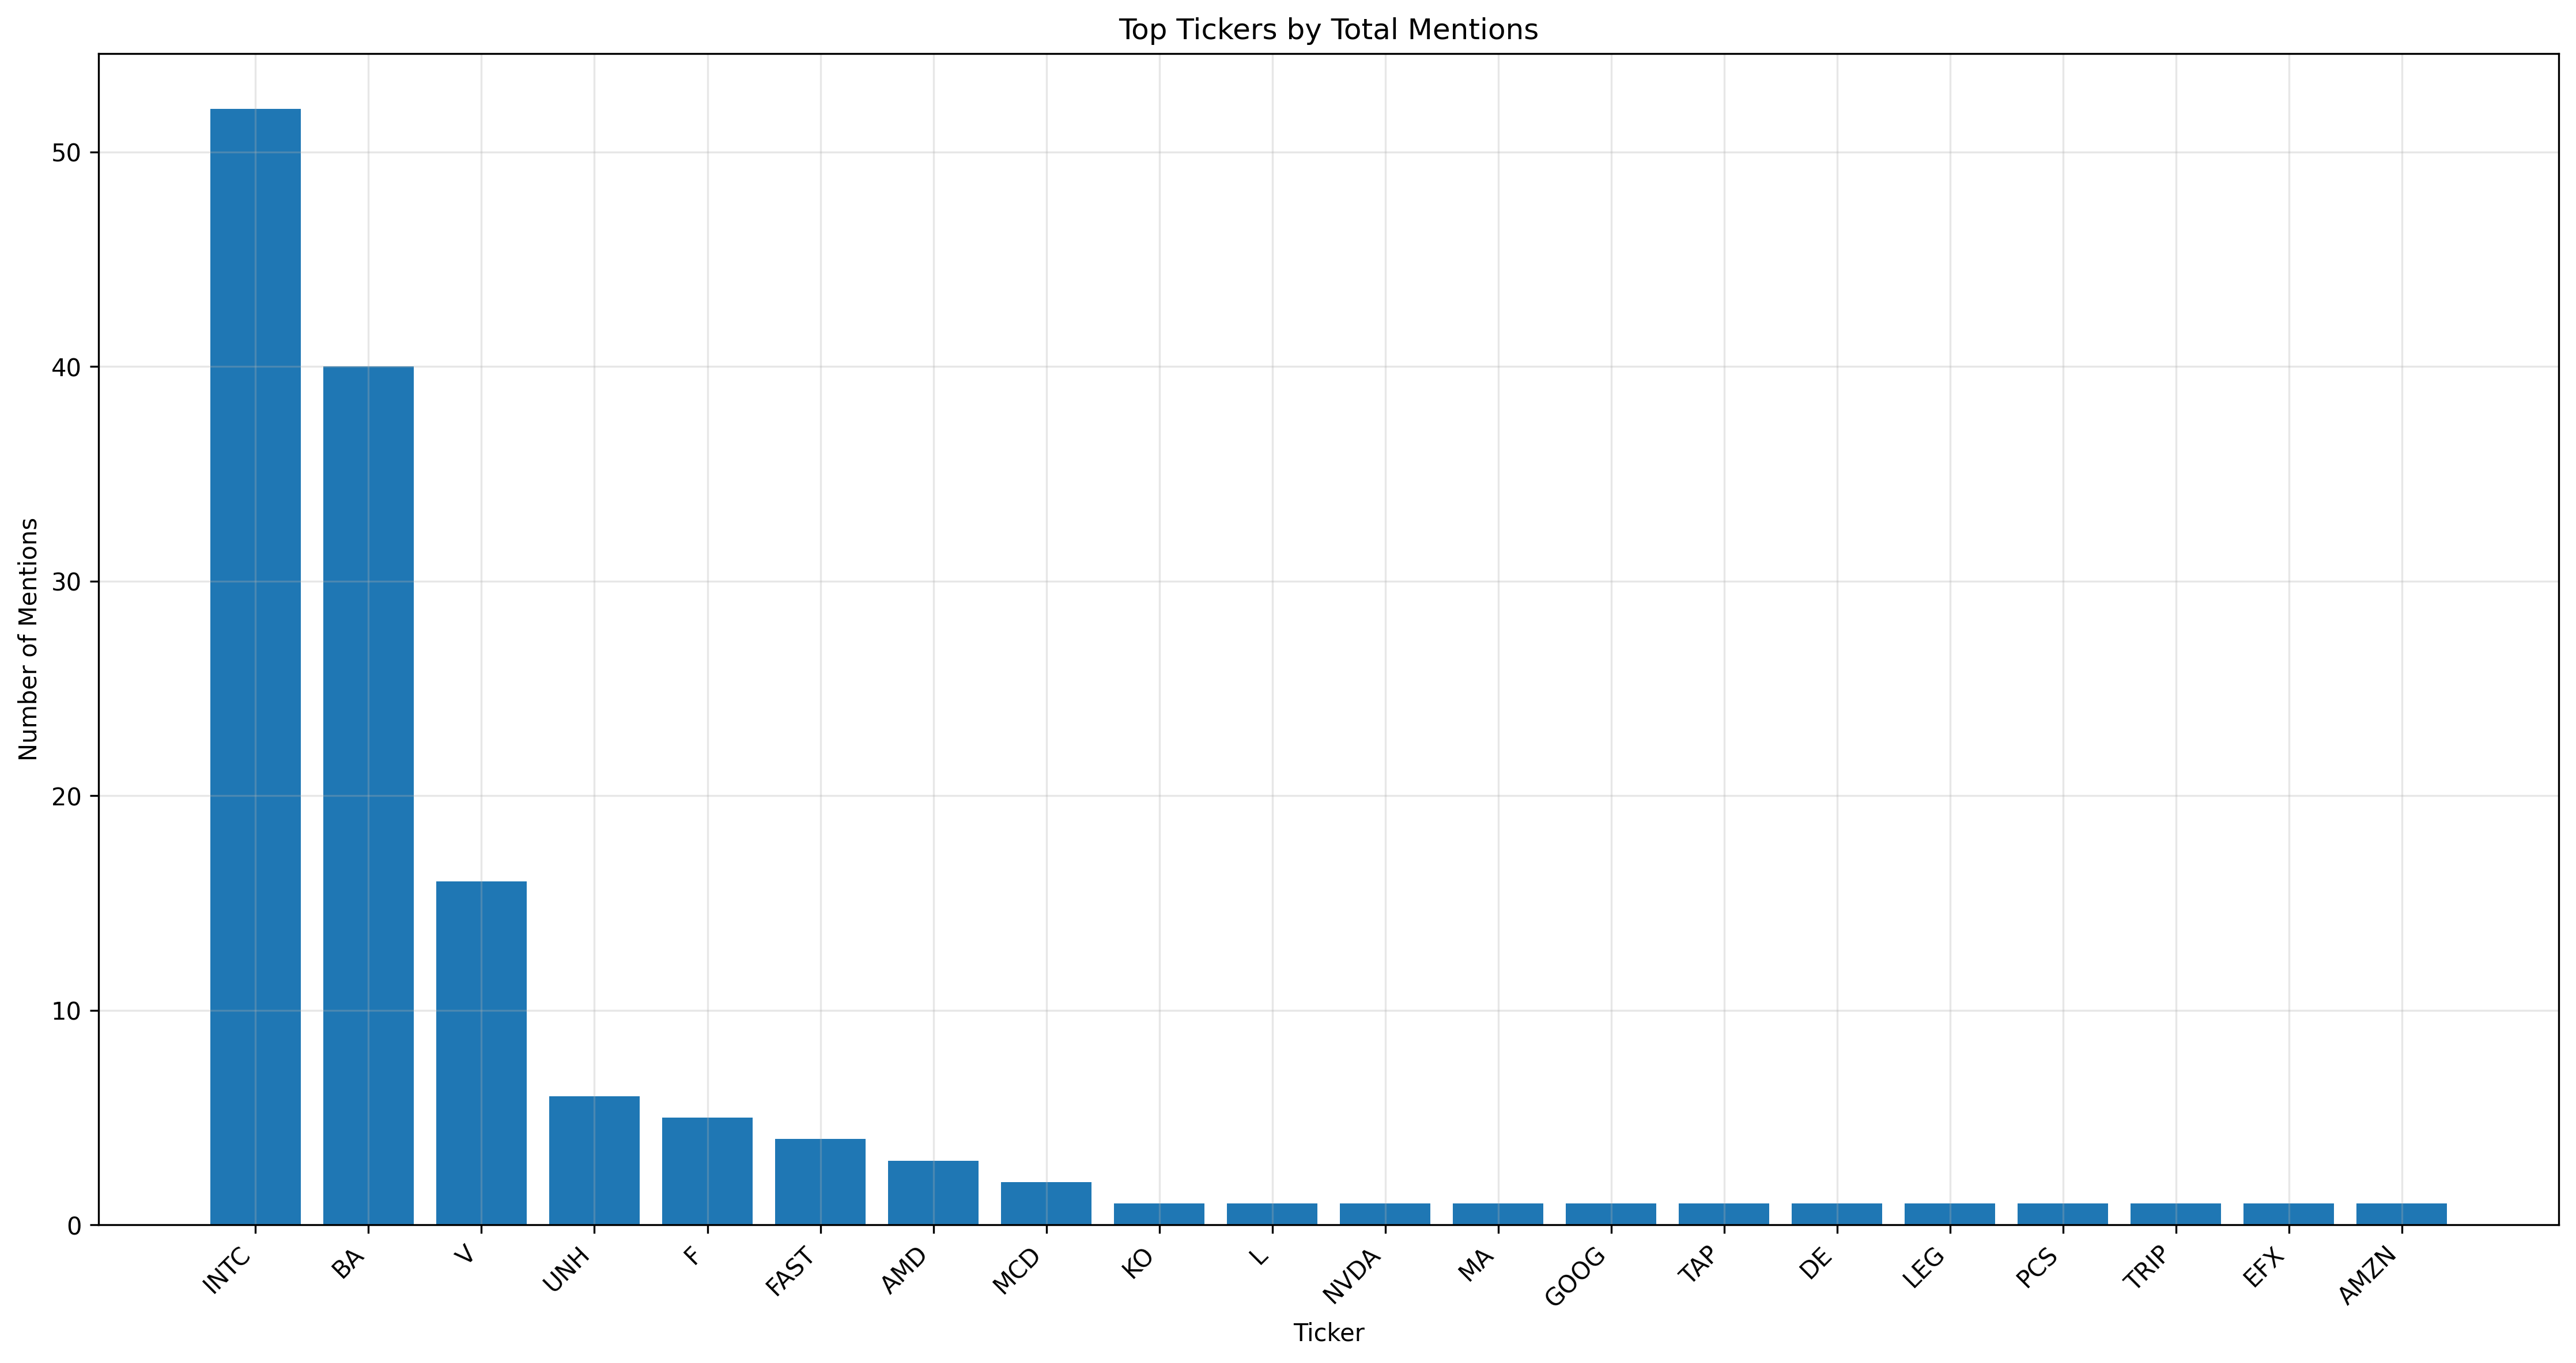
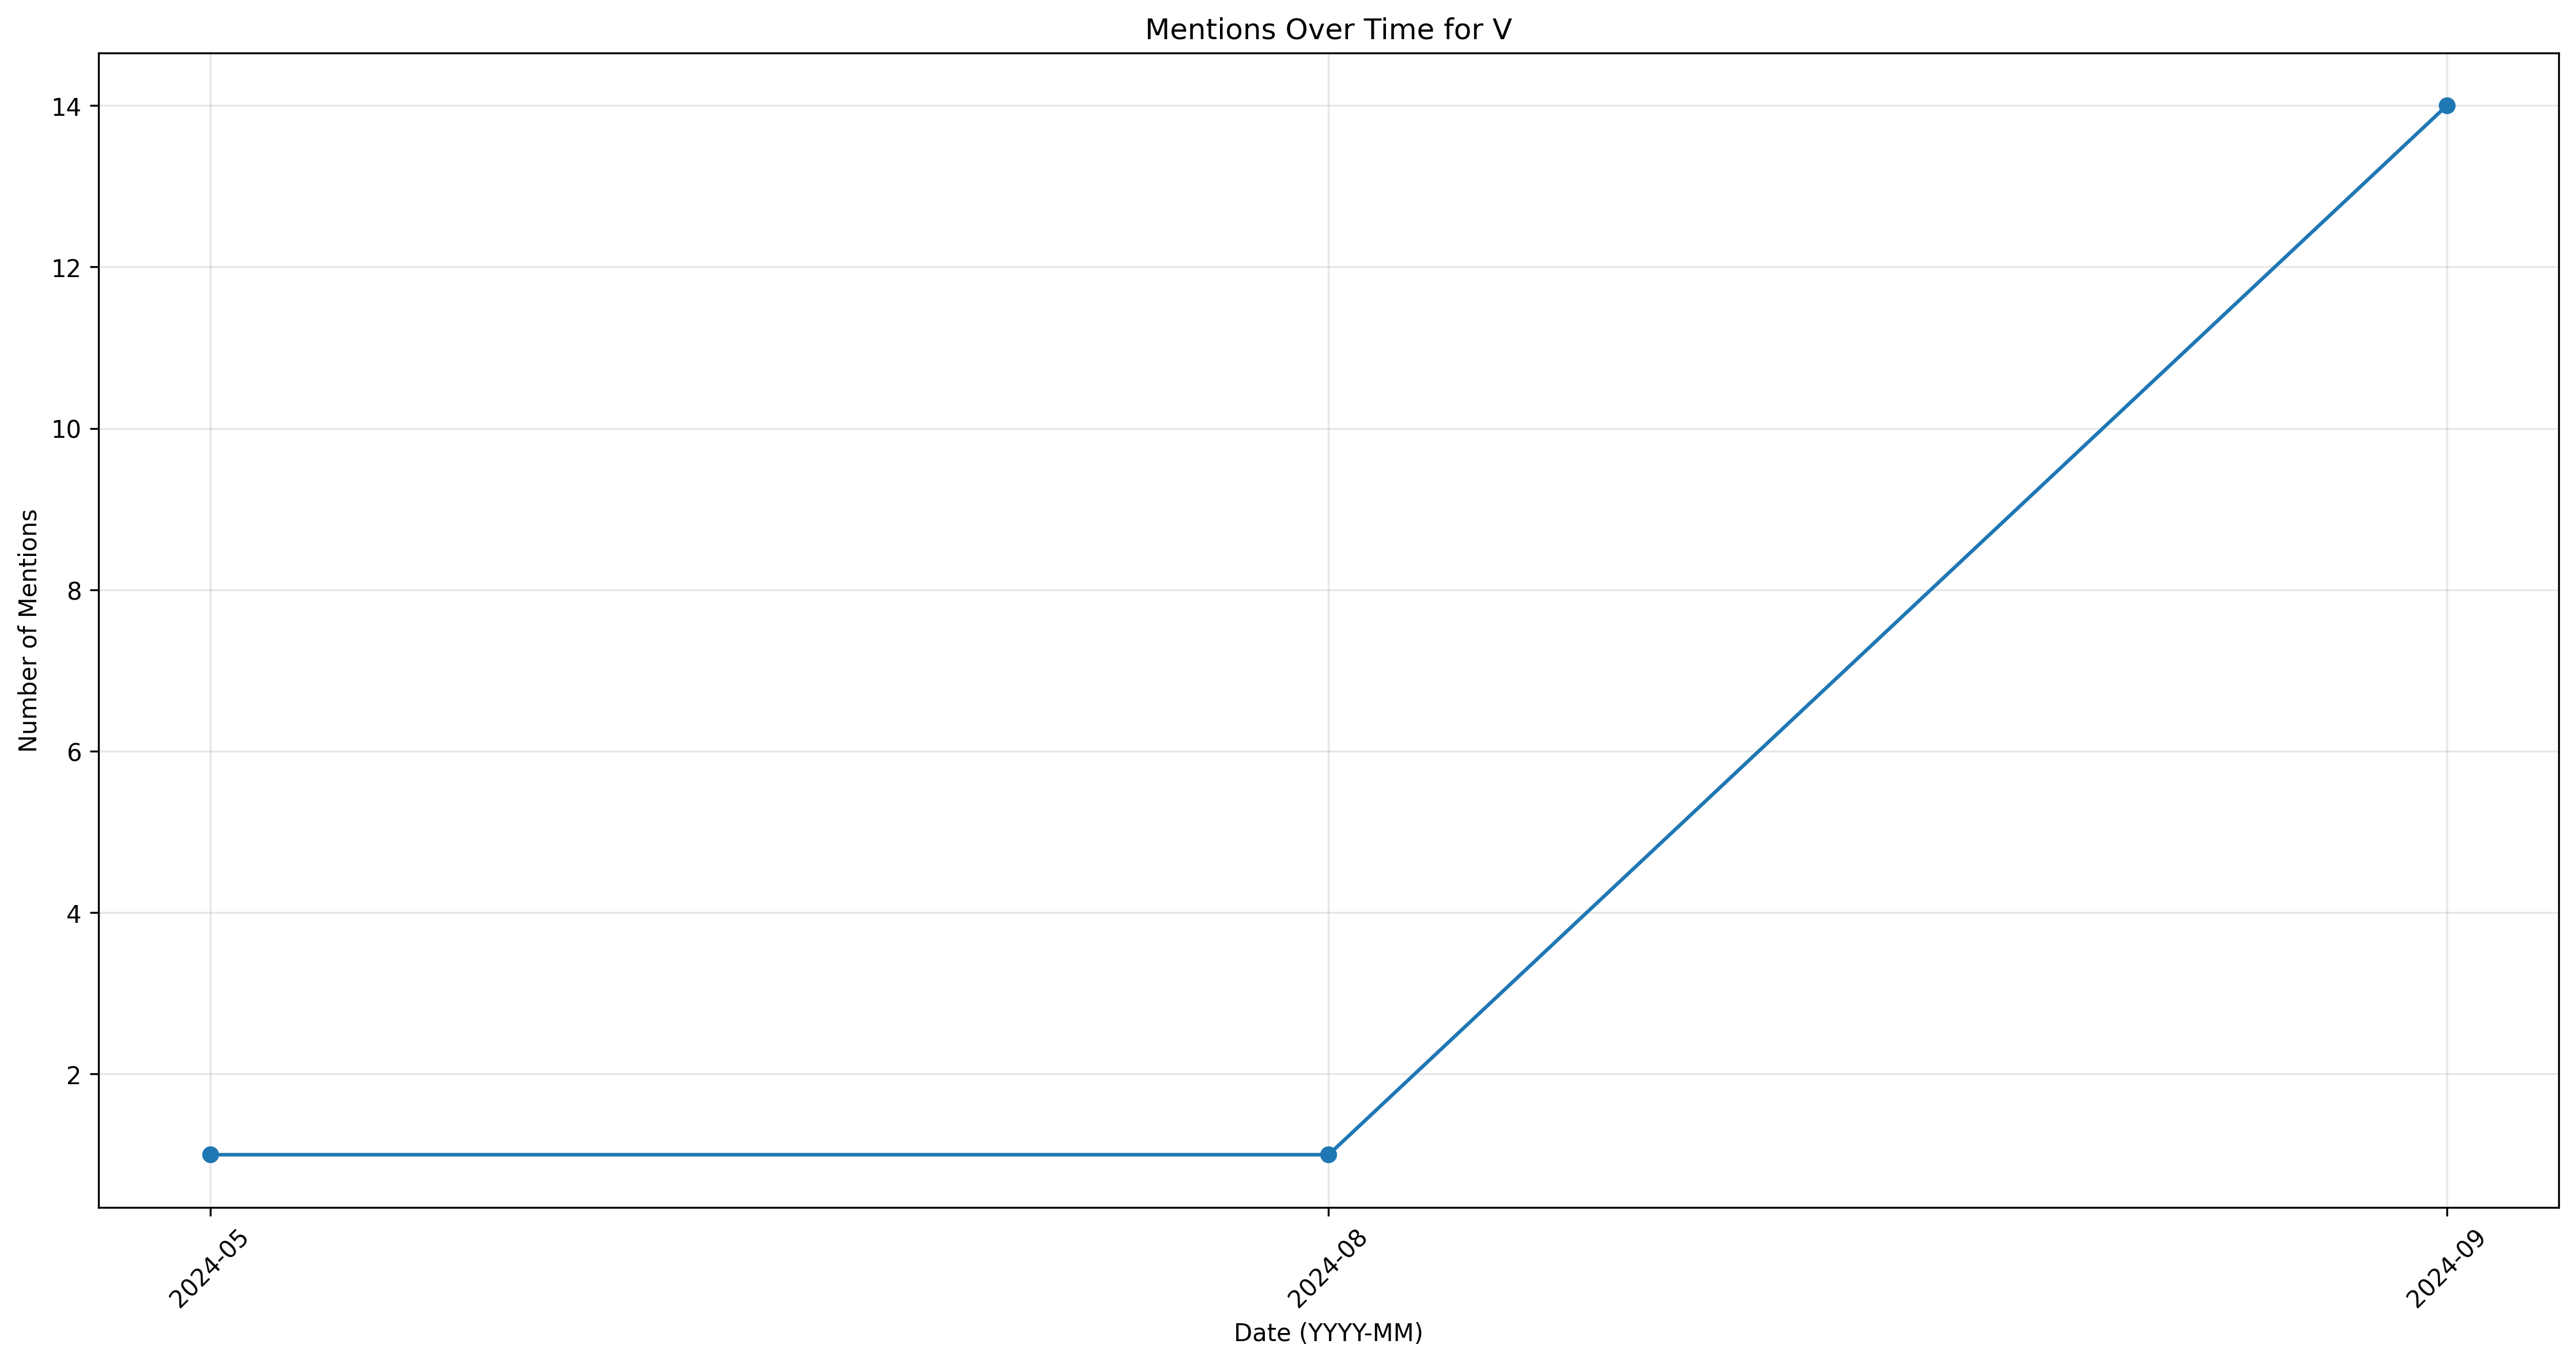
Our team crafted a delusion calculator that plots a firm's valuation based on its fundamental ratios against a hype score, dictated by trading volume, sentiment score, and sentiment volatility. We then used our comprehensive model to compare it against a purely fundamental model for identifying opportunities to short a stock. Both models were trained using Natural Cubic Splines on data from the first ten quarters between 2020 and 2022, with performance tested on the third and fourth quarters of 2022. Our goal was to develop a better predictor of quarterly stock price declines.
How we built it
We began by scraping data with Prawl and yfinance for build a base for our analysis. Then, we relied upon Streamlit, PANDAS, JSON, fuzzywuzzy, Google generative ai, and Plotly to build the front-end. We connected the data that was gathered to the user interface.
Challenges we ran into
Our team began the project with more theory than application, which led to delays due to errors. The inexperience with manipulating data frequently led to the dreaded question, “Where do I begin?”
Accomplishments that we're proud of
We are most proud of our ability to face challenges above our skill level and learn tools as they become convenient. We navigated large datasets and turned nebulous ideas into concrete models. There is something to be said for such vision and attention to detail.
What we learned
This project encouraged us to learn how to scrape data, perform sentiment analysis, and run machine learning models on panel data. Some of our members conquered tools like Prawl, while others leveraged the yfinance package to autofill essential data. We explored various Python packages such as Xarrays, SciKit Learn, and TensorFlow, and we learned about new data structures like tensors and data sets.
What's next for Stock Market Delusion Calculator
There is significant room for improvement of our model as it pertains to identifying "meme stocks." One could theoretically construct a portfolio to balance risk from abnormal market behavior.
Built With
- kaggle
- prawl
- python

Log in or sign up for Devpost to join the conversation.