-

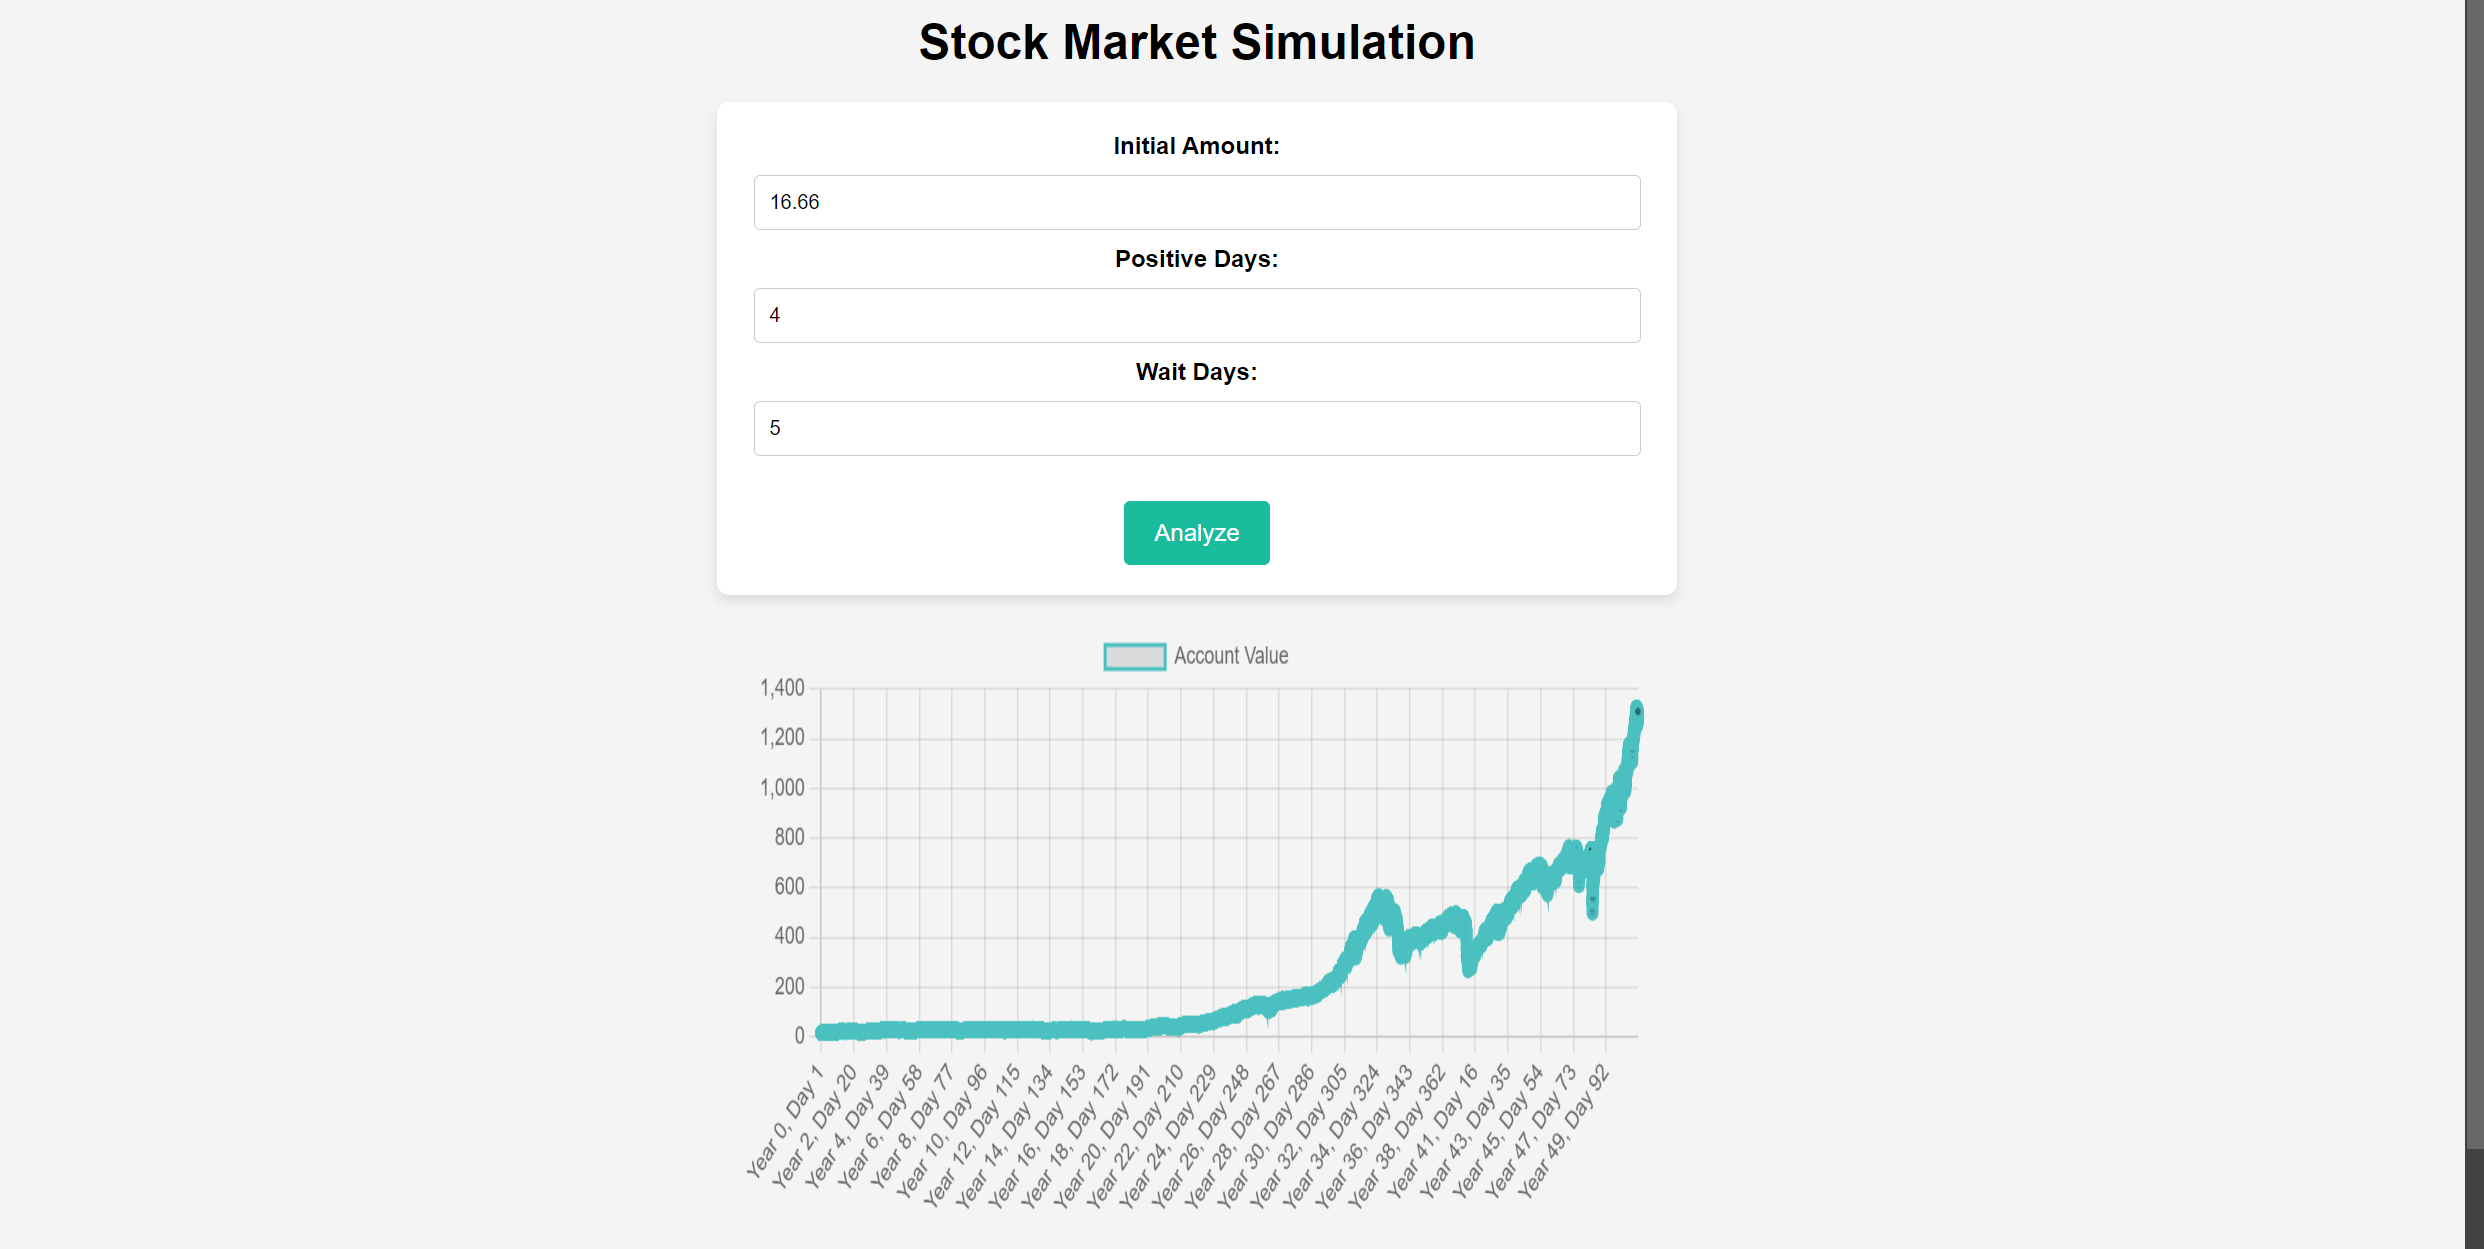
front page of the app
-
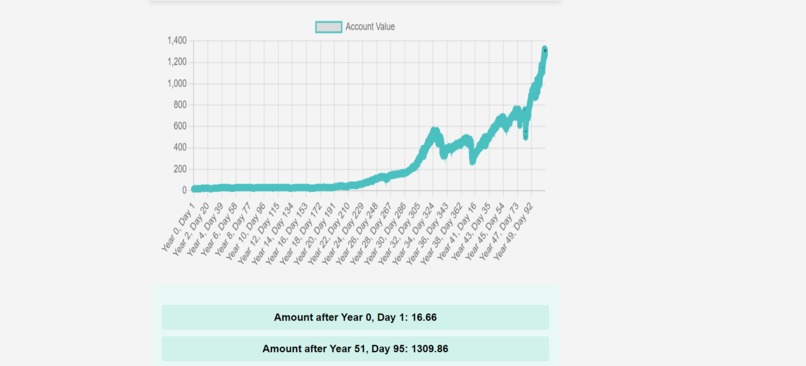
analysis page
-

logo


Overview of Stock Market Simulation Application In today's financial landscape, where market dynamics are increasingly volatile, the need for robust simulation tools cannot be overstated. Our Stock Market Simulation Application offers a cutting-edge, web-based platform designed to empower users—ranging from novice investors to seasoned financial professionals—to visualize and assess the impact of specific stock market strategies through simulation.
Purpose and Core Functionality:
The application is crafted to simulate investment strategies under varying market conditions, allowing users to input daily percentage changes and observe the effects of strategic decisions such as when to sell or hold an investment based on consecutive gains. At its core, the tool dynamically applies user-defined parameters to model investment outcomes, providing a dual interface of numerical data and graphical representations.
User Interaction and Input:
Upon accessing the application, users are prompted to upload a CSV file containing daily percentage changes, reflecting potential market movements. The interface is straightforward, ensuring ease of use without requiring extensive prior knowledge of financial markets or simulation software. Users can set key parameters that define their investment strategy:
Consecutive Positive Days Before Selling (CPD): This parameter allows users to define the number of successive days the market must show gains before the simulation triggers a sell. This is pivotal for testing strategies around momentum trading. Days to Wait Before Buying Back (DWB): Post-sale, users can specify how many days to wait before re-entering the market, enabling them to potentially avoid volatility or downturns and maximize returns by re-entering at a more favorable time. Processing and Outputs:
The application processes the input data, applying the sell and wait rules as per the user settings. It calculates the evolving investment balance and displays these results in two formats:
Detailed List View: Each day's result is listed sequentially, showing the investment value after daily market changes, highlighted with color coding—green for gains and red for losses—to offer clear, intuitive feedback. Graphical Representation: Alongside the list, a dynamic line graph provides a visual representation of the investment's trajectory over the simulation period. This graphical insight is particularly useful for visual learners and in presentations where trends need to be quickly and clearly understood. Advanced Features and User Benefits:
The application's real-time processing and display of simulation results not only enhance user engagement but also deepen users' understanding of strategic investment timing. It acts as an educational tool, demonstrating the potential long-term impacts of decisions based on market performance trends. Furthermore, it allows for the testing of investment strategies in a risk-free setting, which can be invaluable for both new investors learning to navigate market complexities and experienced traders testing new theories before real-world application.
Strategic Implications and Educational Value:
By providing a hands-on tool for simulating investment decisions based on real market data, the application serves as an excellent educational platform. It introduces users to concepts such as market timing, risk management, and the psychological aspects of trading, such as patience and discipline in sticking to a predefined strategy despite market fluctuations.
Conclusion:
Our Stock Market Simulation Application is designed not just as a tool, but as a platform that demystifies complex financial strategies through interactive learning and strategic experimentation. It offers a unique blend of educational and practical utility, making it a valuable asset in the toolkit of anyone looking to enhance their understanding or execution of stock market investments.

Log in or sign up for Devpost to join the conversation.