-
-
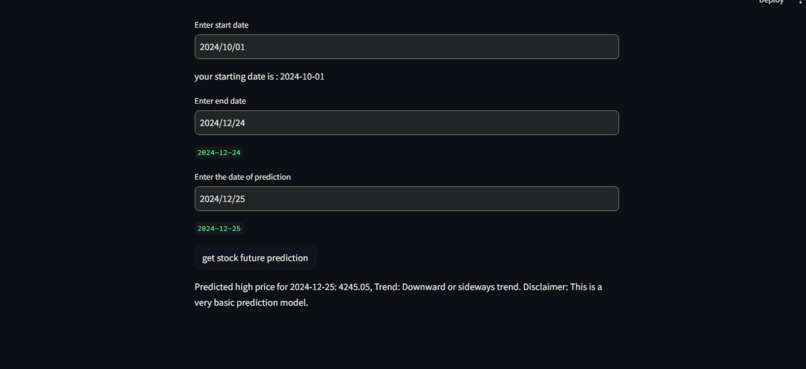
detecting price of stock
-
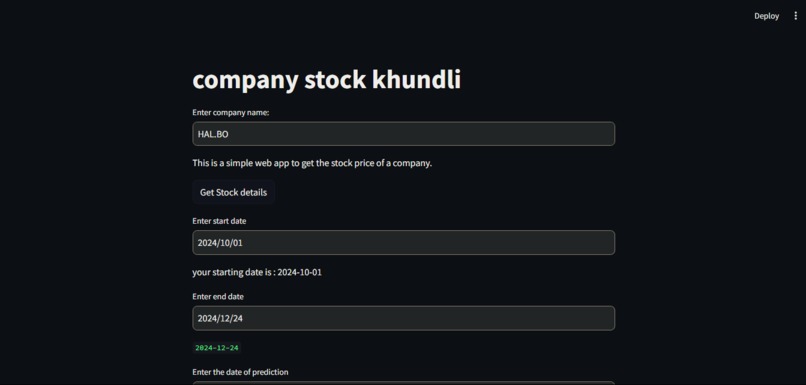
stocks khundli


Inspiration
The inspiration behind this project came from the growing influence of algorithmic trading in financial markets. With the rise of data-driven decision-making, I wanted to create a tool that simplifies stock analysis for both beginners and experienced traders. The idea was to build a system that provides real-time insights, stock trends, and basic predictive analysis using Python.
What I Learned
Throughout the development of this project, I gained valuable insights into:
- Working with financial data APIs like Yahoo Finance
- Implementing basic trend analysis and visualization using Matplotlib and Plotly
- Developing interactive web applications with Streamlit
- Handling large datasets efficiently for stock market analysis
- The challenges of financial data volatility and real-time processing
How I Built It
- Programming Language: Python
- Framework: Streamlit for the web interface
- Data Source: Yahoo Finance API for fetching real-time stock data
- Visualization: Matplotlib and Seaborn for trend analysis
- Libraries Used: Pandas, NumPy, yfinance, and SciPy
The project was structured to ensure seamless data fetching, real-time updates, and an interactive UI to enhance the user experience.
Challenges Faced
- Data Accuracy & API Limitations:
- Handling missing or delayed stock data from the API was a major challenge. Implementing error handling and data validation was necessary.
- Handling missing or delayed stock data from the API was a major challenge. Implementing error handling and data validation was necessary.
- Real-time Performance:
- Processing large volumes of stock data in real-time without slowing down the Streamlit app was a key issue. Optimizing API calls and using caching techniques helped overcome this.
- Processing large volumes of stock data in real-time without slowing down the Streamlit app was a key issue. Optimizing API calls and using caching techniques helped overcome this.
- Visualization Complexity:
- Making the graphs both informative and aesthetically pleasing required multiple iterations and fine-tuning.
- Making the graphs both informative and aesthetically pleasing required multiple iterations and fine-tuning.
Despite these challenges, building this project has been a rewarding learning experience, deepening my understanding of financial markets and data-driven decision-making.
🚀 Future Improvements:
- Implement machine learning models for predictive stock analysis
- Add more financial indicators for deeper insights
- Optimize the application for faster real-time data fetching
Built With
- python
- yfinance


Log in or sign up for Devpost to join the conversation.