-
-
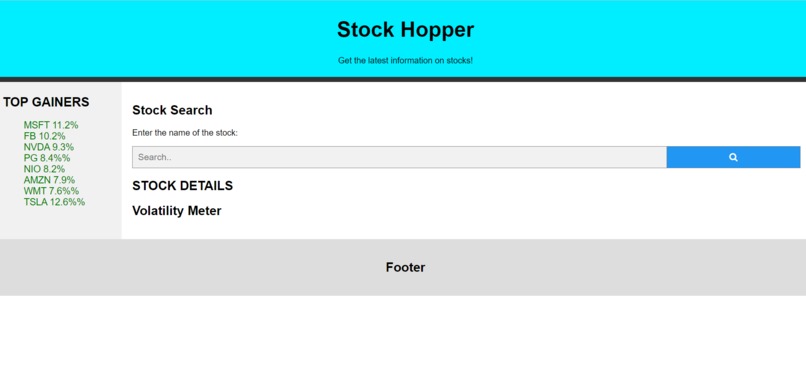
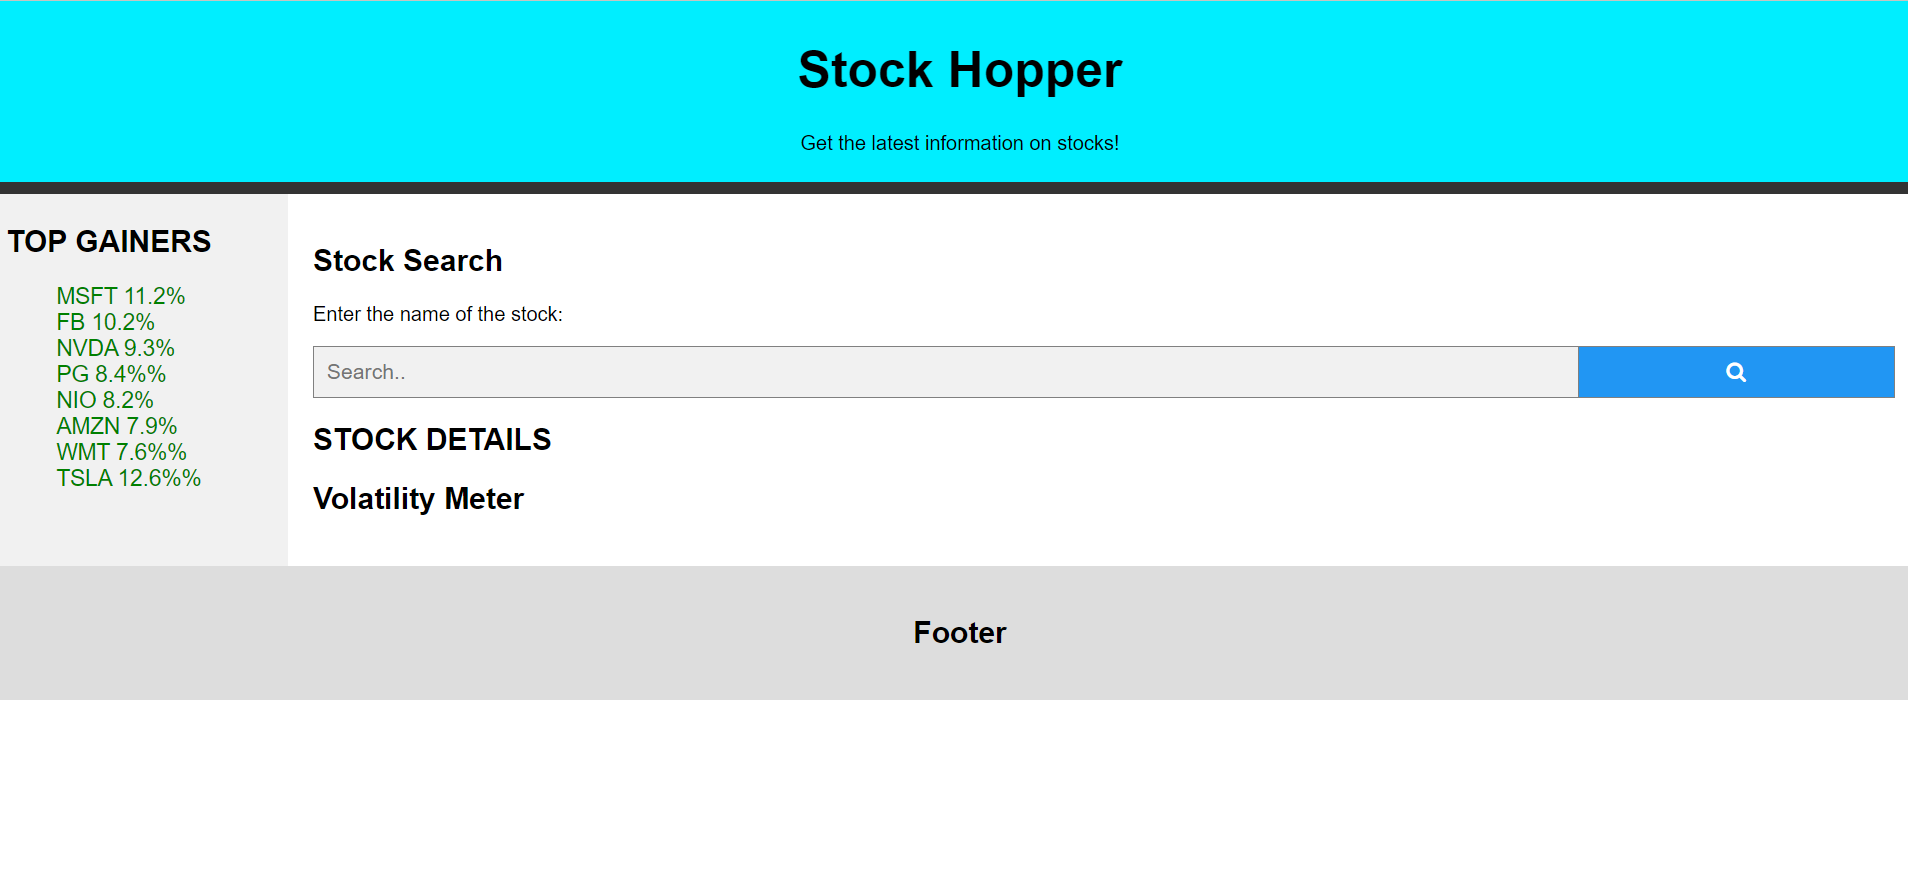
Front end
-
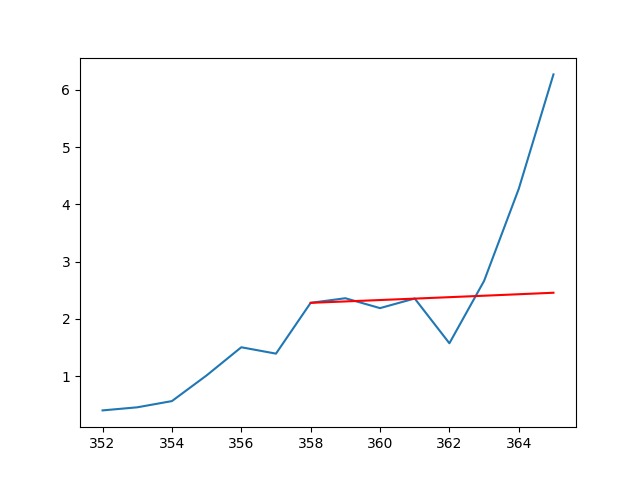
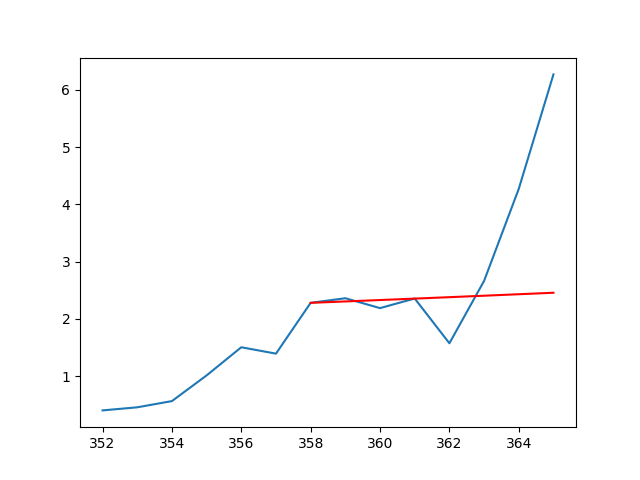
Predicted trend
Inspiration
We wanted to learn how to analyze stocks and pull data from Yahoo Finance to see the latest trends in the stock market.
What it does
It should graph the closing prices of a stock that the user inputs into the search bar over the course of one year. It also goes through and predicts the trend of how the stock will progress and rates the stock's volatility over the past week, month, and year.
How we built it
The frontend was made in HTML and Javascript whereas the backend was built in python and Flask.
Challenges we ran into
Flask had issues scaling, and as a result the backend server was only able to run locally.
Accomplishments that we're proud of
The frontend was able to be successfully deployed, and is responsive! Additionally the prediction tool was able to accurately predict the trends around 70% of the time. This was tested by analyzing all the data but the most recent week and comparing how the predicted trend compared to the actual data.
What we learned
Making Flask and NodeJS servers and pulling from live APIs.
What's next for Stock Hopper
Deploy Flask backend separately to feed data to the frontend from anywhere without any problems.

Log in or sign up for Devpost to join the conversation.