-
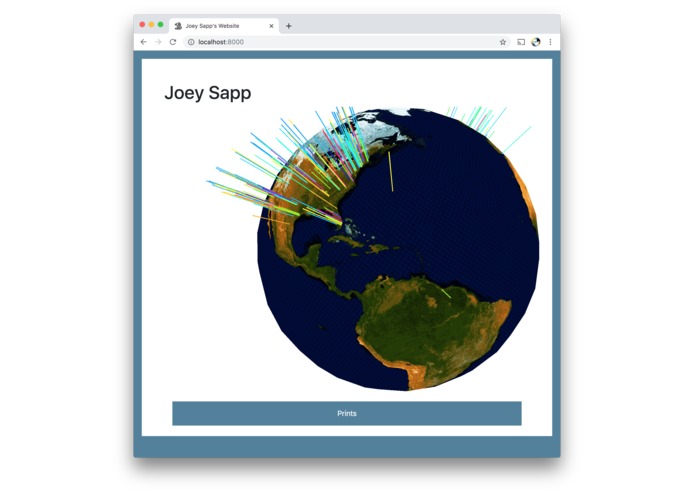
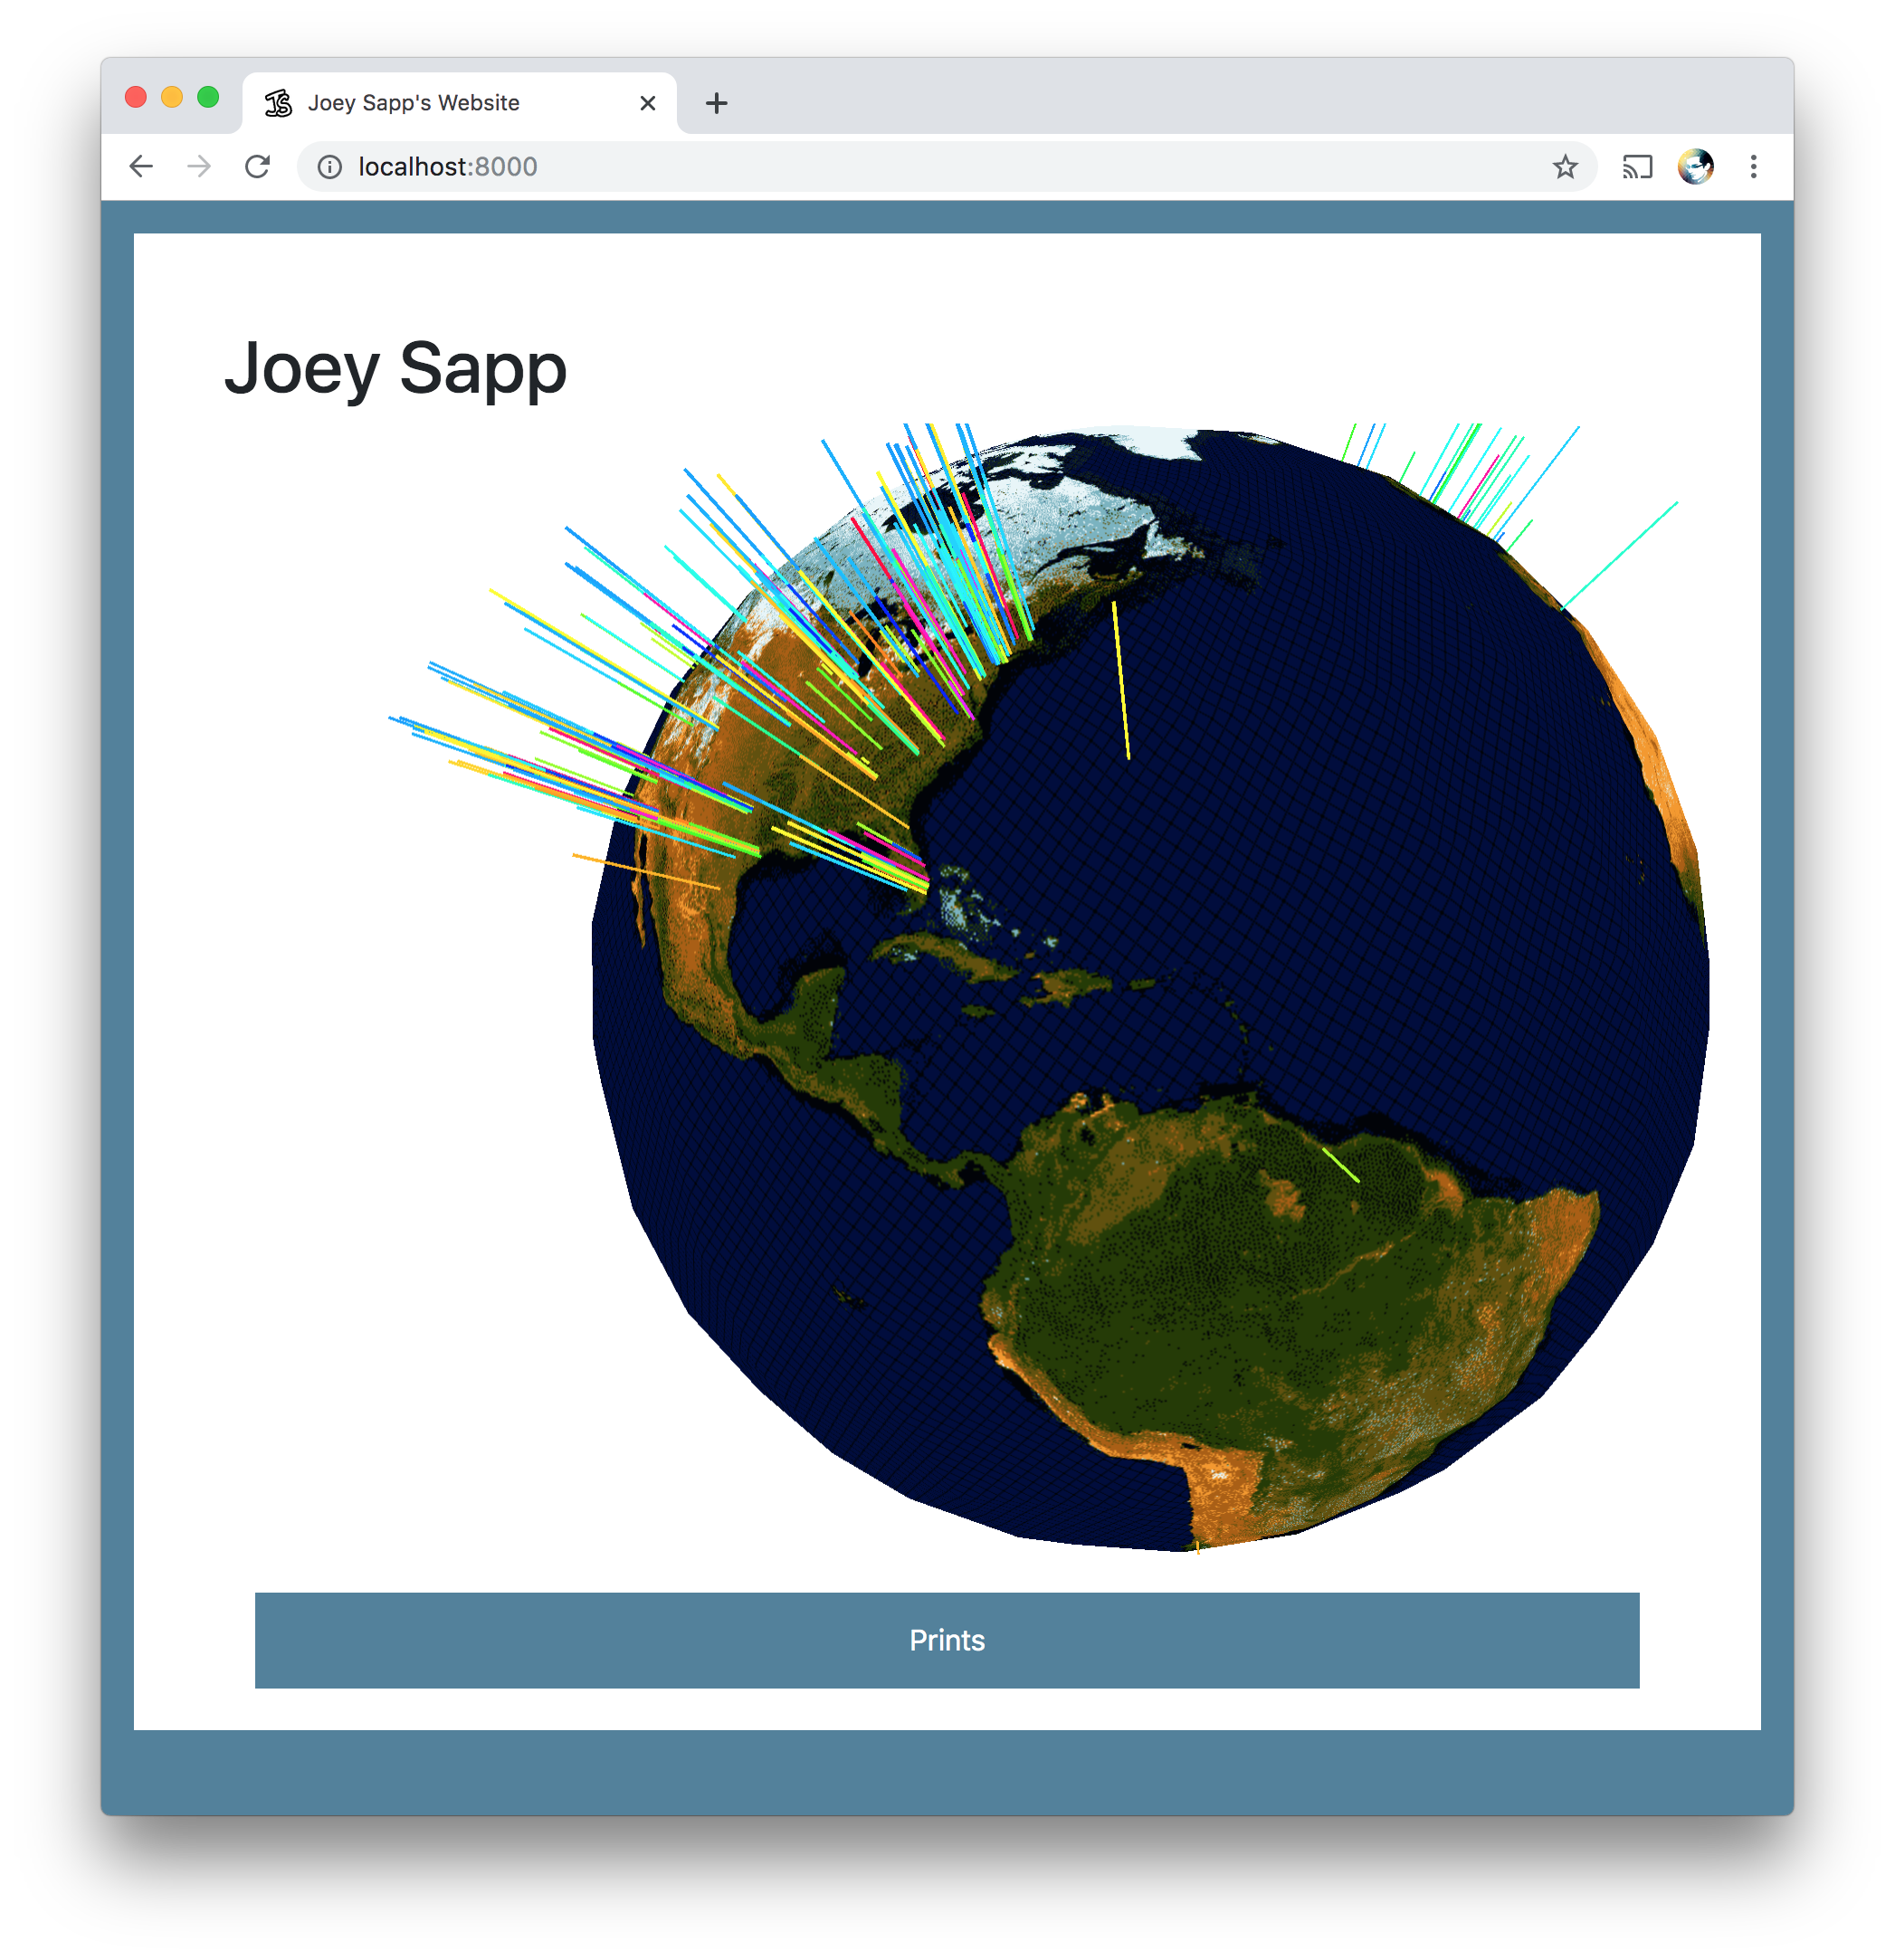
Panning view
-
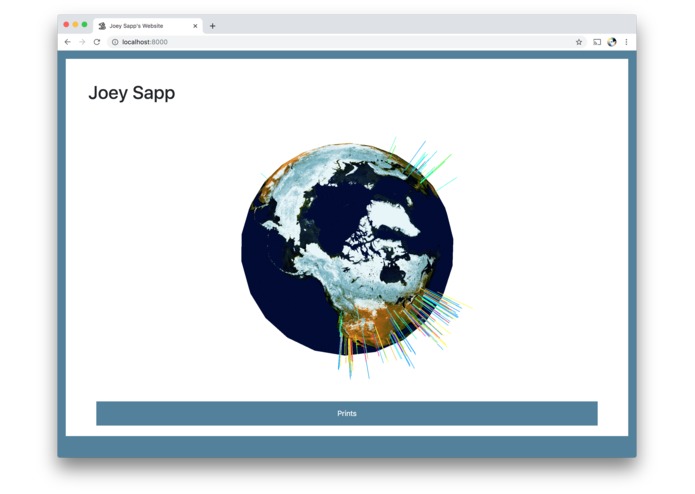
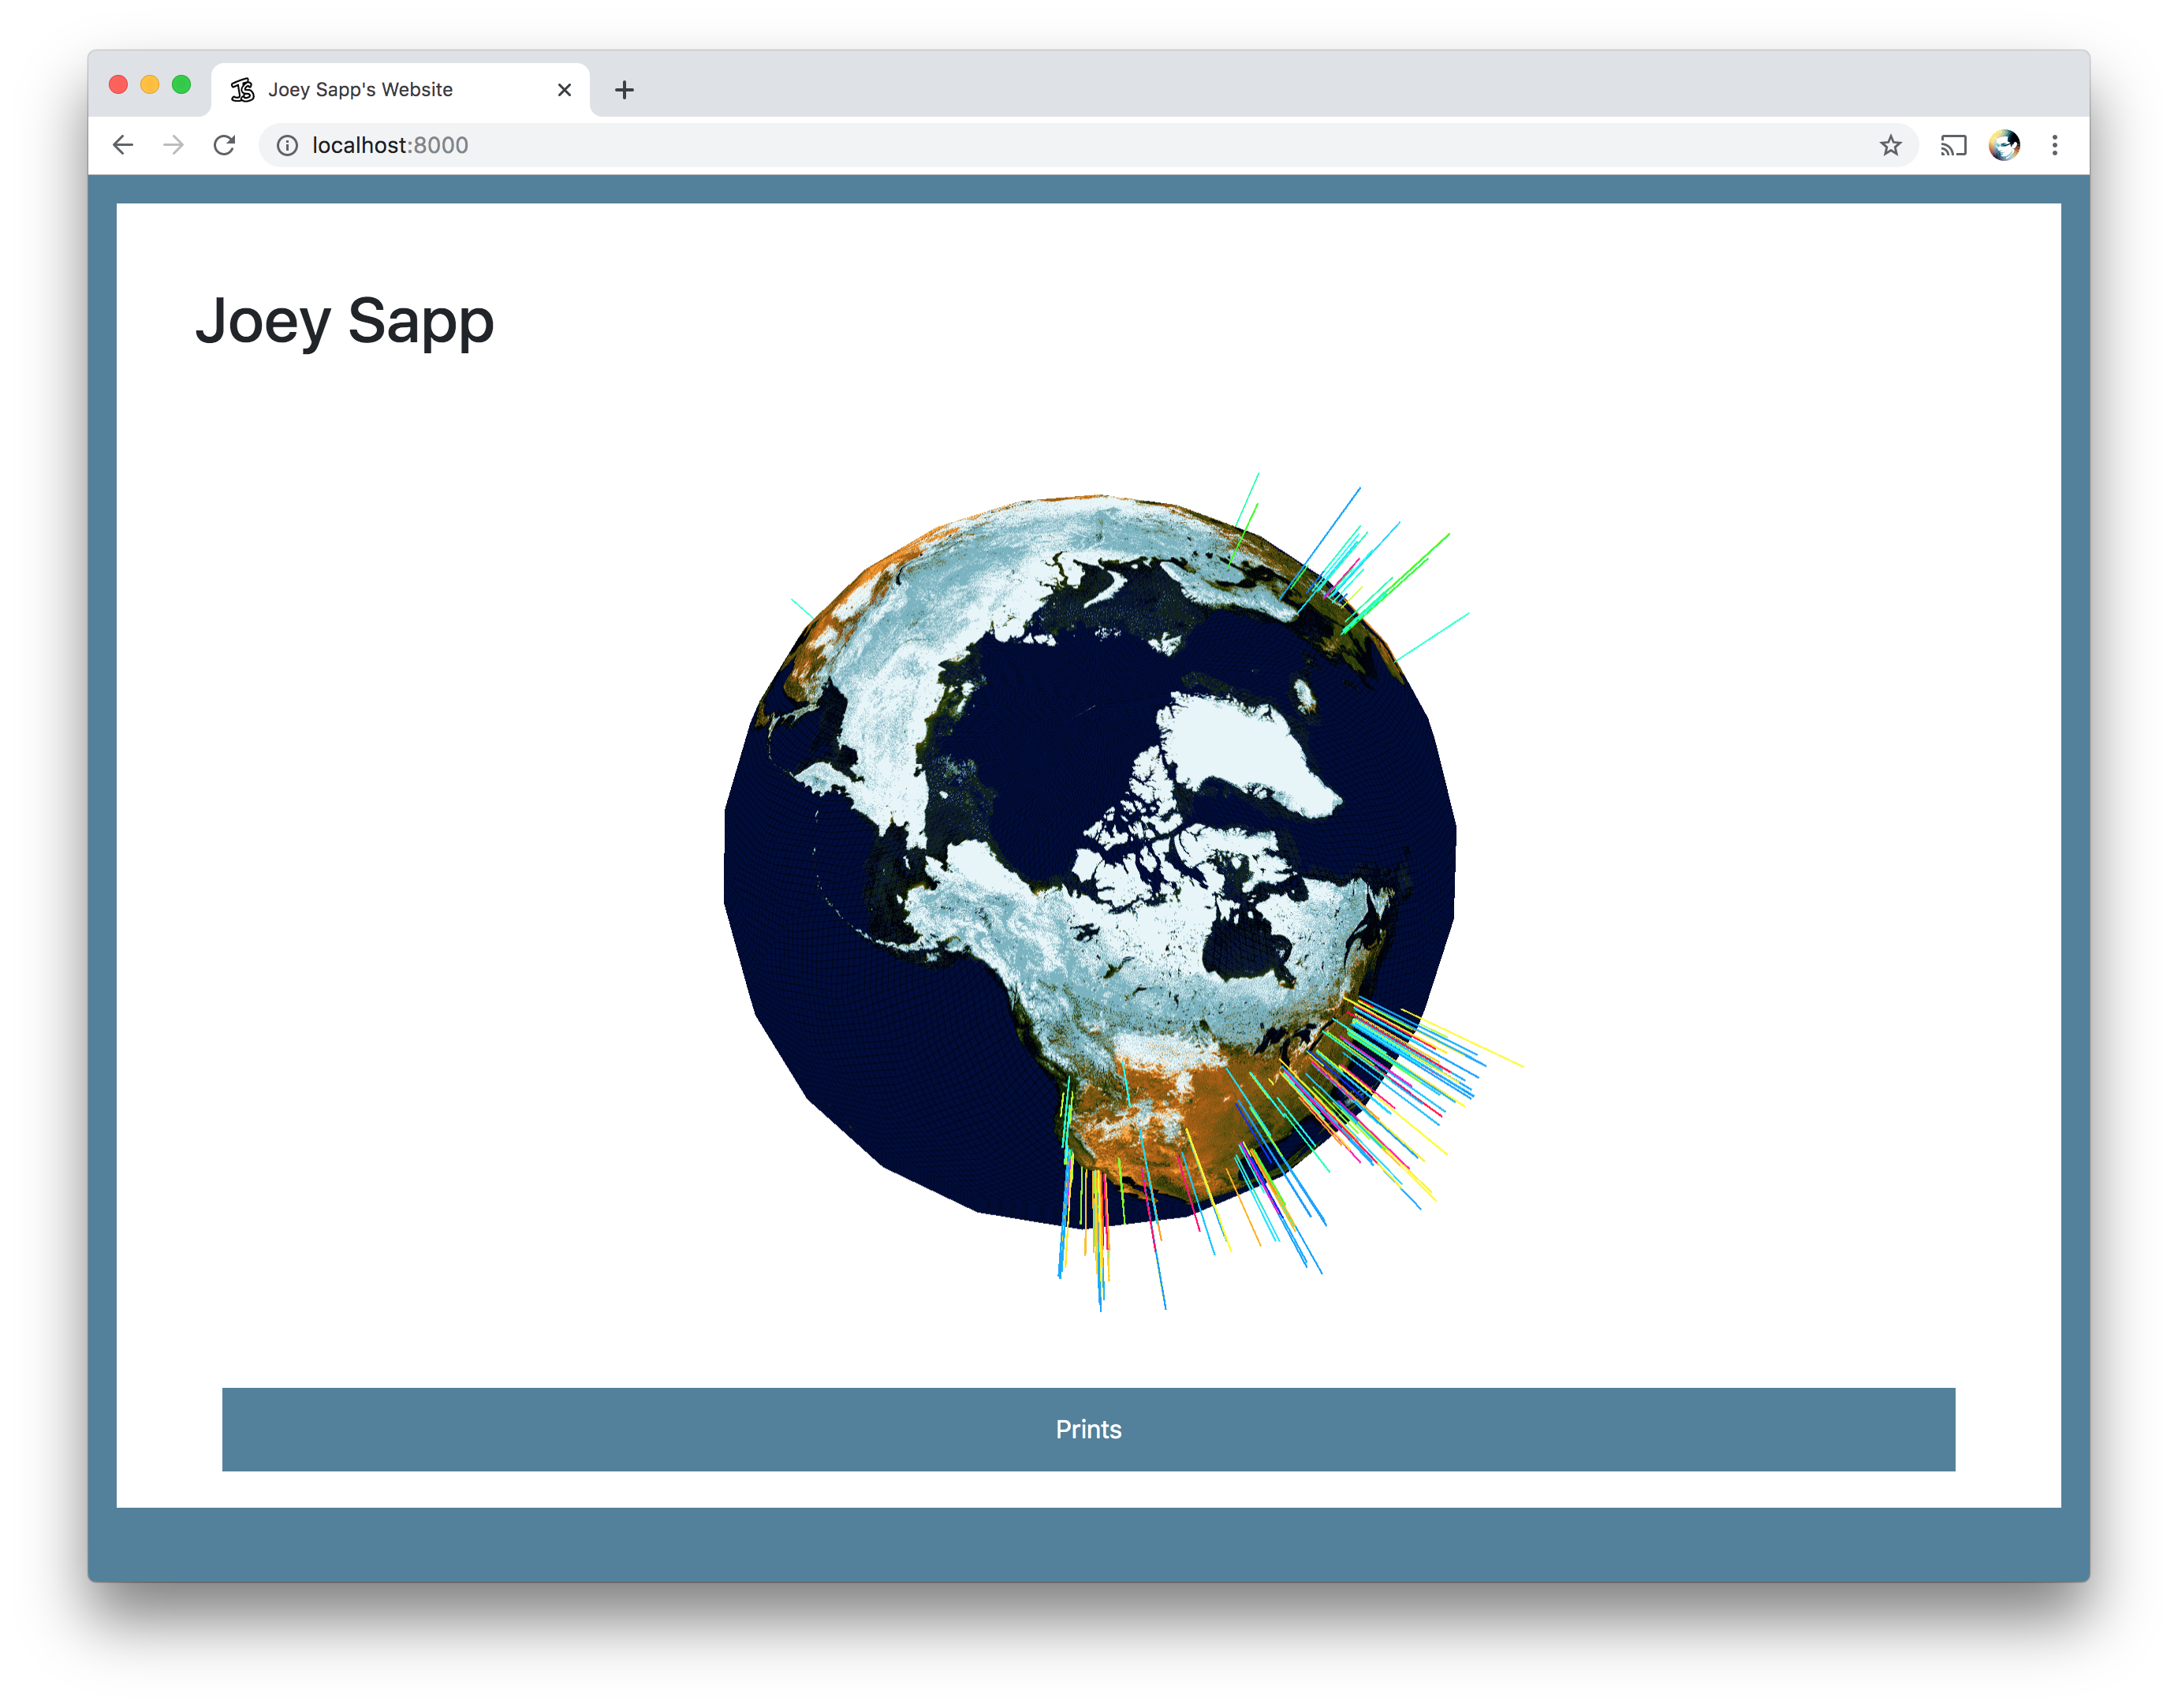
Entirety of globe
-
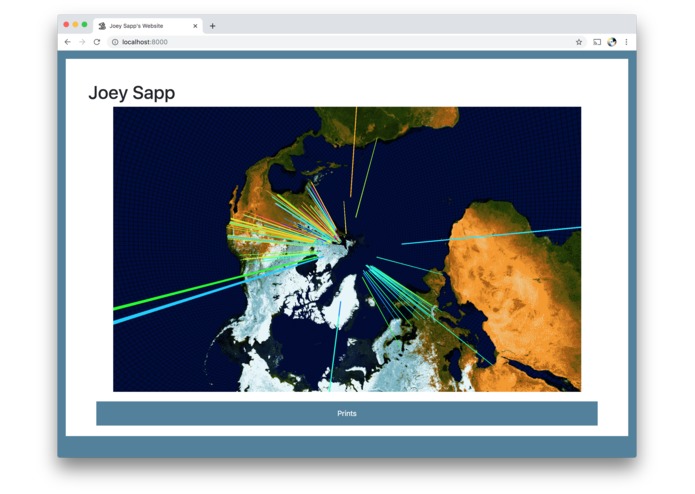
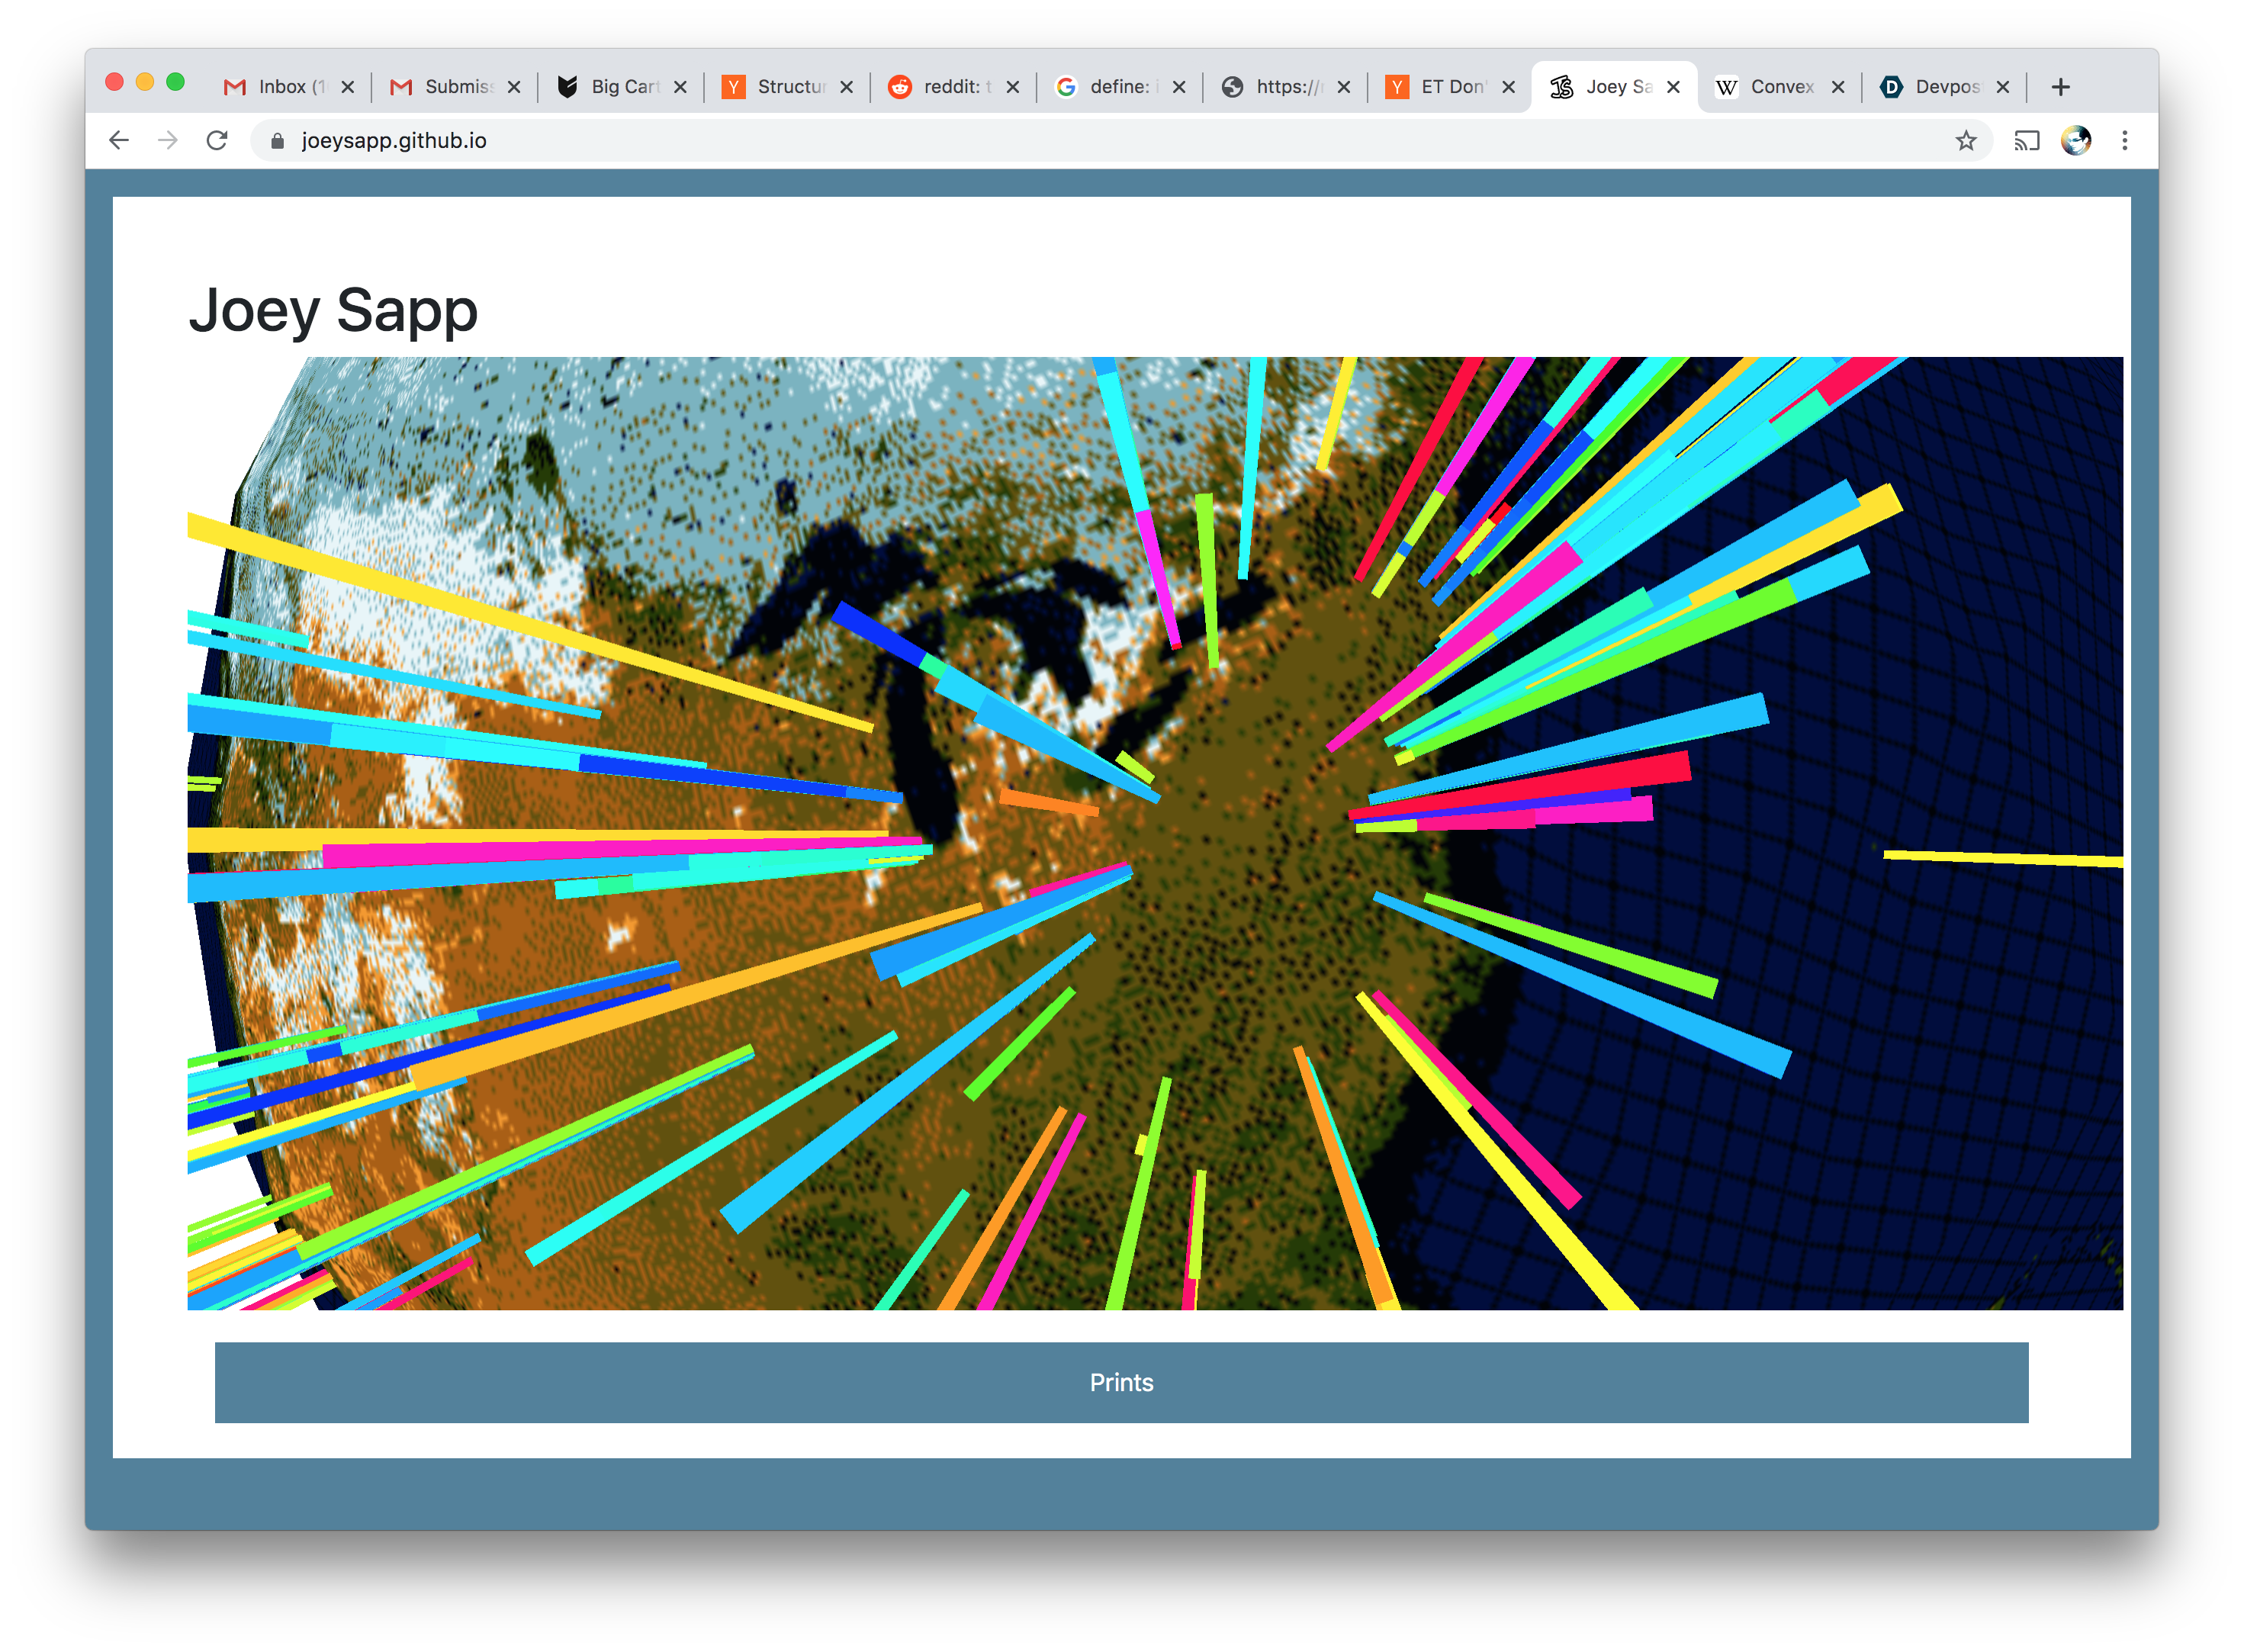
Inner globe (zoomable)
-
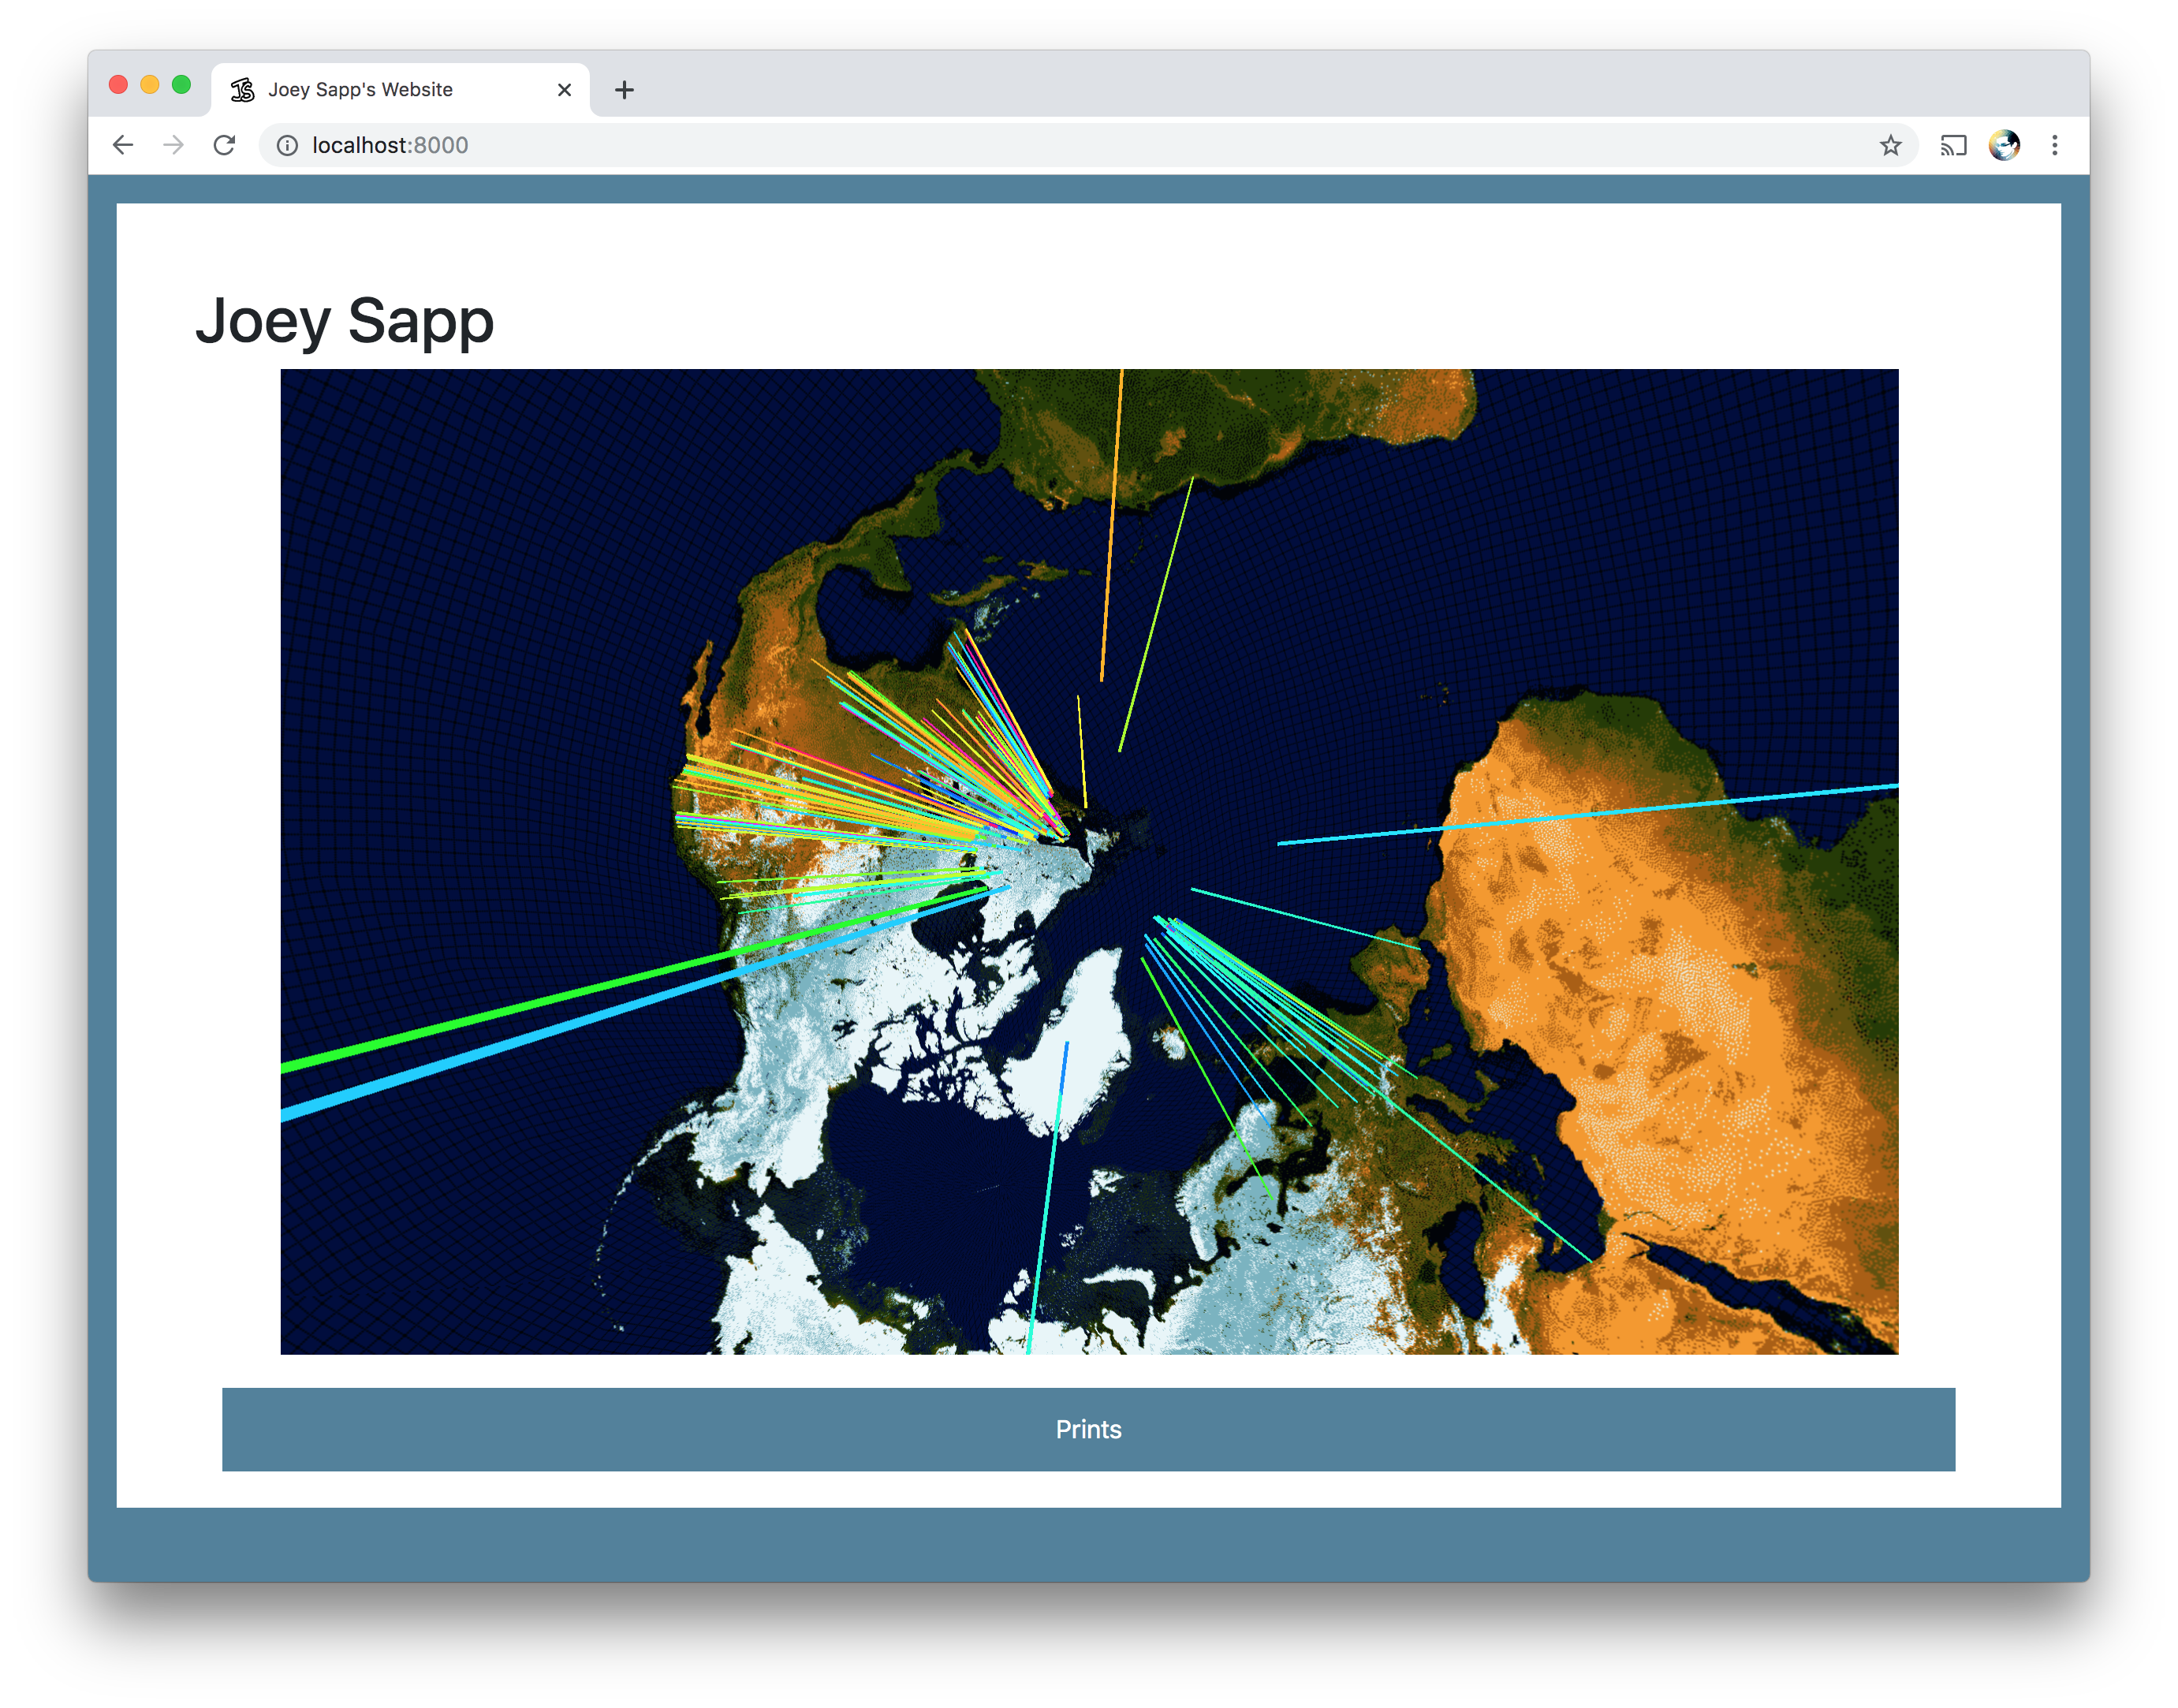
North-east America, financial centroid
Inspiration
A desire to see information about the companies on the major markets, both their location and types. This was an exercise in both data acquisition, data cleaning and finally transforming the data into a meaningful display.
What it did
Pulled 45,000 data points from markets around the world via stock symbol, and in-progress pulling location data about each symbol.
What it does
It is in a demonstrable form as a webpage, running in a WebGL instance mapping coordinates to a globe.
How I built it
The project can be broken down into several steps that I had to take:
- Designing a web scraper to pull Yahoo Finance into local data
- Testing to create a Python script to transform local data into a reliable schema
- Writing a Python script to request geolocation data from local data
- Placing data into a Javascript visualisation
Stages of Data Retrieved
Each stock symbol is pulled from a local file, such as:
FANFX
From here, I used that symbol to query Yahoo finance, which returns a series of information, such as company name, company sector/industry, company location and full time employees. I then parse this data into the following format:
f,FANFX,FS Market Neutral Fund Class A - FS Series Trust,"201 Rouse Boulevard, Philadelphia, PA 19112",877-372-9880
I then use the address (field 3) to query a Geolocation api, returning me lat, long values to use.
Challenges I ran into
Previous issues converting latitude and longitude points to spherical cartesian coordinates; issues beyond a typical conversion involve the placement of the globe. Thankfully I had figured this out with a previous project; it involves annoying stuff like rotating the globe by constants I had to figure out.
Accomplishments that I'm proud of
Piecing together the project with a number of moving parts, i.e. scraping multiple pages/APIS, parsing the data and finally displaying it in a compelling fashion.
What I learned
Sometimes data fitting is hard and may have to be designed in a brittle fashion, but once it's done it's REALLY nice.
What's next for Stock Data Parser
- Pulling market information about each stock, potentially in a historical fashion.
- Figuring out a better way to display the information for more granular views (each city in the United States, for example.)

Log in or sign up for Devpost to join the conversation.