-
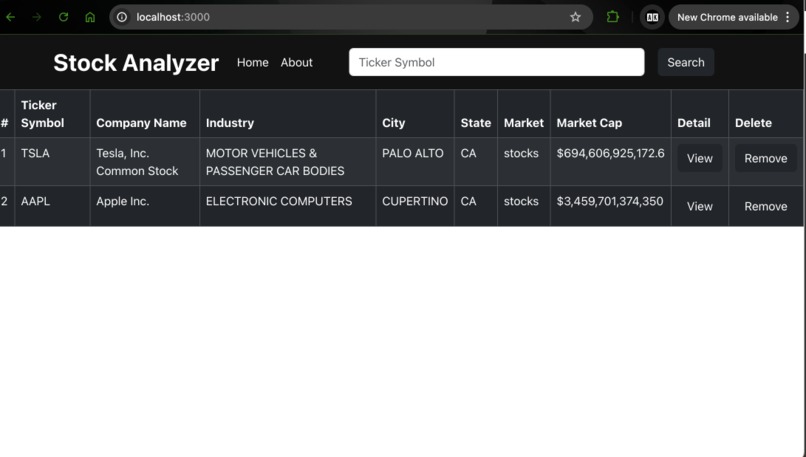
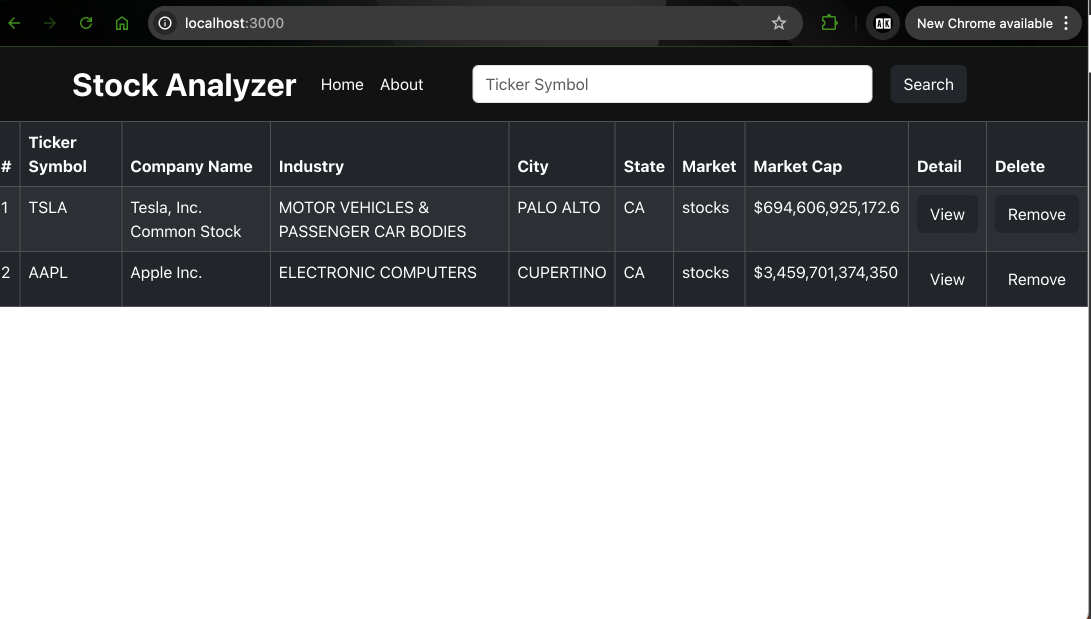
This is the home page where users can search for ticker symbol for companies and add them to the list from the data fetched from PolygonAPI.
Inspiration
The idea for the Stock Analyzer Web App came from my passion for both technology and finance. With the increasing interest in stock market investments, I saw the need for a simple and accessible tool that could help users track and analyze stock performance.
What it does
The Stock Analyzer Web App is a simple, intuitive tool designed to help users track and analyze stocks using data from the Polygon.io API. Users can search for stocks, add them to a personalized list, and view detailed stock information, including charts, financial analysis and technical analysis indicators.
How I built it
- Frontend: React.js, Axios for API requests, React Bootstrap for UI components, and Chart.js (or Recharts) for displaying graphs.
- API: Polygon.io Stock API. API Request limit: 5 requests per minute (free tier). Retrieves end-of-day stock data.
- State Management: React's useState and useEffect hooks for managing UI state.
- Database: Firebase Firestore is used to store stock data in a persistent, real-time database, ensuring that data is available across sessions and devices.
- Environment Variables: The .env file is used for securely storing sensitive data like API keys.
- Web Hosting: Vercel.
Challenges I ran into
- Session Management
- API Rate Limits: The free-tier limit of 5 requests per minute from Polygon.io posed a challenge, as I needed to optimize API requests and ensure that the app would not exceed the limit, especially with frequent user interactions.
- Responsive Design and Data Visualization: Integrating charting libraries and making them responsive across all devices was a bit tricky. I had to ensure that the data looked good and updated dynamically on all screen sizes.
Accomplishments that I am proud of (Features)
- Stock Search: Search for stocks by ticker symbol or company name.
- Stock List: Add stocks to a customizable list and view basic information (symbol, price, daily change, etc.).
- Stock Details: Click on a stock in the list to view detailed information, including charts and technical indicators (e.g., moving averages, RSI).
- Firebase Integration: Stock data is stored in Firebase Firestore, ensuring persistent, real-time data storage and retrieval across sessions.
- Real-time Data: Option to fetch live or delayed stock data (depending on API plan).
Sample Ticker Symbols
- AAPL – Apple Inc.
- MSFT – Microsoft Corporation
- GOOGL – Alphabet Inc. (Google)
- AMZN – Amazon.com Inc.
- TSLA – Tesla, Inc.
- NFLX – Netflix, Inc.
- META – Meta Platforms, Inc. (Facebook)
- NVDA – NVIDIA Corporation
What I learned
- Using Polygon.io API.
- Optimizing API requests to handle rate limits.
What's next for Stock Analyzer
- Provide real-time data with the updated API plan.
- Implement user authentication so users can save their stock lists across multiple sessions.
- Introduce more advanced financial analysis tools and additional technical indicators.
Built With
- api
- axios
- bootstrap
- cookies
- firebase
- firestore
- javascript
- polygon.ioapi
- react
- session

Log in or sign up for Devpost to join the conversation.