-
1>
-
2>
-
3>
-
4>
Inspiration
It is challenge. Also I wanted to make one.
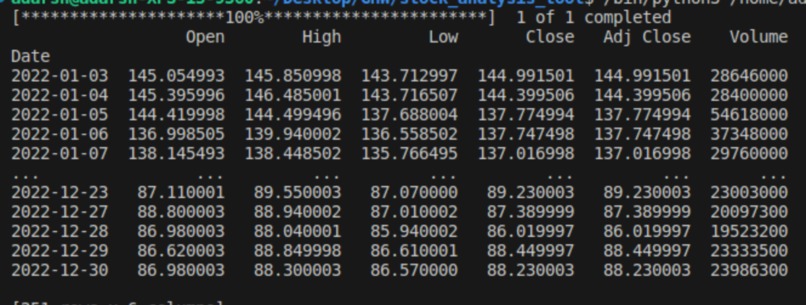
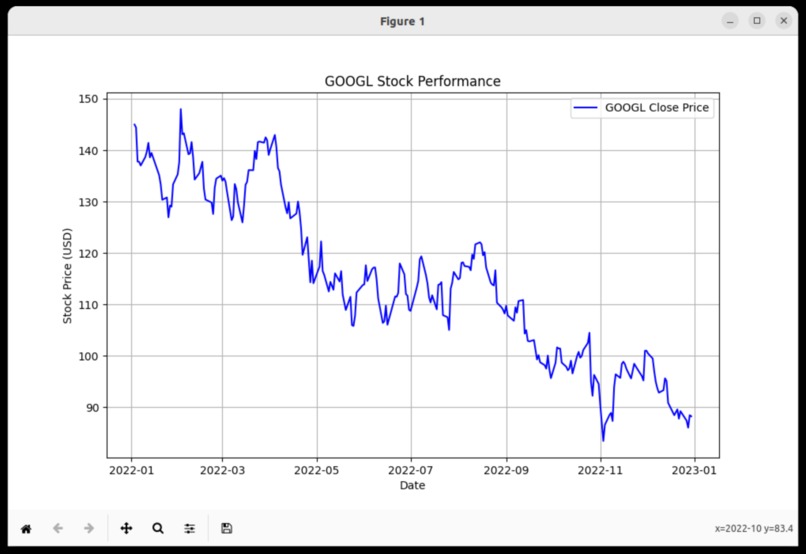
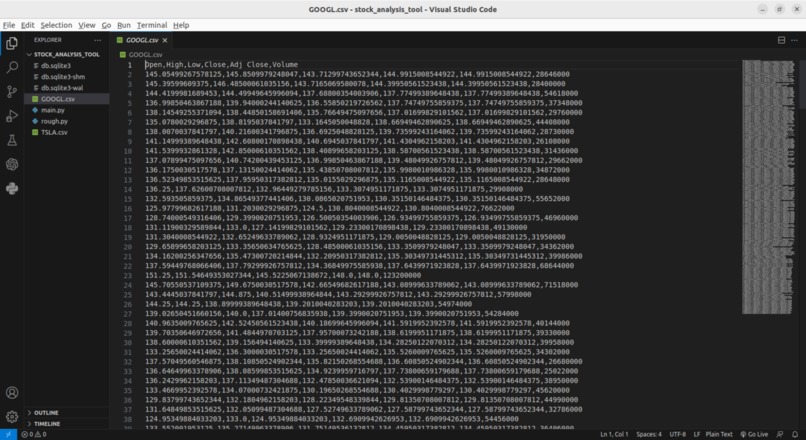
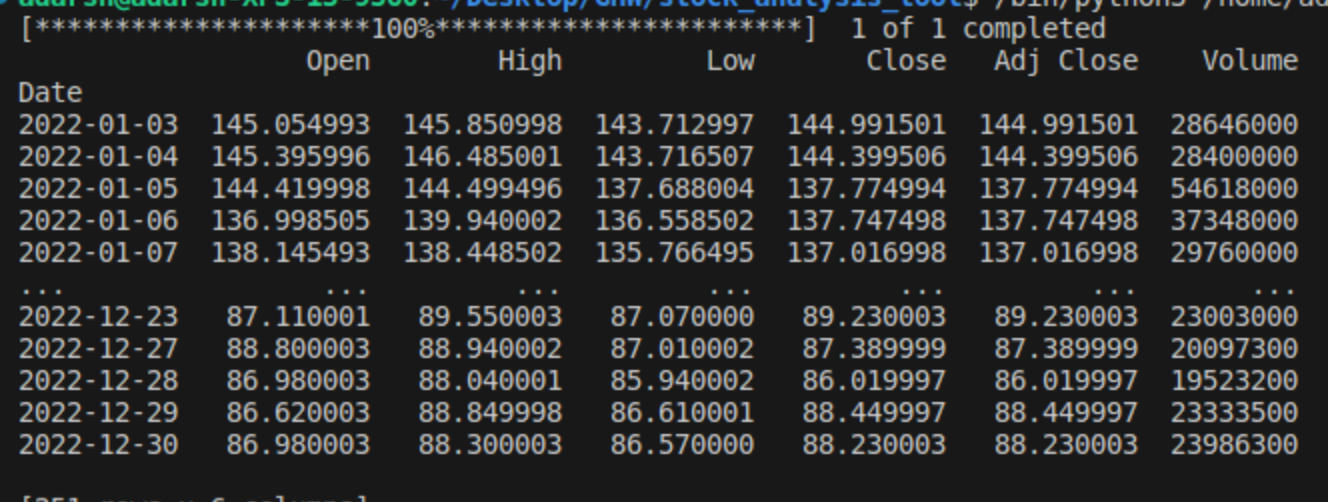
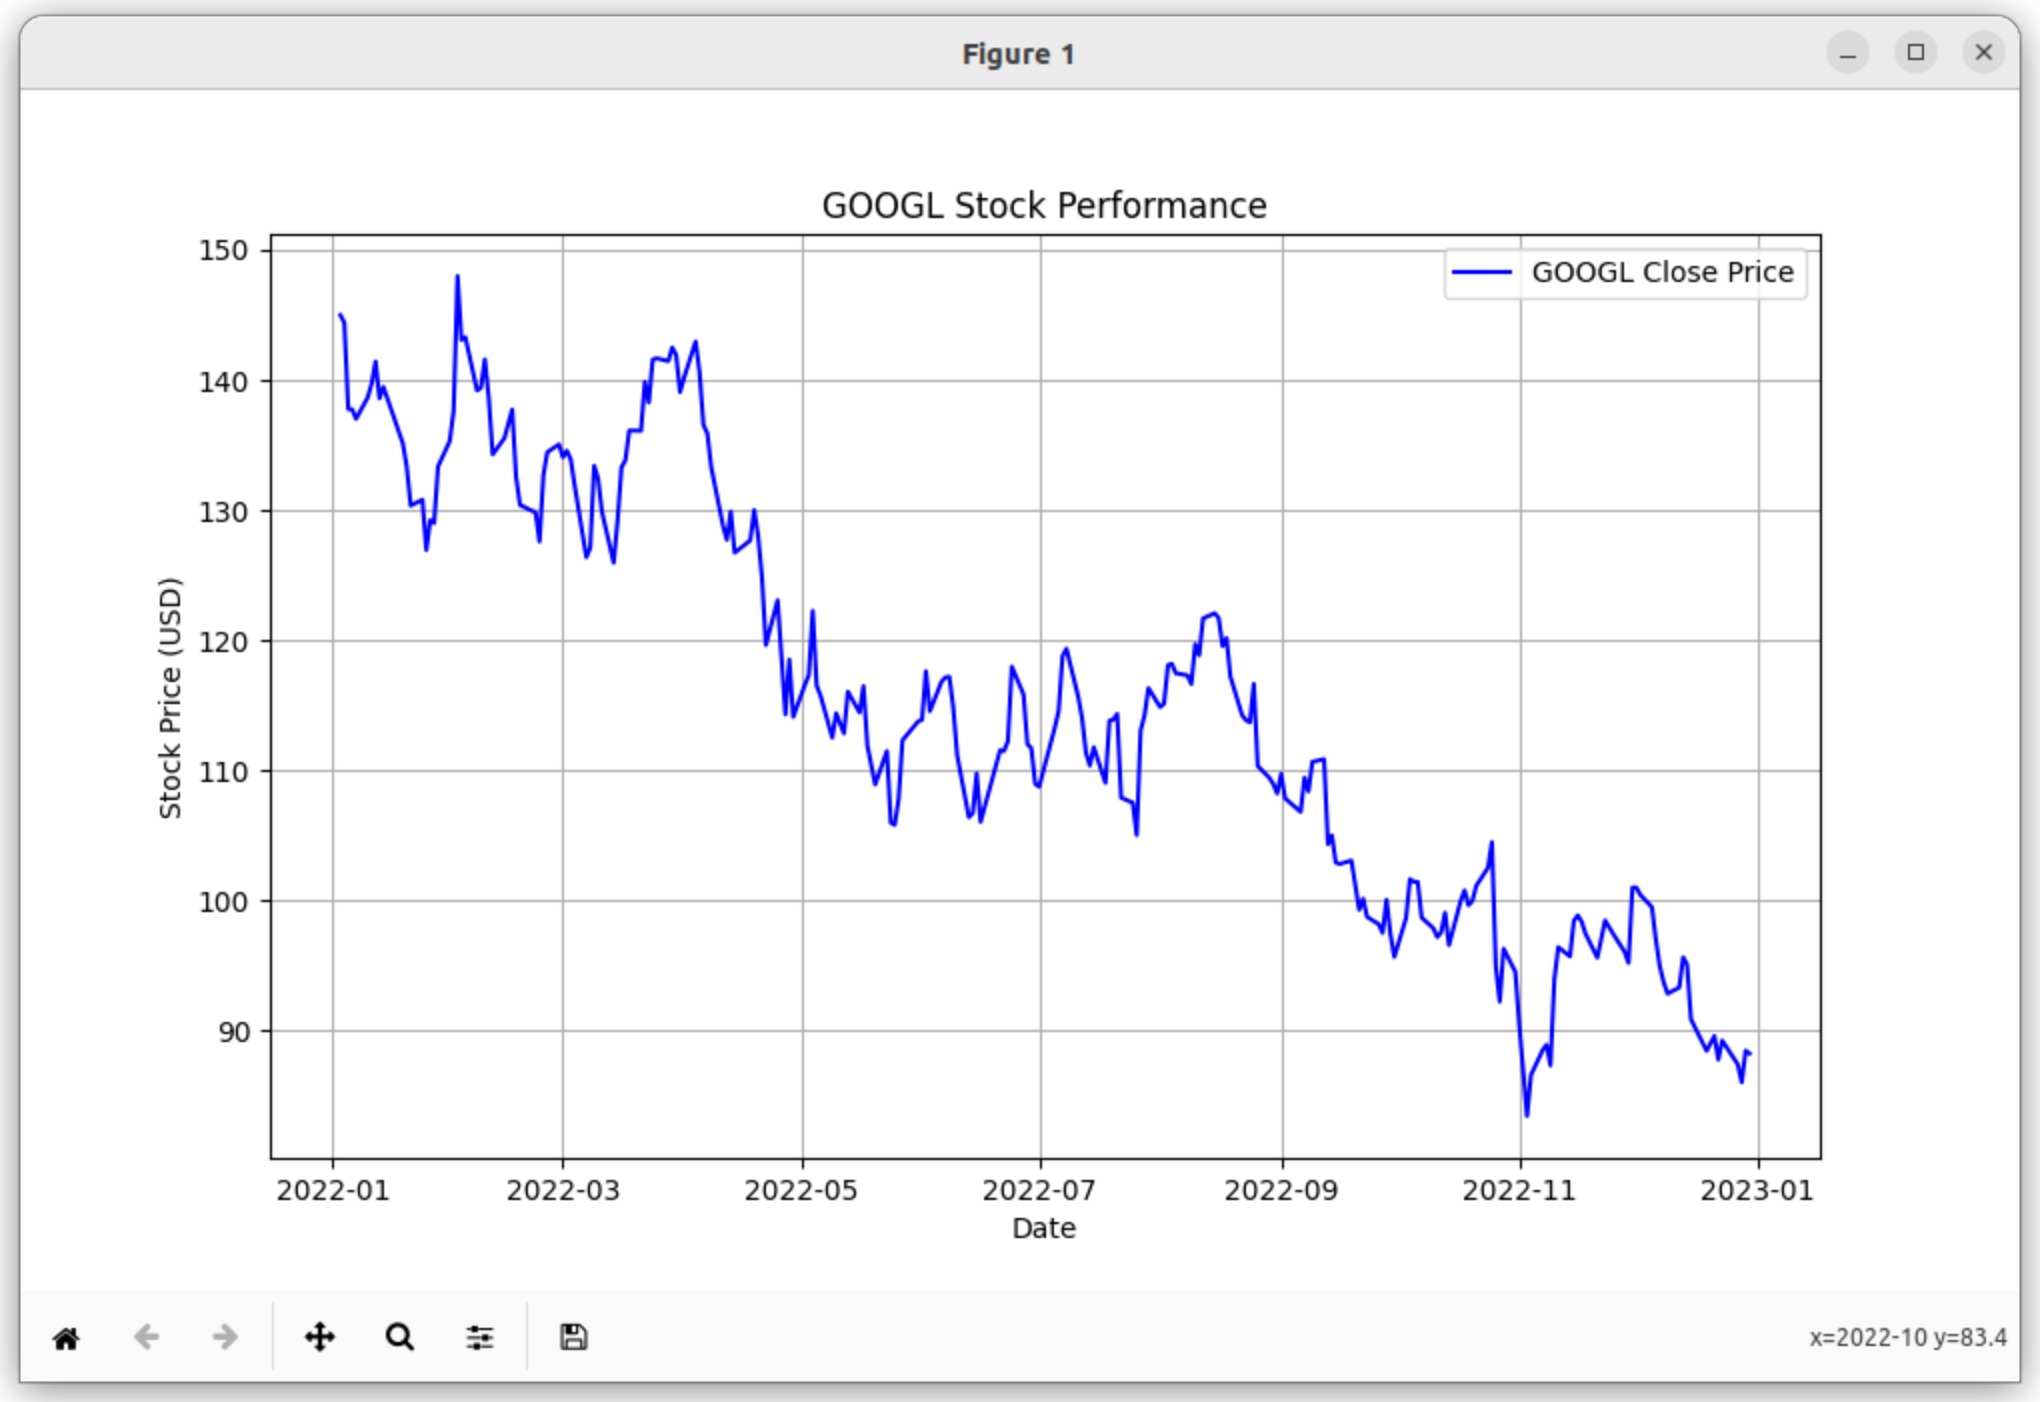
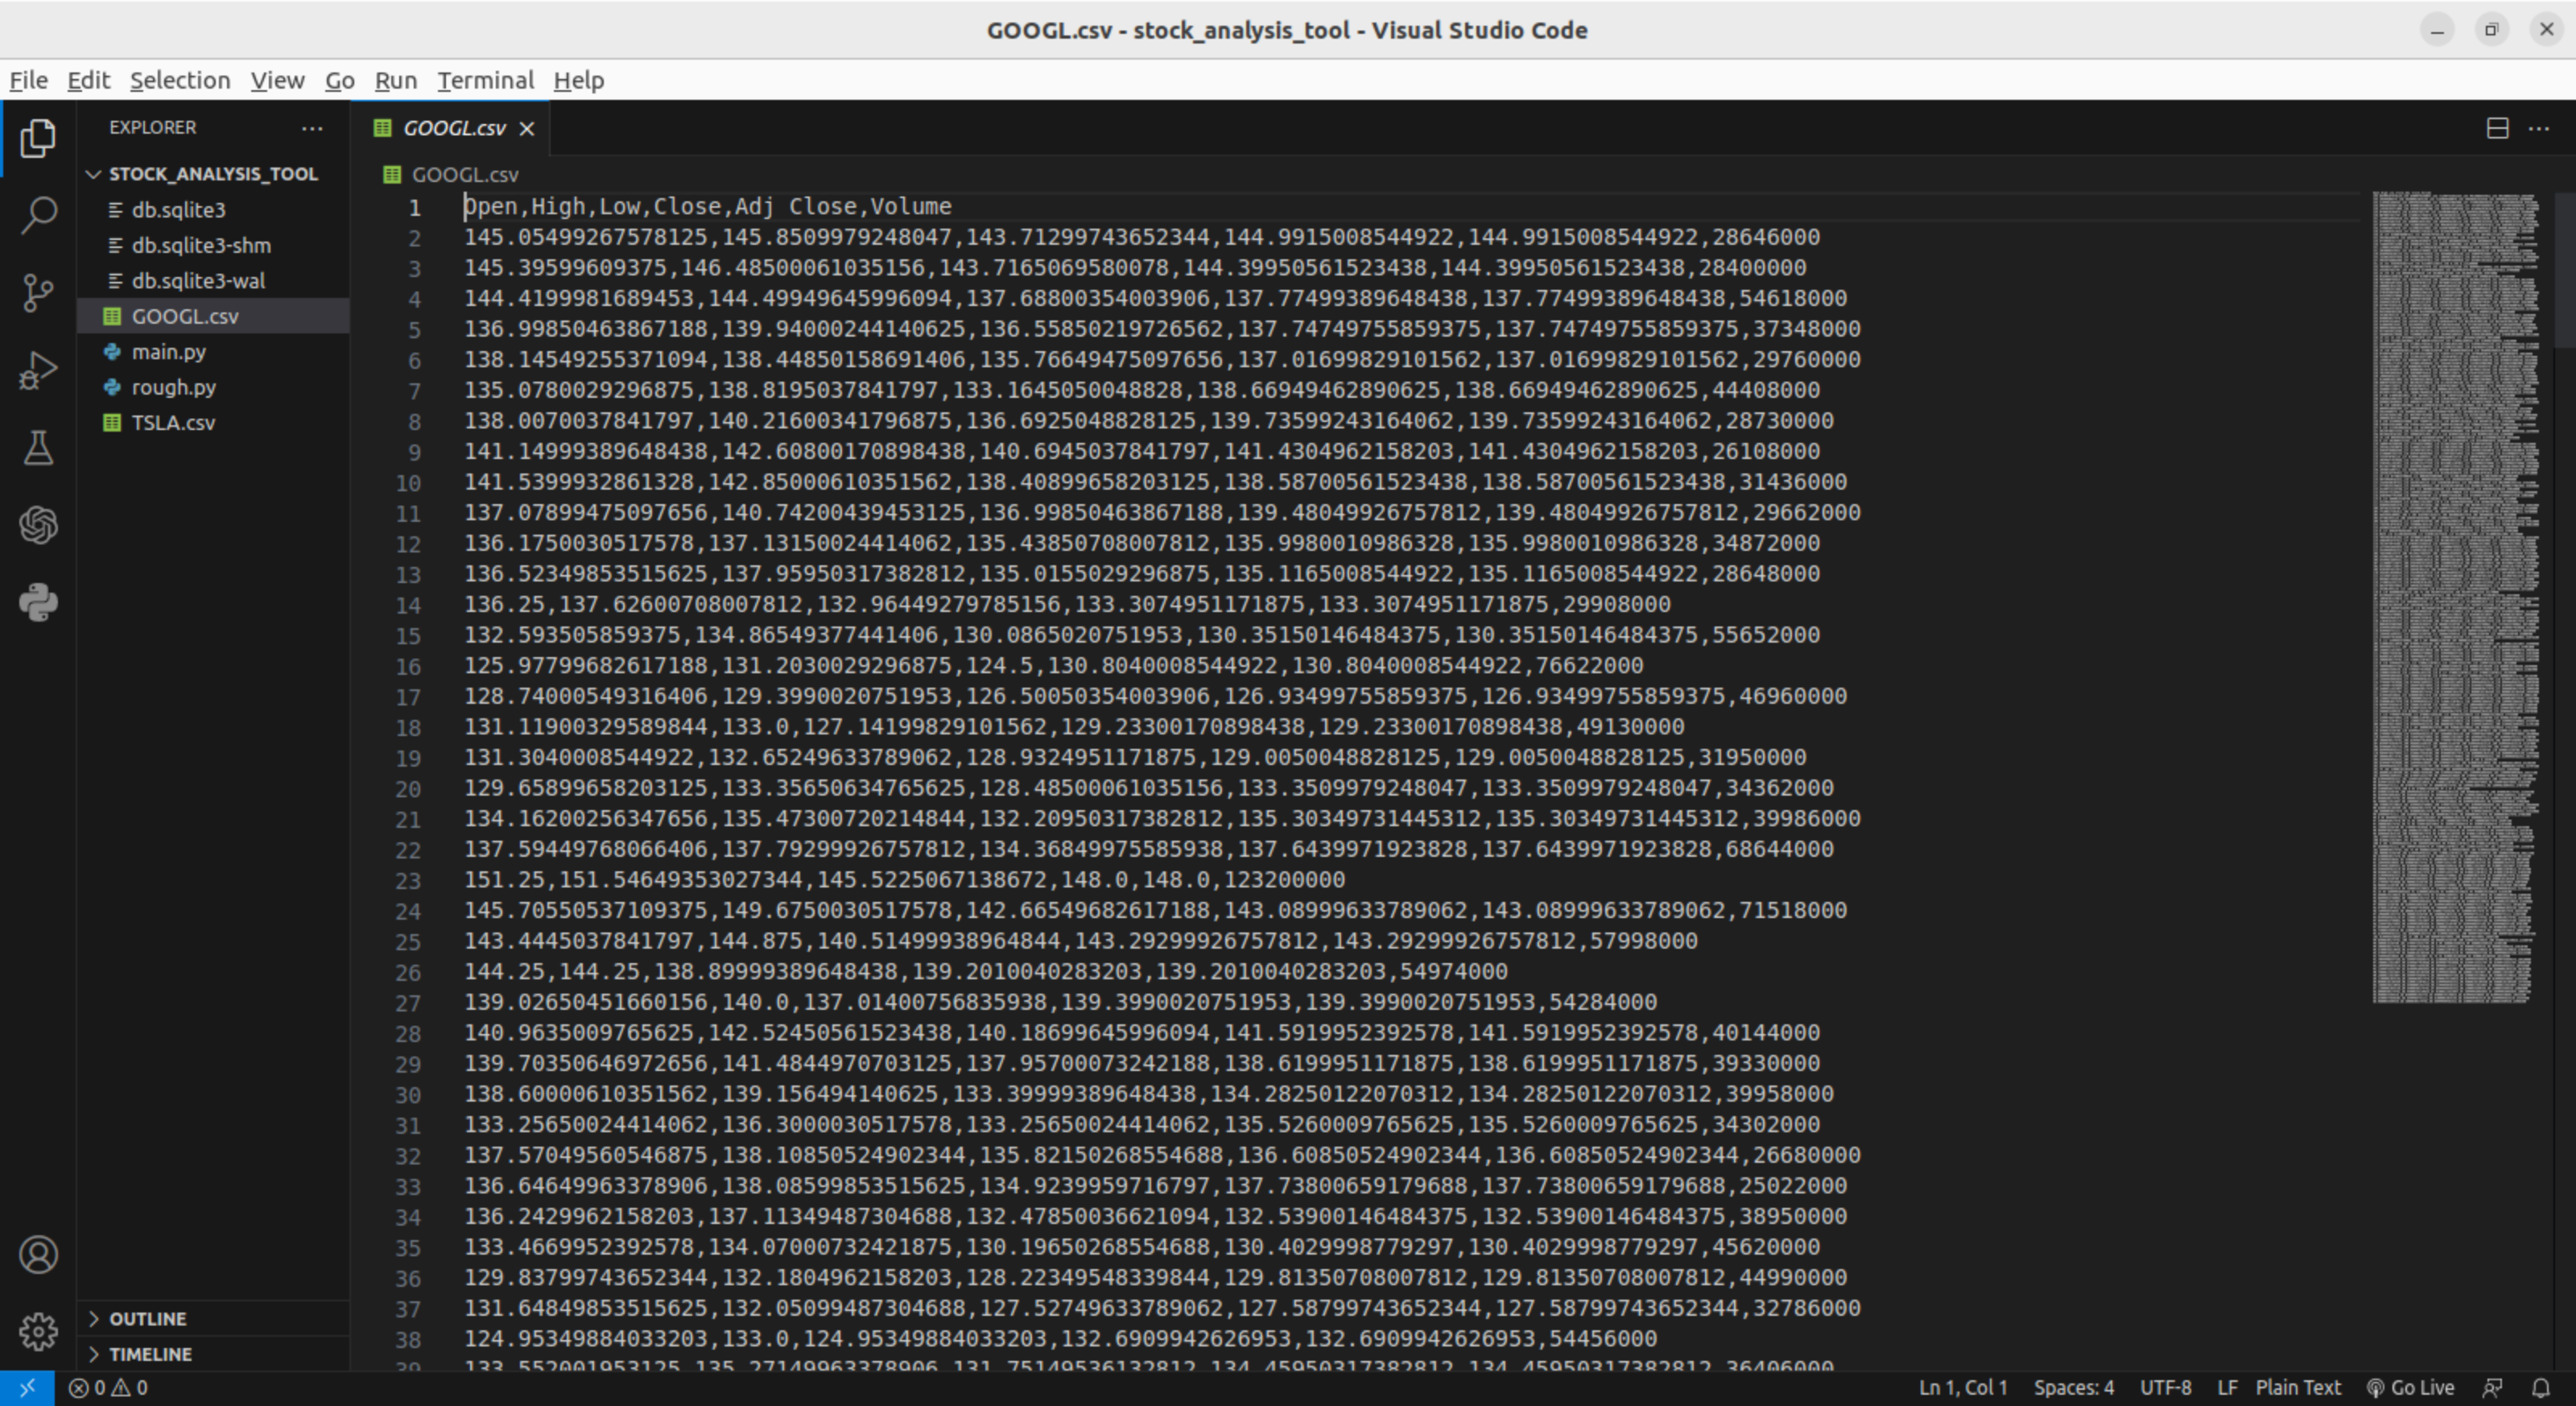
What it does
It stores data about stock and visualize the data in graph form.
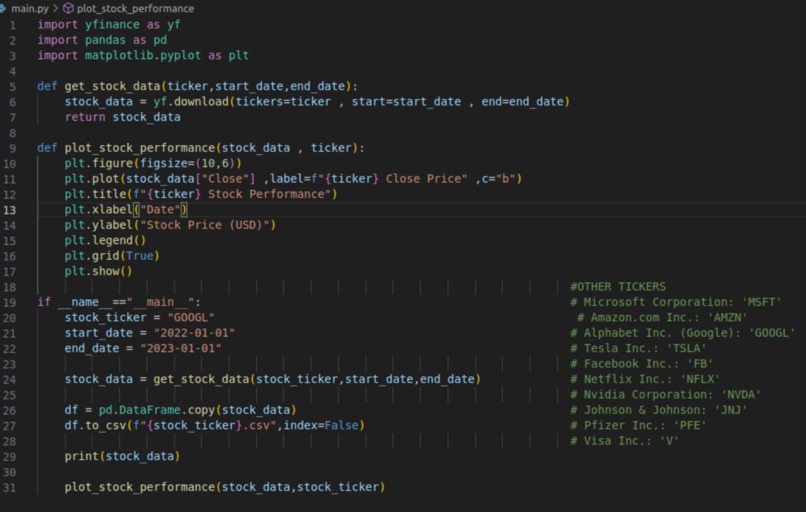
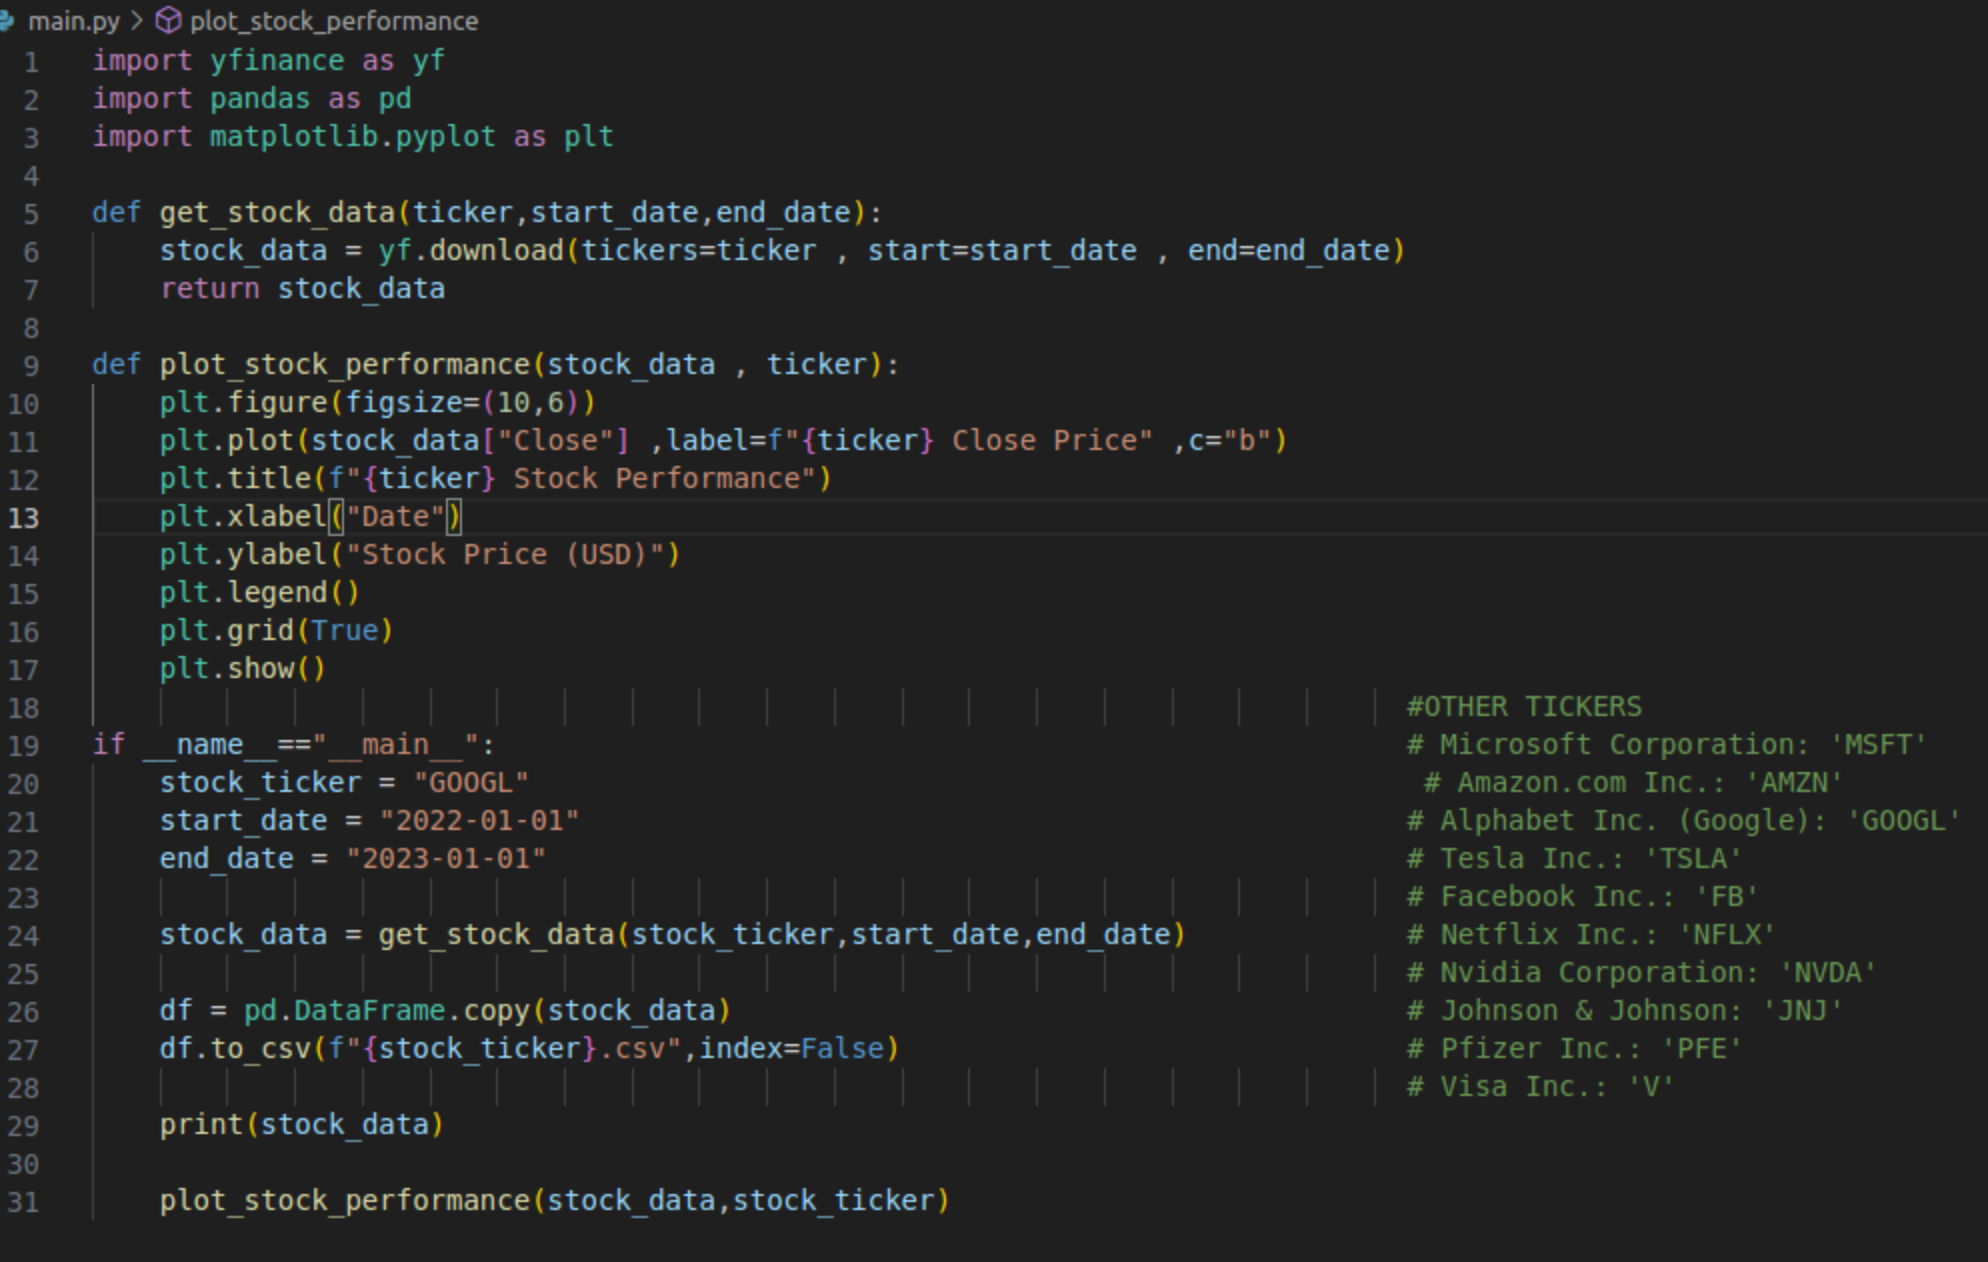
How we built it
Built it using matplotlib ,pandas and yfinance library.
Challenges we ran into
To showcase graph.
Accomplishments that we're proud of
Explore new library. Get insights of stocks.
What's next for Stock Analysis Tool
We can develop it into a app as a tool.
Built With
- matplotlib
- pandas
- yfinance

Log in or sign up for Devpost to join the conversation.