Live project
Inspiration
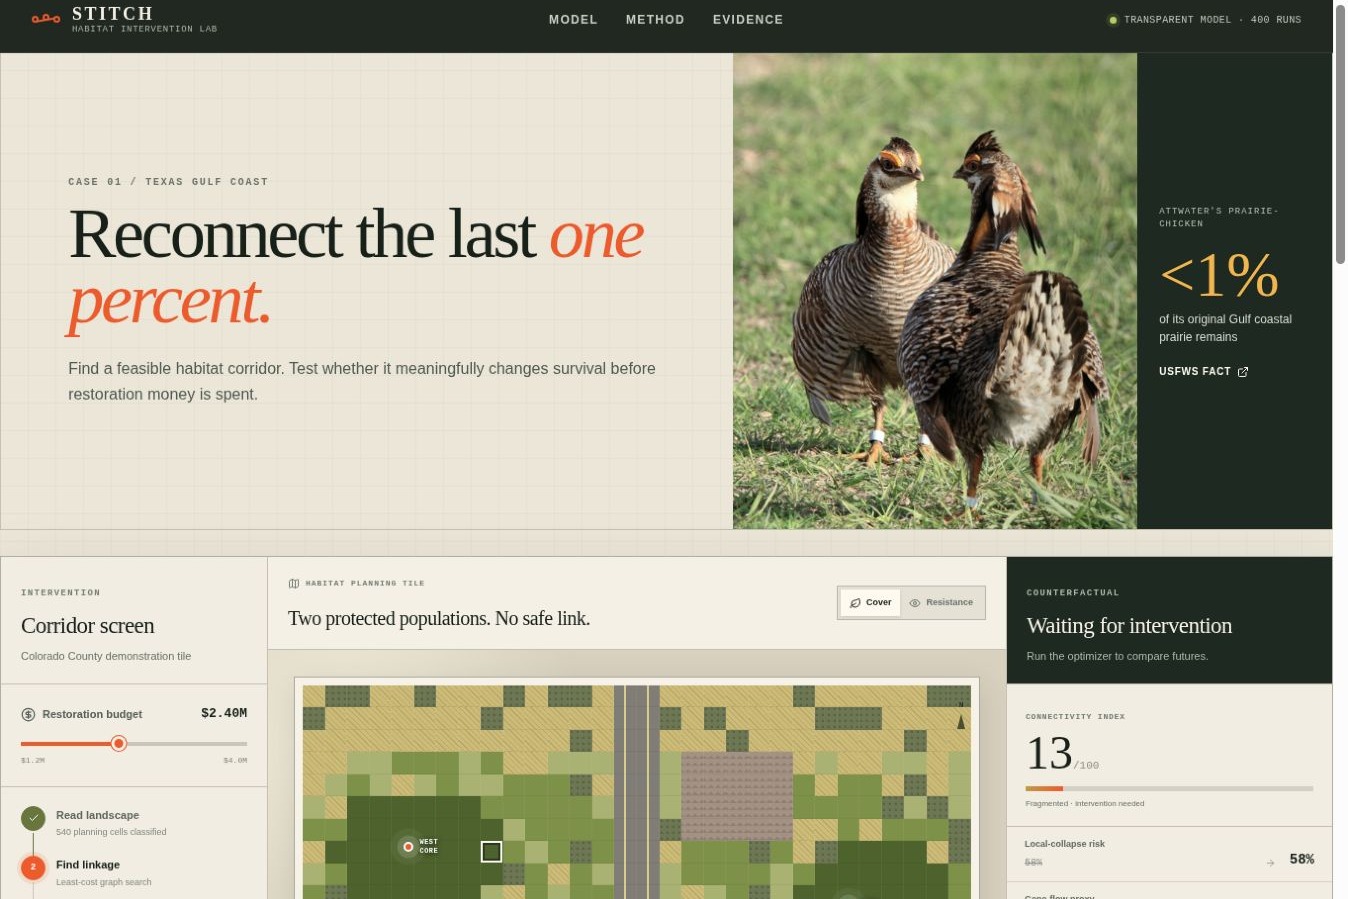
Less than 1% of the Gulf coastal prairie that once covered six million acres remains. The U.S. Fish & Wildlife Service says most surviving fragments are too small to support the endangered Attwater's prairie-chicken. Conservation is not only a question of protecting more acres; it is a question of reconnecting the right acres.
We wanted to turn habitat connectivity from a static map into a decision someone could test, challenge, and explain.
What it does
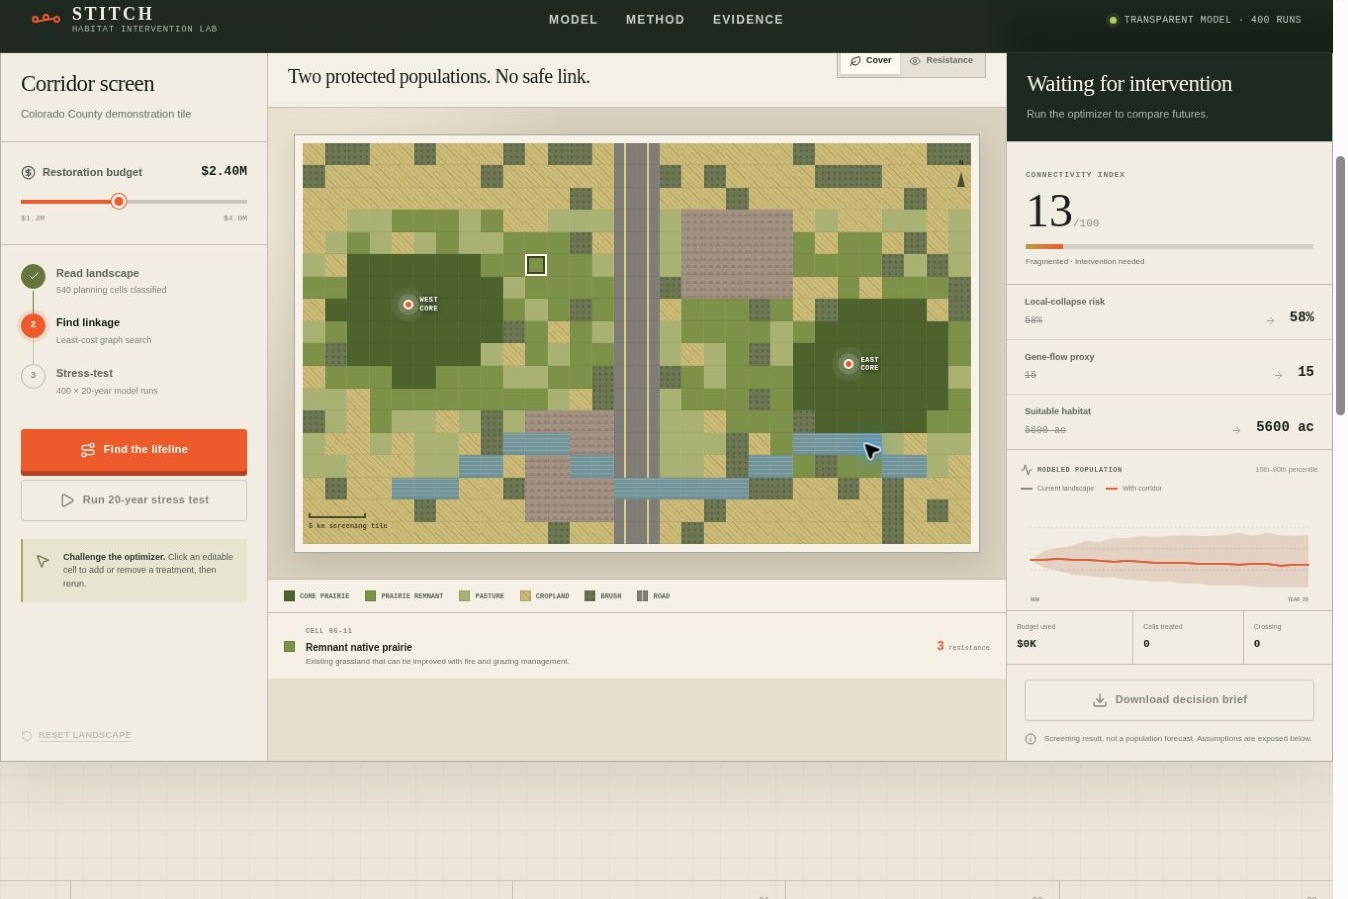
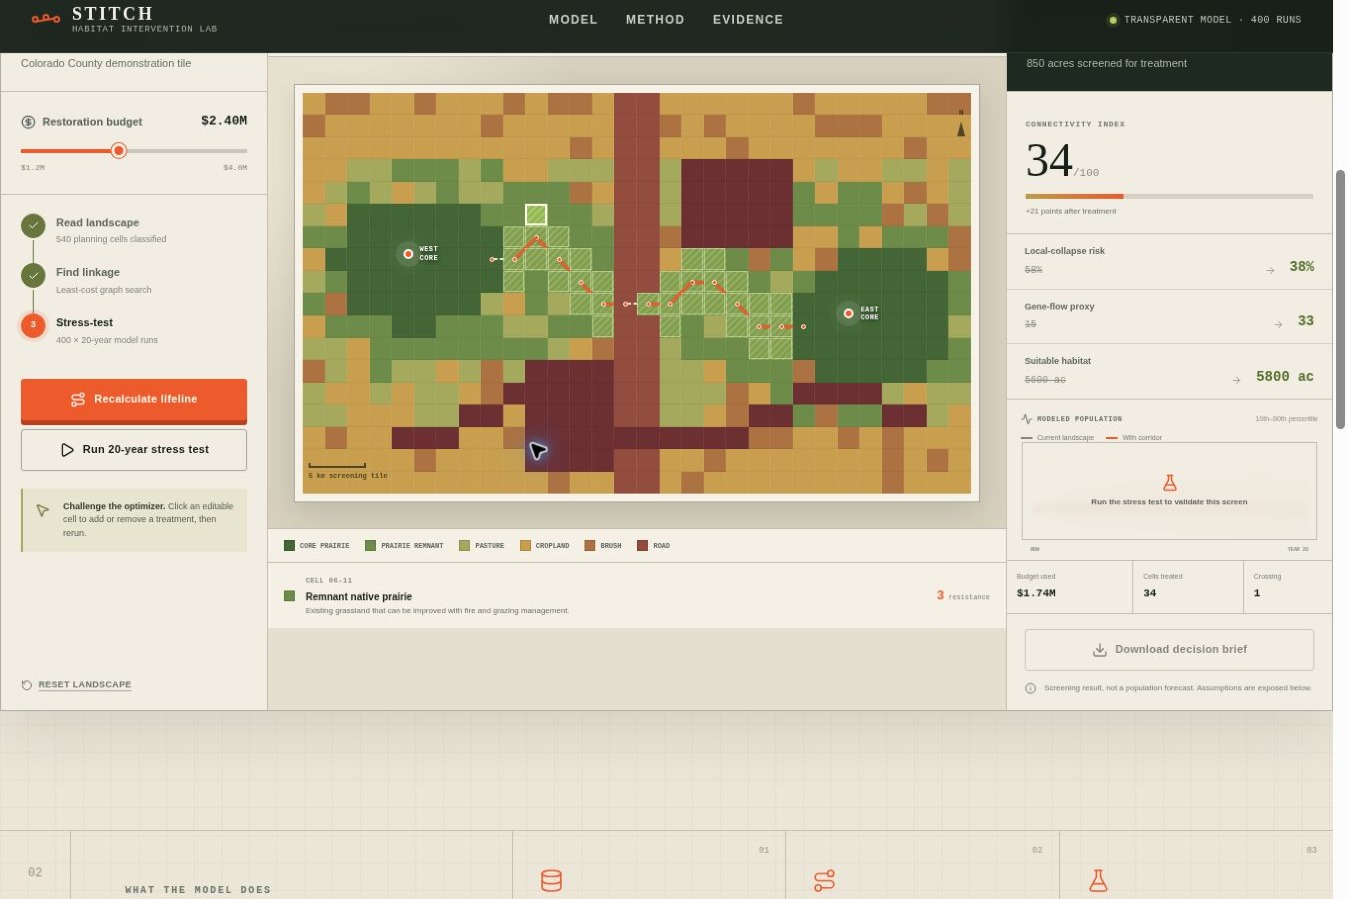
STITCH is an interactive habitat-intervention lab. A user sets a restoration budget and asks the system to connect two isolated protected populations. STITCH translates land cover into transparent movement resistance, suitability, and treatment cost; searches the landscape for the least-cost linkage; widens that centerline into a plausible treatment screen; and then compares the current landscape with the intervention across 400 seeded, 20-year ecological model runs.
The user can click any editable cell to challenge the optimizer, rerun the counterfactual, inspect each land class and assumption, and download an intervention brief.
The first case is the Attwater's prairie-chicken in Texas coastal prairie. The ecological context is real and cited. The demo tile and costs are clearly marked screening assumptions, because a conservation tool should never disguise uncertainty as fact.
How we built it
The interface is built with React, TypeScript, Vinext, Tailwind CSS, Radix/shadcn controls, and Lucide icons.
The planning engine is original TypeScript. It creates an eight-class habitat-resistance surface, runs a multi-source Dijkstra graph search between core prairie patches, combines ecological resistance with budget pressure, and expands the centerline into adjacent restorable cells.
The counterfactual engine runs a two-patch metapopulation model 400 times over 20 annual steps. Each run varies growth, carrying capacity, dispersal, directional rescue, and weather shocks with deterministic seeds. STITCH shows the median and 10th–90th percentile band instead of presenting one trajectory as certainty.
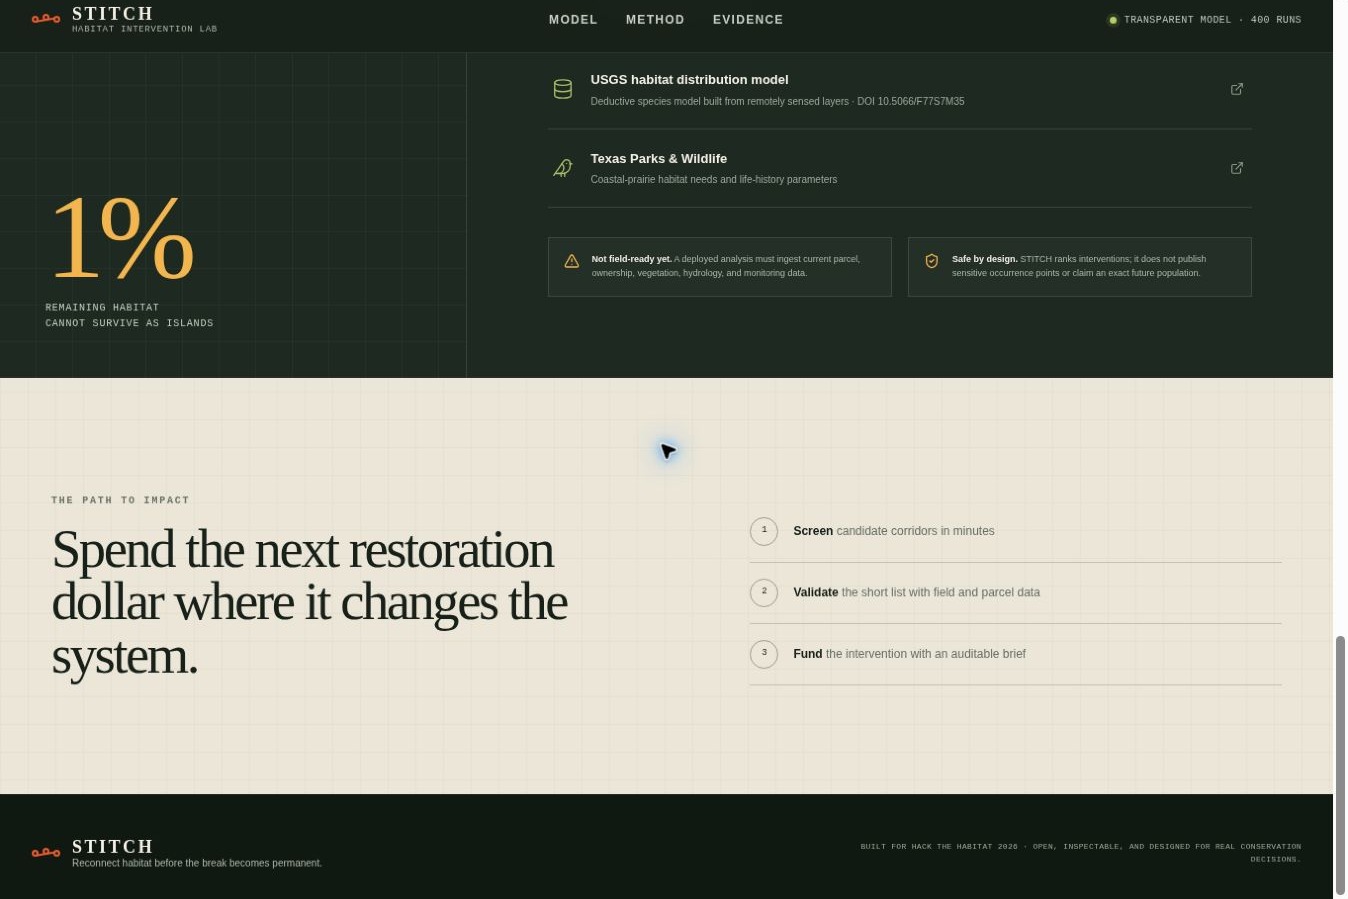
The model uses official species context from the U.S. Fish & Wildlife Service and Texas Parks & Wildlife, plus the published USGS Attwater's prairie-chicken habitat distribution model (DOI 10.5066/F77S7M35). Every external dataset, image, library, and AI-assisted development tool is attributed in the repository.
Challenges we ran into
The hardest design problem was honesty. It would have been easy to make a dramatic map that implied exact field knowledge we did not have. Instead, we separated sourced facts from demo assumptions, exposed the land-class parameters, used comparative indices, showed uncertainty bands, and labeled the output as a screen rather than a forecast.
The hardest technical problem was making the corridor action change the ecological system instead of drawing a pretty line. The graph search, treatment-width step, connectivity calculation, and stochastic rescue dynamics all had to connect so the before/after result had a traceable cause.
Accomplishments that we're proud of
- A complete end-to-end conservation decision loop rather than a generic environmental dashboard.
- A real, editable corridor optimizer that runs in the browser without a paid API.
- 400 transparent 20-year counterfactual runs with visible uncertainty.
- A local Texas case with primary-source ecological evidence.
- Explicit limits that make the tool more trustworthy, not less impressive.
- A polished, responsive interface that works with keyboard and touch input.
What we learned
Connectivity is not just a map property. It changes whether an isolated population can be recolonized after a bad year, whether individuals can move between patches, and whether conservation money creates a functioning system rather than another island.
We also learned that environmental software earns trust by exposing what it knows, what it assumes, and what must still be validated in the field.
What's next for STITCH
The next version would ingest current NLCD/USGS raster tiles, parcel boundaries, conservation ownership, hydrology, and protected monitoring data; support multiple species with different resistance surfaces; run multi-objective portfolio optimization across several corridors; and let field teams replace illustrative costs with local bids and easement estimates.
The product goal is simple: help conservation teams spend the next restoration dollar where it changes the system.
Sources and attribution
- U.S. Fish & Wildlife Service species profile
- USGS habitat distribution model, DOI 10.5066/F77S7M35
- Texas Parks & Wildlife species profile
- U.S. Fish & Wildlife Service photograph by John Magera
Third-party libraries and OpenAI Codex assistance are fully attributed in the public repository.
Built With
- openai
- radix
- stochastic
- tailwind

Log in or sign up for Devpost to join the conversation.