-
-
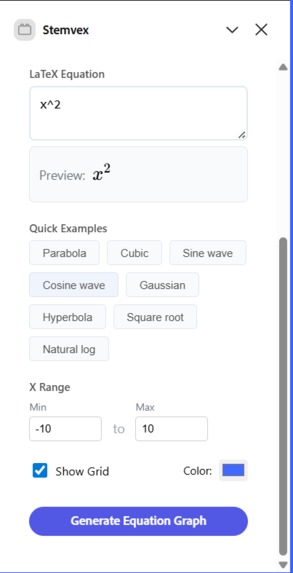
Stemvex Equations 1
-
Stemvex Equations 2
-

Stemvex Digitizer 1
-
Stemvex Digitizer 2
-
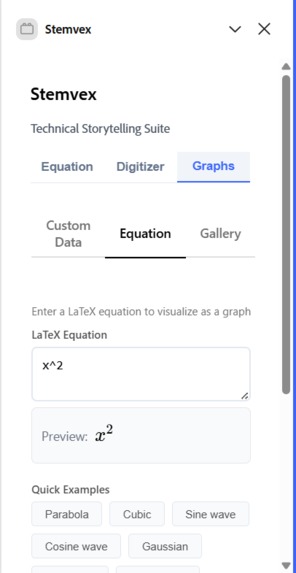
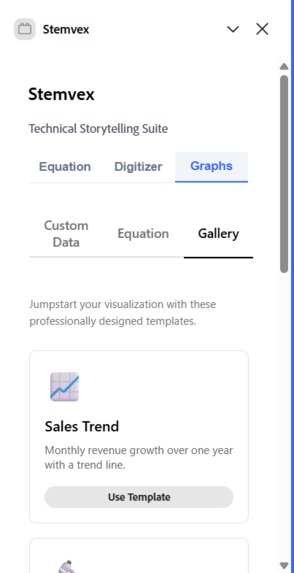
Stemvex Graphs 1
-
Stemvex Graphs 2
-

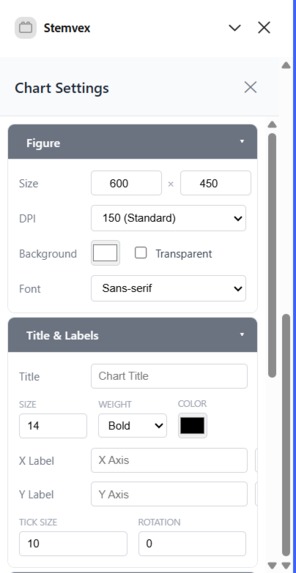
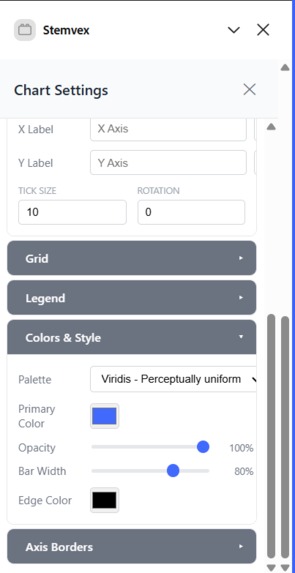
Stemvex Graphs 3
-
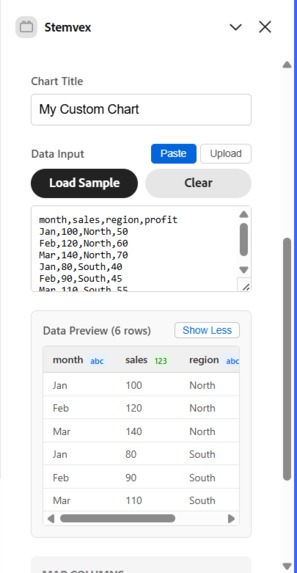
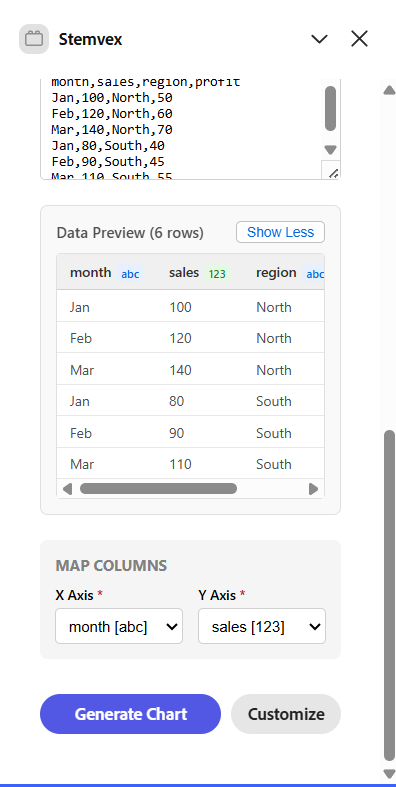
Stemvex Graphs Custom 1
-
Stemvex Graphs Custom 2
-
Stemvex Graphs Equations 1
-
Stemvex Graphs Equations 1
-
Stemvex Graphs Gallery 1
-
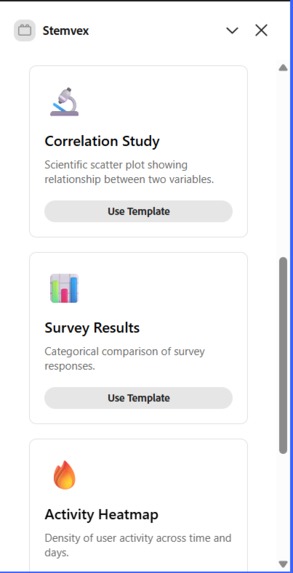
Stemvex Graphs Gallery 2
-

Example page for equations
-
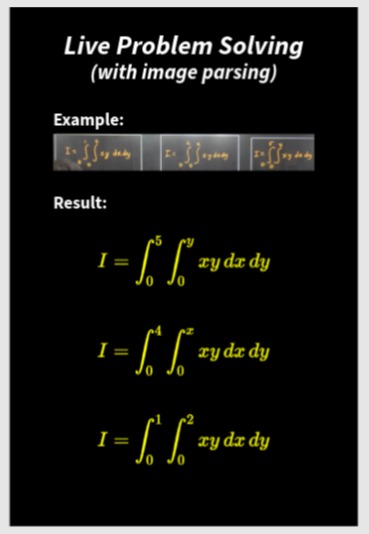
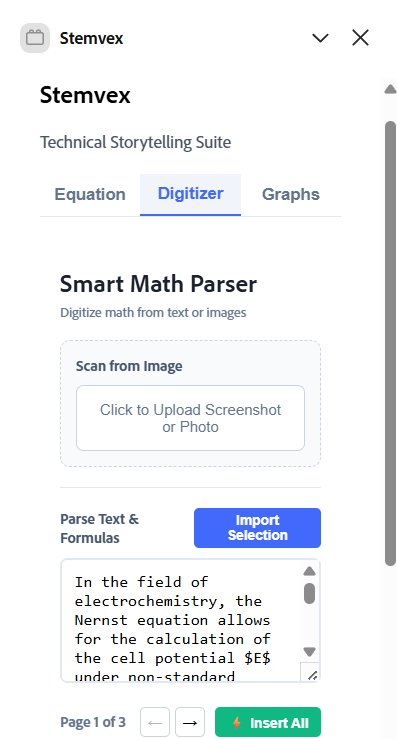
Example page for Image Parser
-
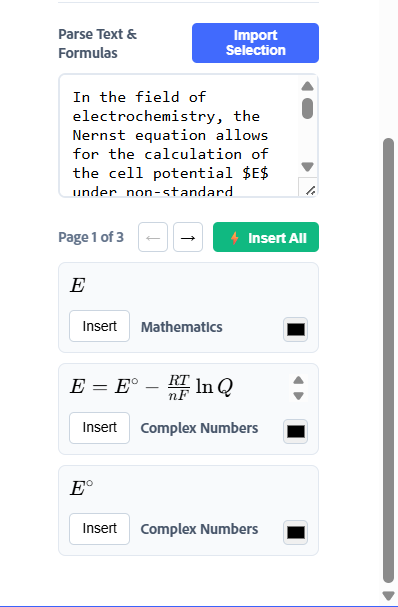
Example page for Text Parser
-
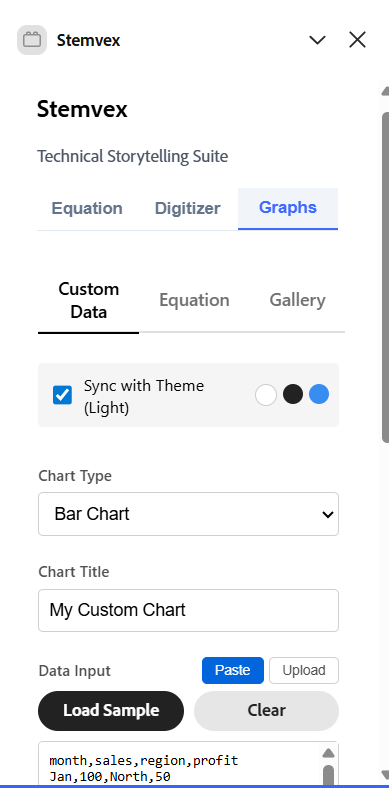
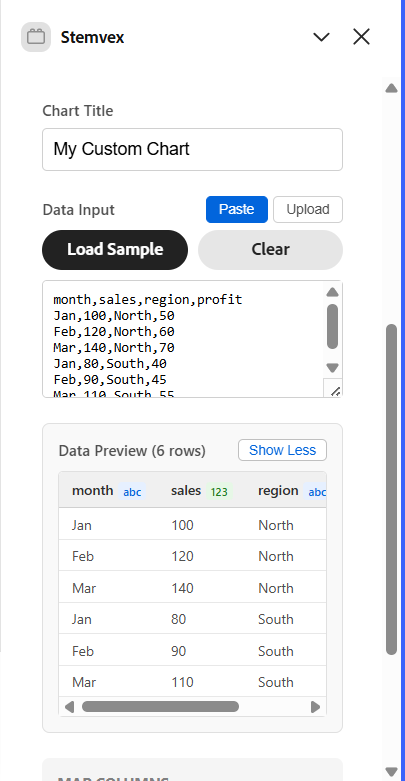
Example page for Graphs


Inspiration
Stemvex began with a simple observation: people who teach or explain complex ideas struggle more than they should. It’s not just engineers writing equations. Professors explaining higher mathematics, students preparing presentations, researchers visualizing results, or even educators trying to show something as basic as a bell curve often have to jump between multiple tools. They write LaTeX elsewhere, export images, paste them into slides, tweak sizing, and repeat losing clarity and time along the way. Stemvex exists to remove that friction. The goal is to let ideas flow directly onto the canvas, so mathematical thinking, data, and explanation live naturally alongside design inside Adobe Express.
What it does
Stemvex brings advanced mathematical and scientific expression directly into Adobe Express, making it possible to explain complex ideas visually without leaving the canvas.
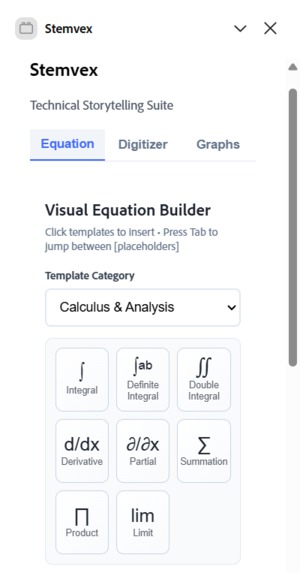
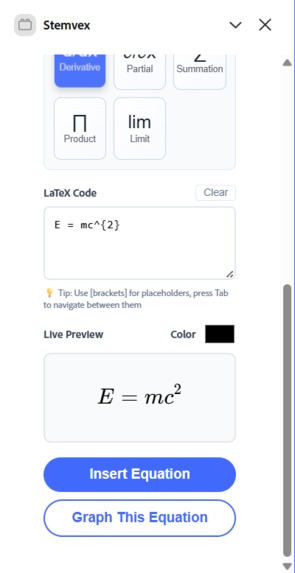
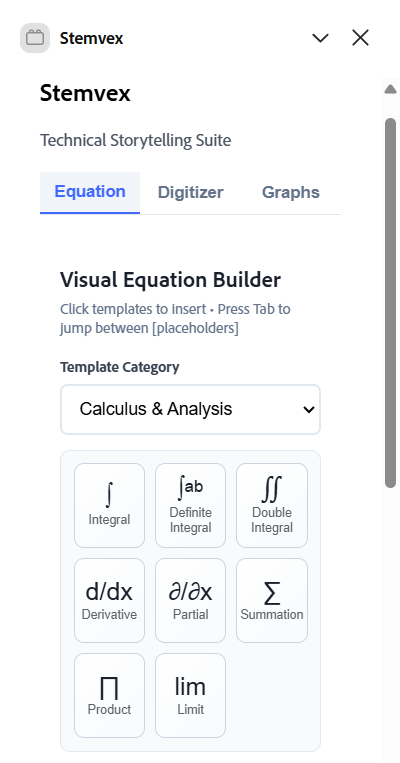
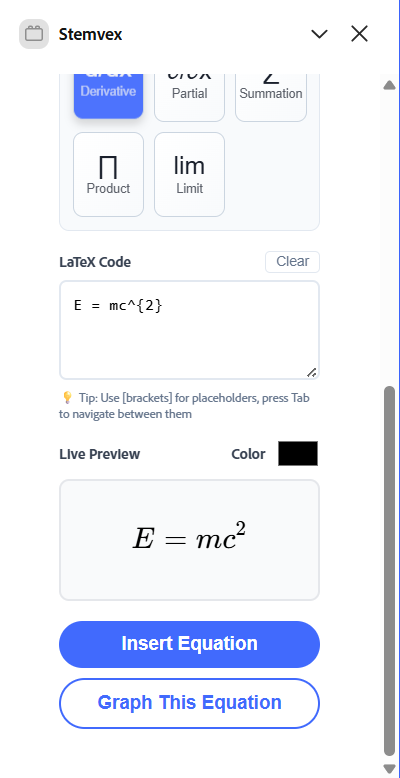
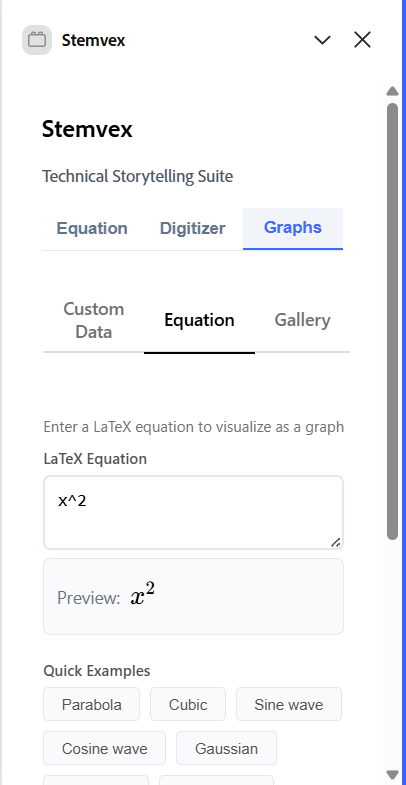
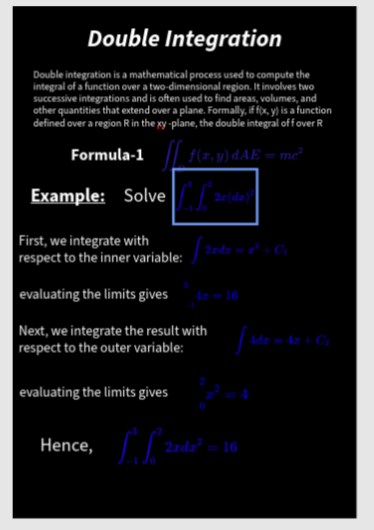
1)Advanced Equation Authoring Stemvex supports far more than basic formulas. Users can write any level of mathematics from simple expressions to double integrals, summations, limits, piecewise functions, and symbolic notation using LaTeX. These equations are rendered with publication quality clarity and inserted into the Express document as fully editable design elements.
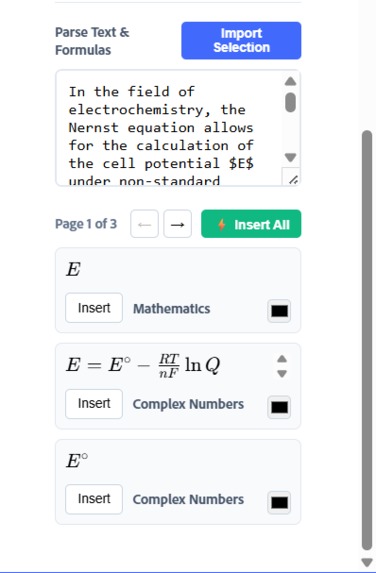
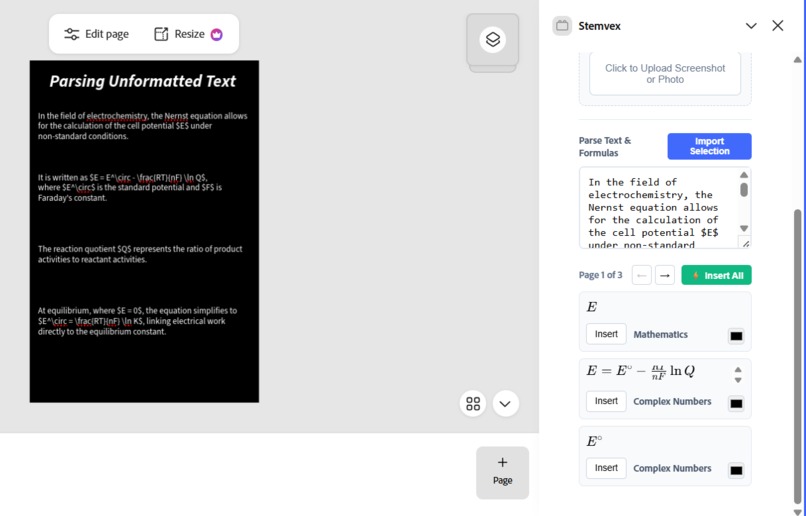
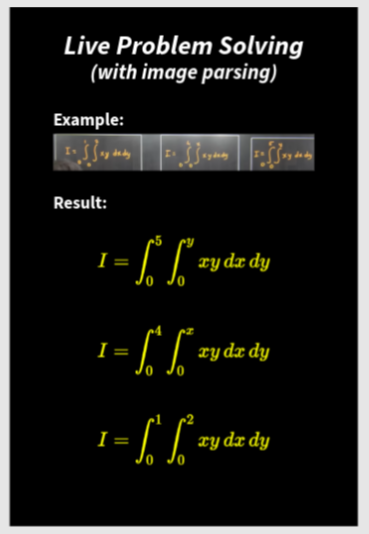
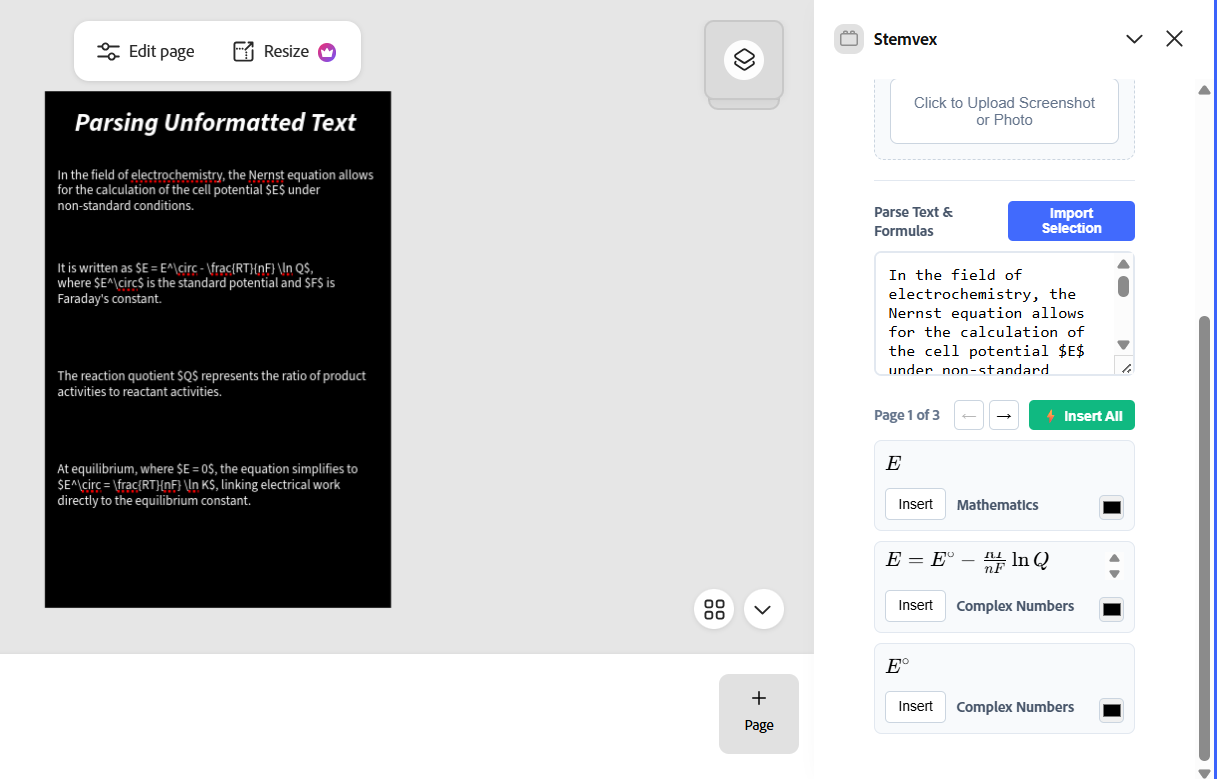
2)Reverse Parsing & Digitization Stemvex can extract structured meaning from unstructured sources. Users can paste or upload images and text paragraphs containing mathematical content, and the add-on parses them to recover the underlying equations, symbols, and structure. This allows handwritten notes, scanned material, or copied explanations to be converted back into clean, reusable mathematical representations.
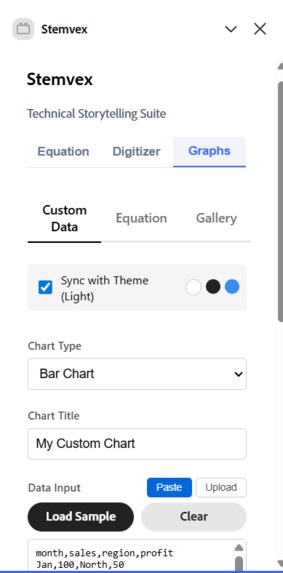
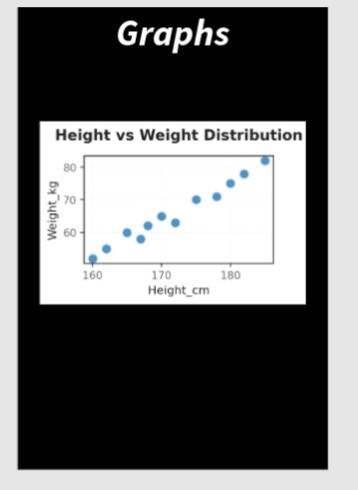
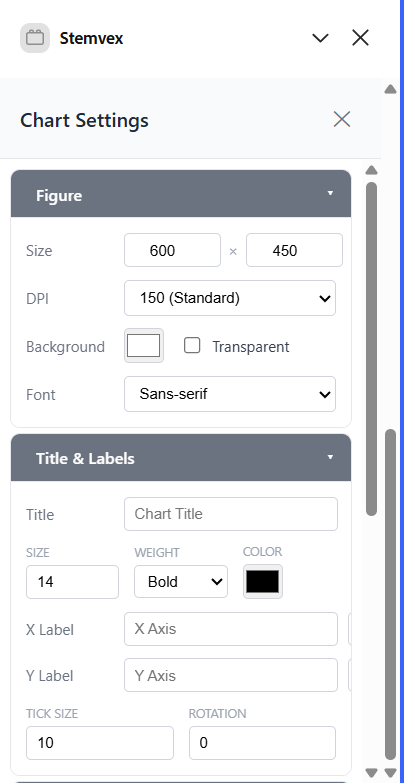
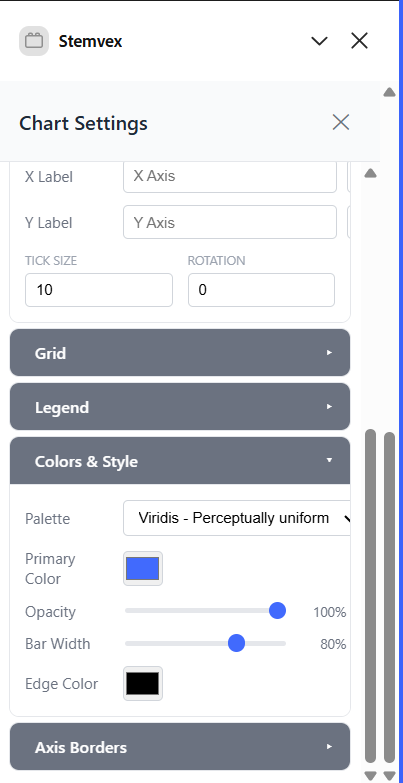
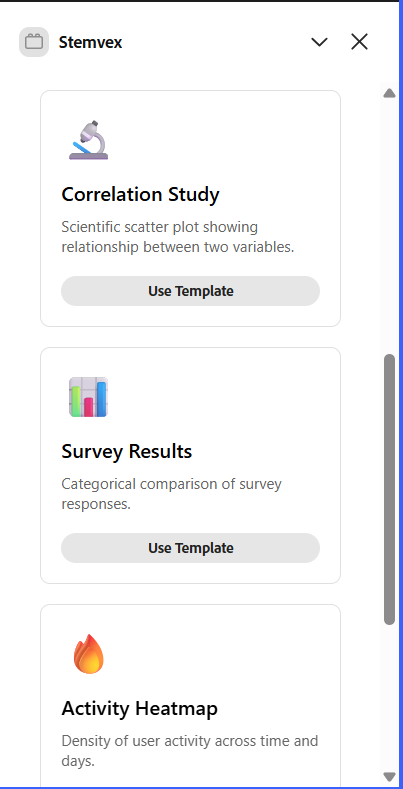
3)Graph & Visualization Generation Stemvex generates complex scientific and explanatory graphs directly from equations or datasets. This includes everything from standard plots to statistical distributions (e.g., bell curves), multi-series scientific graphs, and heatmaps. Users can create visualizations either by supplying raw data or by defining equations, making it equally useful for teaching, analysis, and presentation.
By unifying equations, interpretation, and visualization inside Adobe Express, Stemvex turns the canvas into a true space for technical storytelling not just decoration.
How we built it
Stemvex is implemented as an Adobe Express add-on structured around three core workflows Equations, Digitizer, and Graphs each designed to turn mathematical and scientific intent into native visual elements on the Express canvas. The add-on follows Adobe Express’s two runtime architecture, where all rendering and computation happen in the UI runtime (React + TypeScript), while document mutations are safely handled in the Document Sandbox. For equations, a dedicated MathEngine renders LaTeX of any complexity (including multi-line expressions and double integrals) into HTML using KaTeX, then rasterizes it with html2canvas to produce a high-resolution PNG with controlled sizing and transparency. This image is sent across the UI <-> sandbox bridge as an ArrayBuffer and inserted into the document using editor.loadBitmapImage() and editor.createImageContainer() within queueAsyncEdit, making equations fully movable and resizable design elements. For graphs, the UI builds a structured PlotRequest from equations or tabular data and POSTs it to a lightweight local plotting backend (http://localhost:8000), which returns publication-quality visualizations such as line, scatter, bar, histogram, boxplot, and heatmap plots that are inserted into the canvas using the same sandbox-safe pipeline, ensuring consistent visual quality and seamless integration across all workflows.
Challenges we ran into
One of the biggest challenges was working within the constraints of Adobe Express’s sandboxed iframe environment. Add-ons do not have access to true OS level capabilities, such as native screen capture, which meant features that might seem straightforward required thoughtful fallback experiences. Instead of relying on blocked APIs, we designed upload and paste first workflows that feel natural to educators and presenters while remaining compliant with platform restrictions. Another core challenge was that Adobe Express does not provide native mathematical primitives there is no built in support for equations, symbols, or structured math layouts. To bridge this gap, we had to generate equations as images ourselves while ensuring they still behaved like first class design elements. Achieving output that consistently “looks good in slides” required careful handling of font rendering, sizing, DPI, scaling, padding, and transparency when converting KaTeX rendered math into PNGs. Small inaccuracies here quickly become noticeable in classrooms and presentations. On the visualization side, building a flexible graphing system was non-trivial. Users may want to map columns to x, y, color, or grouping dimensions in many different ways, often from imperfect real-world CSV or XLSX files. This required robust data parsing, type inference, and validation logic to reliably generate correct scientific plots without overwhelming non-technical users. Overall, these challenges pushed us to design Stemvex not just as a technical solution, but as a carefully constrained system that works with Adobe Express rather than against it, delivering advanced mathematical capabilities within a platform never originally designed for them.
Accomplishments that we're proud of
We successfully built an end to end system that brings advanced mathematics and scientific visualization into Adobe Express, a platform with no native math support, and made it feel natural to use. Typed or digitized equations ranging from simple formulas to complex multi integral expressions can now be rendered with high visual quality and inserted into the canvas as fully movable, resizable elements through a sandbox safe pipeline. We also implemented a flexible graphing framework capable of generating complex scientific plots from both equations and real-world datasets, while handling imperfect CSV/XLSX inputs gracefully. Most importantly, we unified equations, digitization, and graphs into a clean, tab based experience with shared state, allowing users to move seamlessly between explaining concepts and designing visuals without losing context.
What we learned
We learned that building powerful features inside Adobe Express is as much about working with platform constraints as it is about technical execution. The two runtime architecture taught us to clearly separate DOM heavy rendering from document mutation, which made the system more reliable and predictable. We also learned that since Adobe Express has no native support for mathematical structures, creating math first capabilities required treating equations and graphs as carefully engineered visual assets rather than simple text. Designing for educators and presenters reinforced the importance of visual clarity small choices around scaling, spacing, and defaults matter greatly when ideas are being explained, not just displayed. Finally, modularizing math rendering, data parsing, and plotting logic helped us iterate faster and debug more confidently, proving that thoughtful architecture directly translates to better user experience.
What's next for Stemvex
Next, we want to make Stemvex truly frictionless for educators, students, and presenters by removing setup barriers and deepening core workflows. We plan to bundle or publish the plotting backend so advanced graph generation works out of the box, without relying on localhost, making it instantly usable for judges and first time users. We’ll enhance the Digitizer experience with paste first capture, in-app cropping, and smarter parsing of selected content, allowing users to quickly convert notes, textbook material, or scanned explanations into clean equations and visuals. On the quality side, we aim to introduce equation sizing presets, color themes, and reusable history/templates, helping users maintain consistency across lectures and presentations. Together, these improvements move Stemvex closer to becoming a native mathematical and scientific layer inside Adobe Express, focused on helping people explain complex ideas faster and more clearly.
Built With
- css
- html
- html2canvas
- javascript
- katex
- markdown
- matplotlib
- numpy
- pandas
- python
- react
- seaborn
- swc-react
- sympy
- typescript


Log in or sign up for Devpost to join the conversation.