-
-
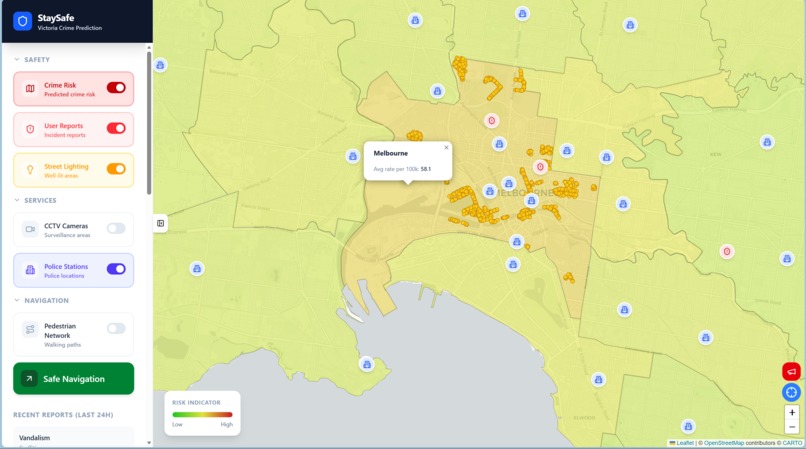
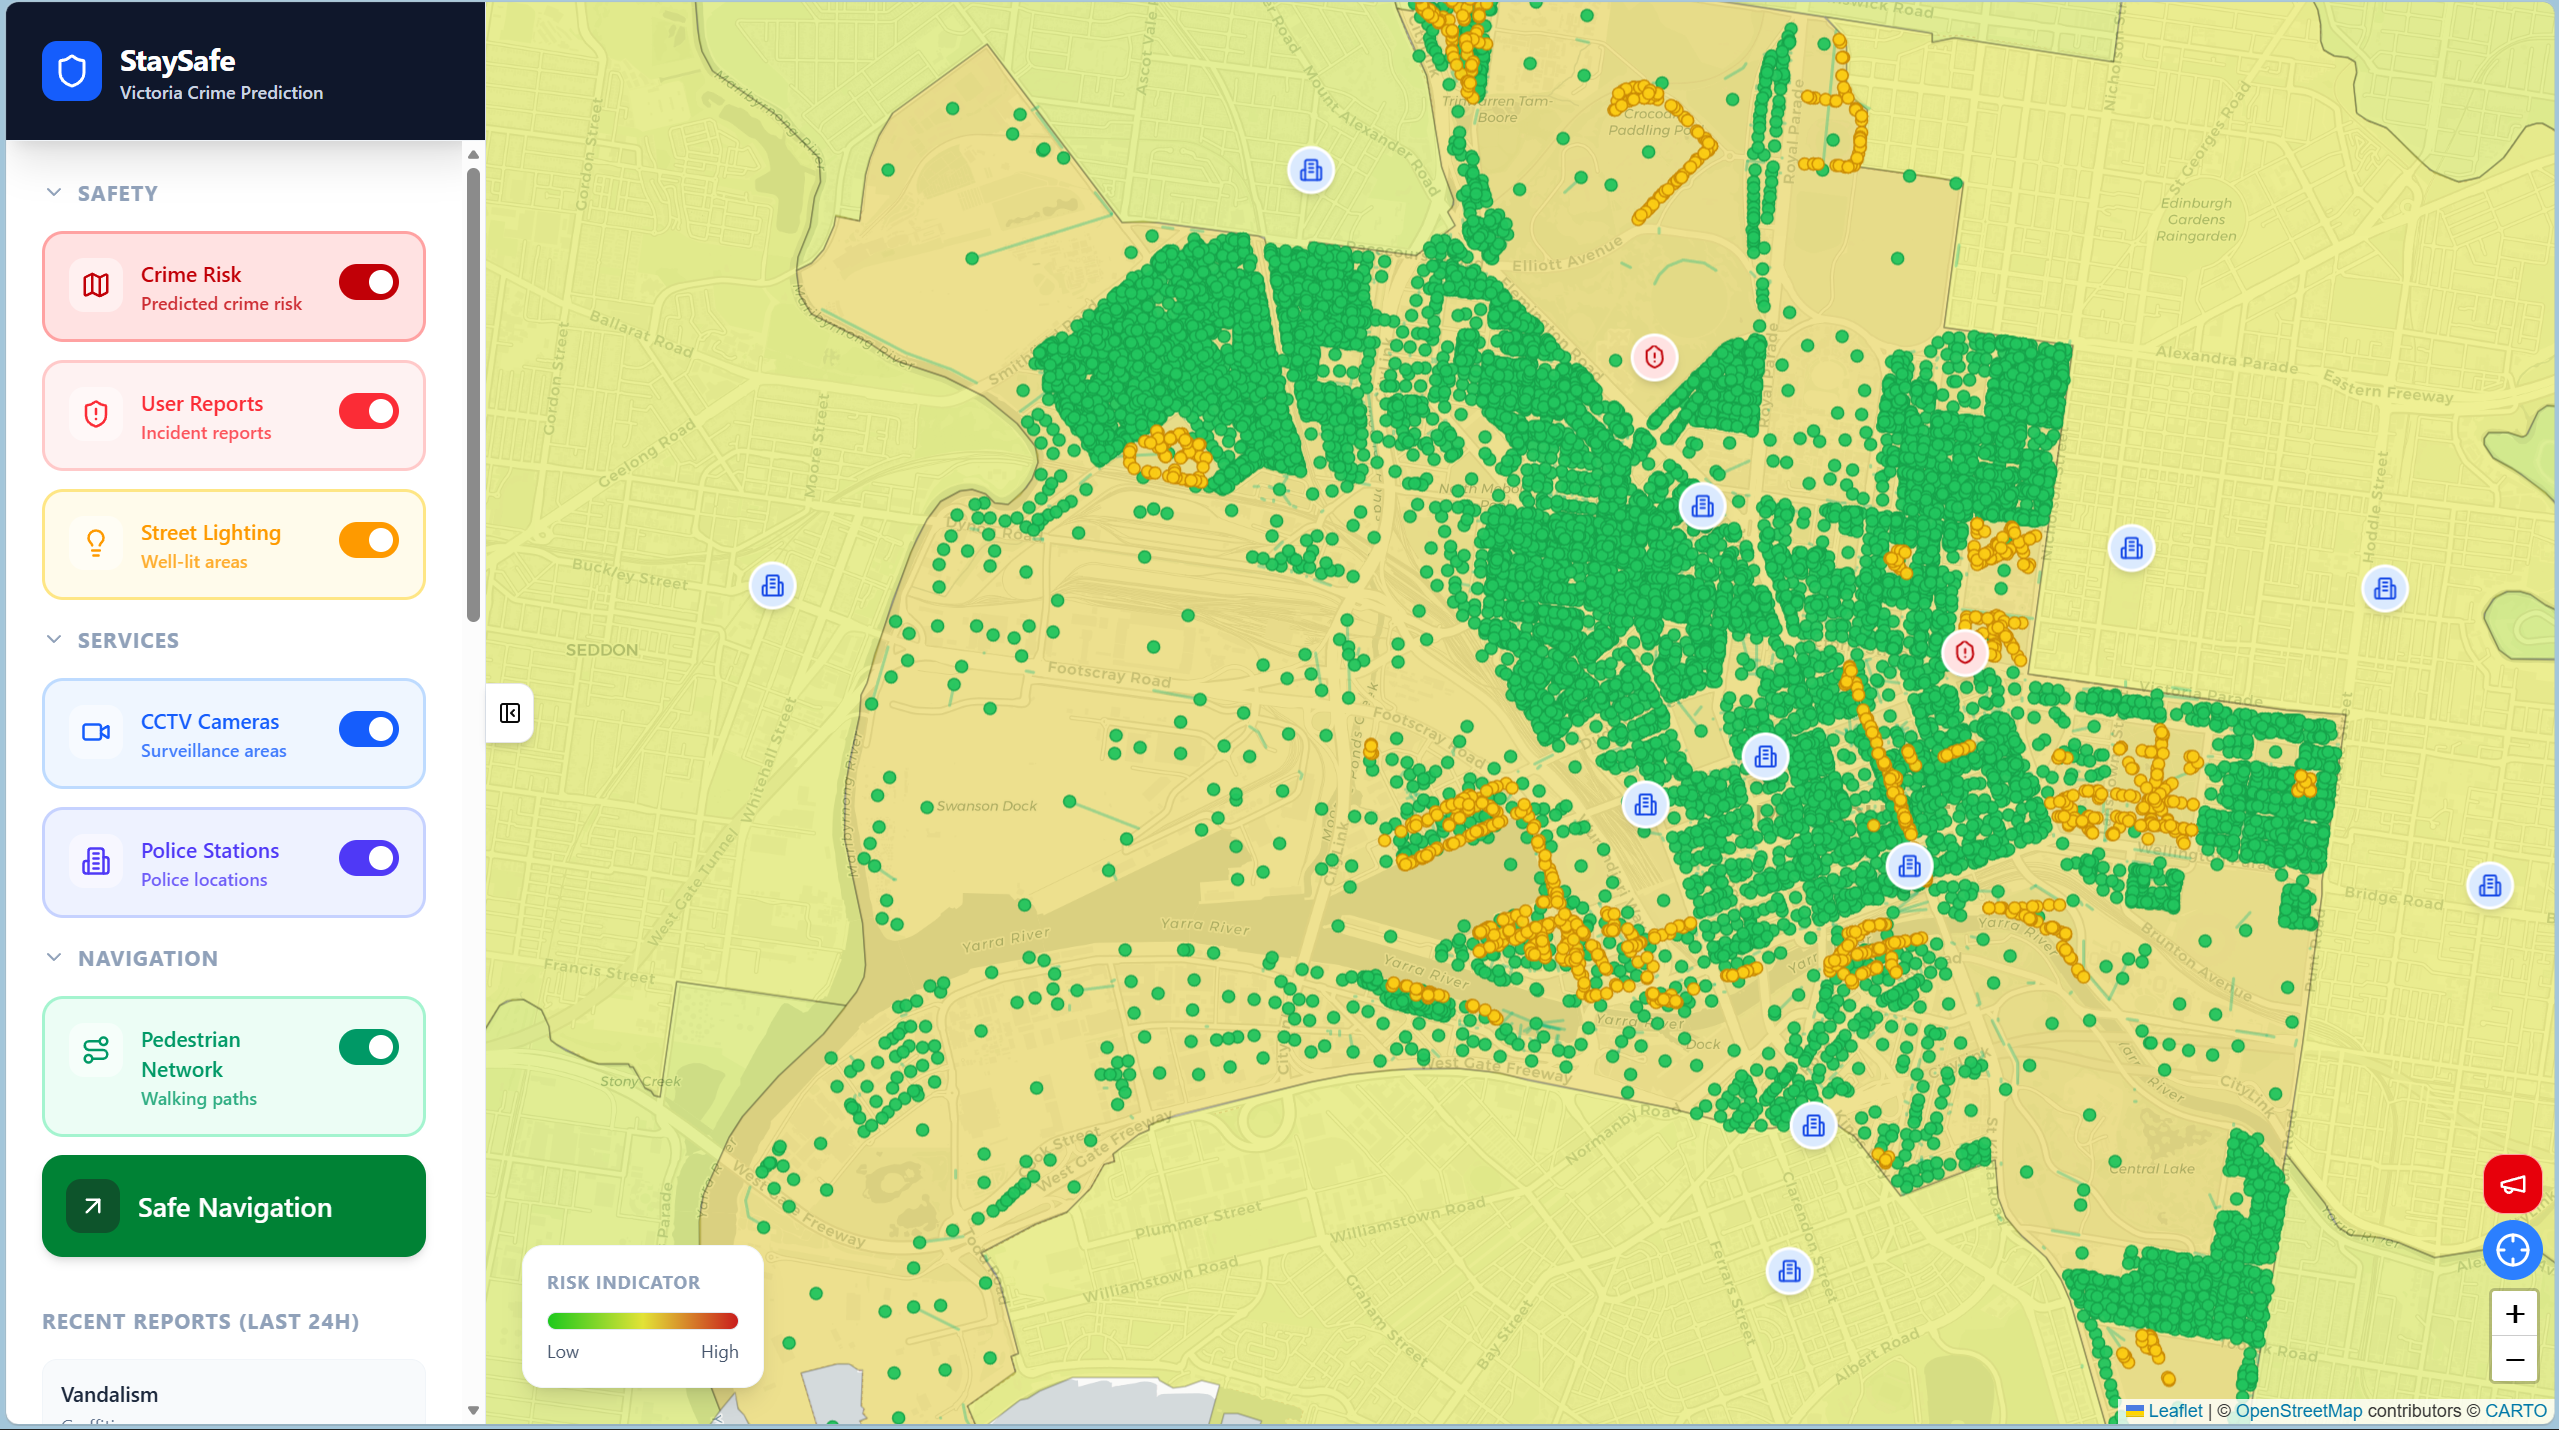
Predicted crime rate for Melbourne
-
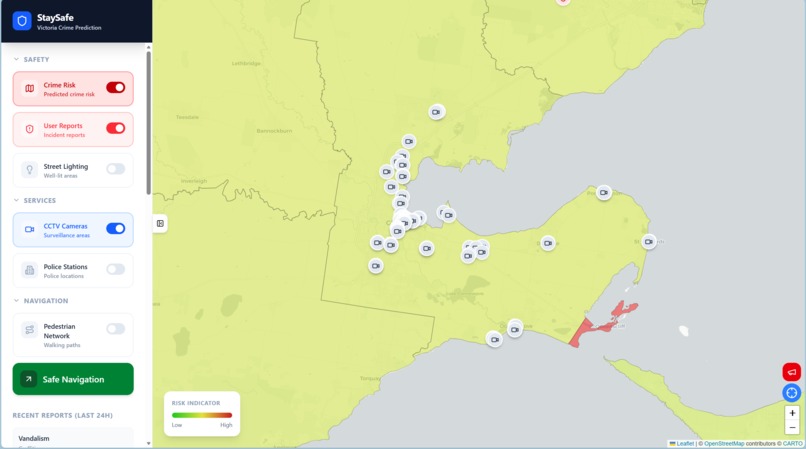
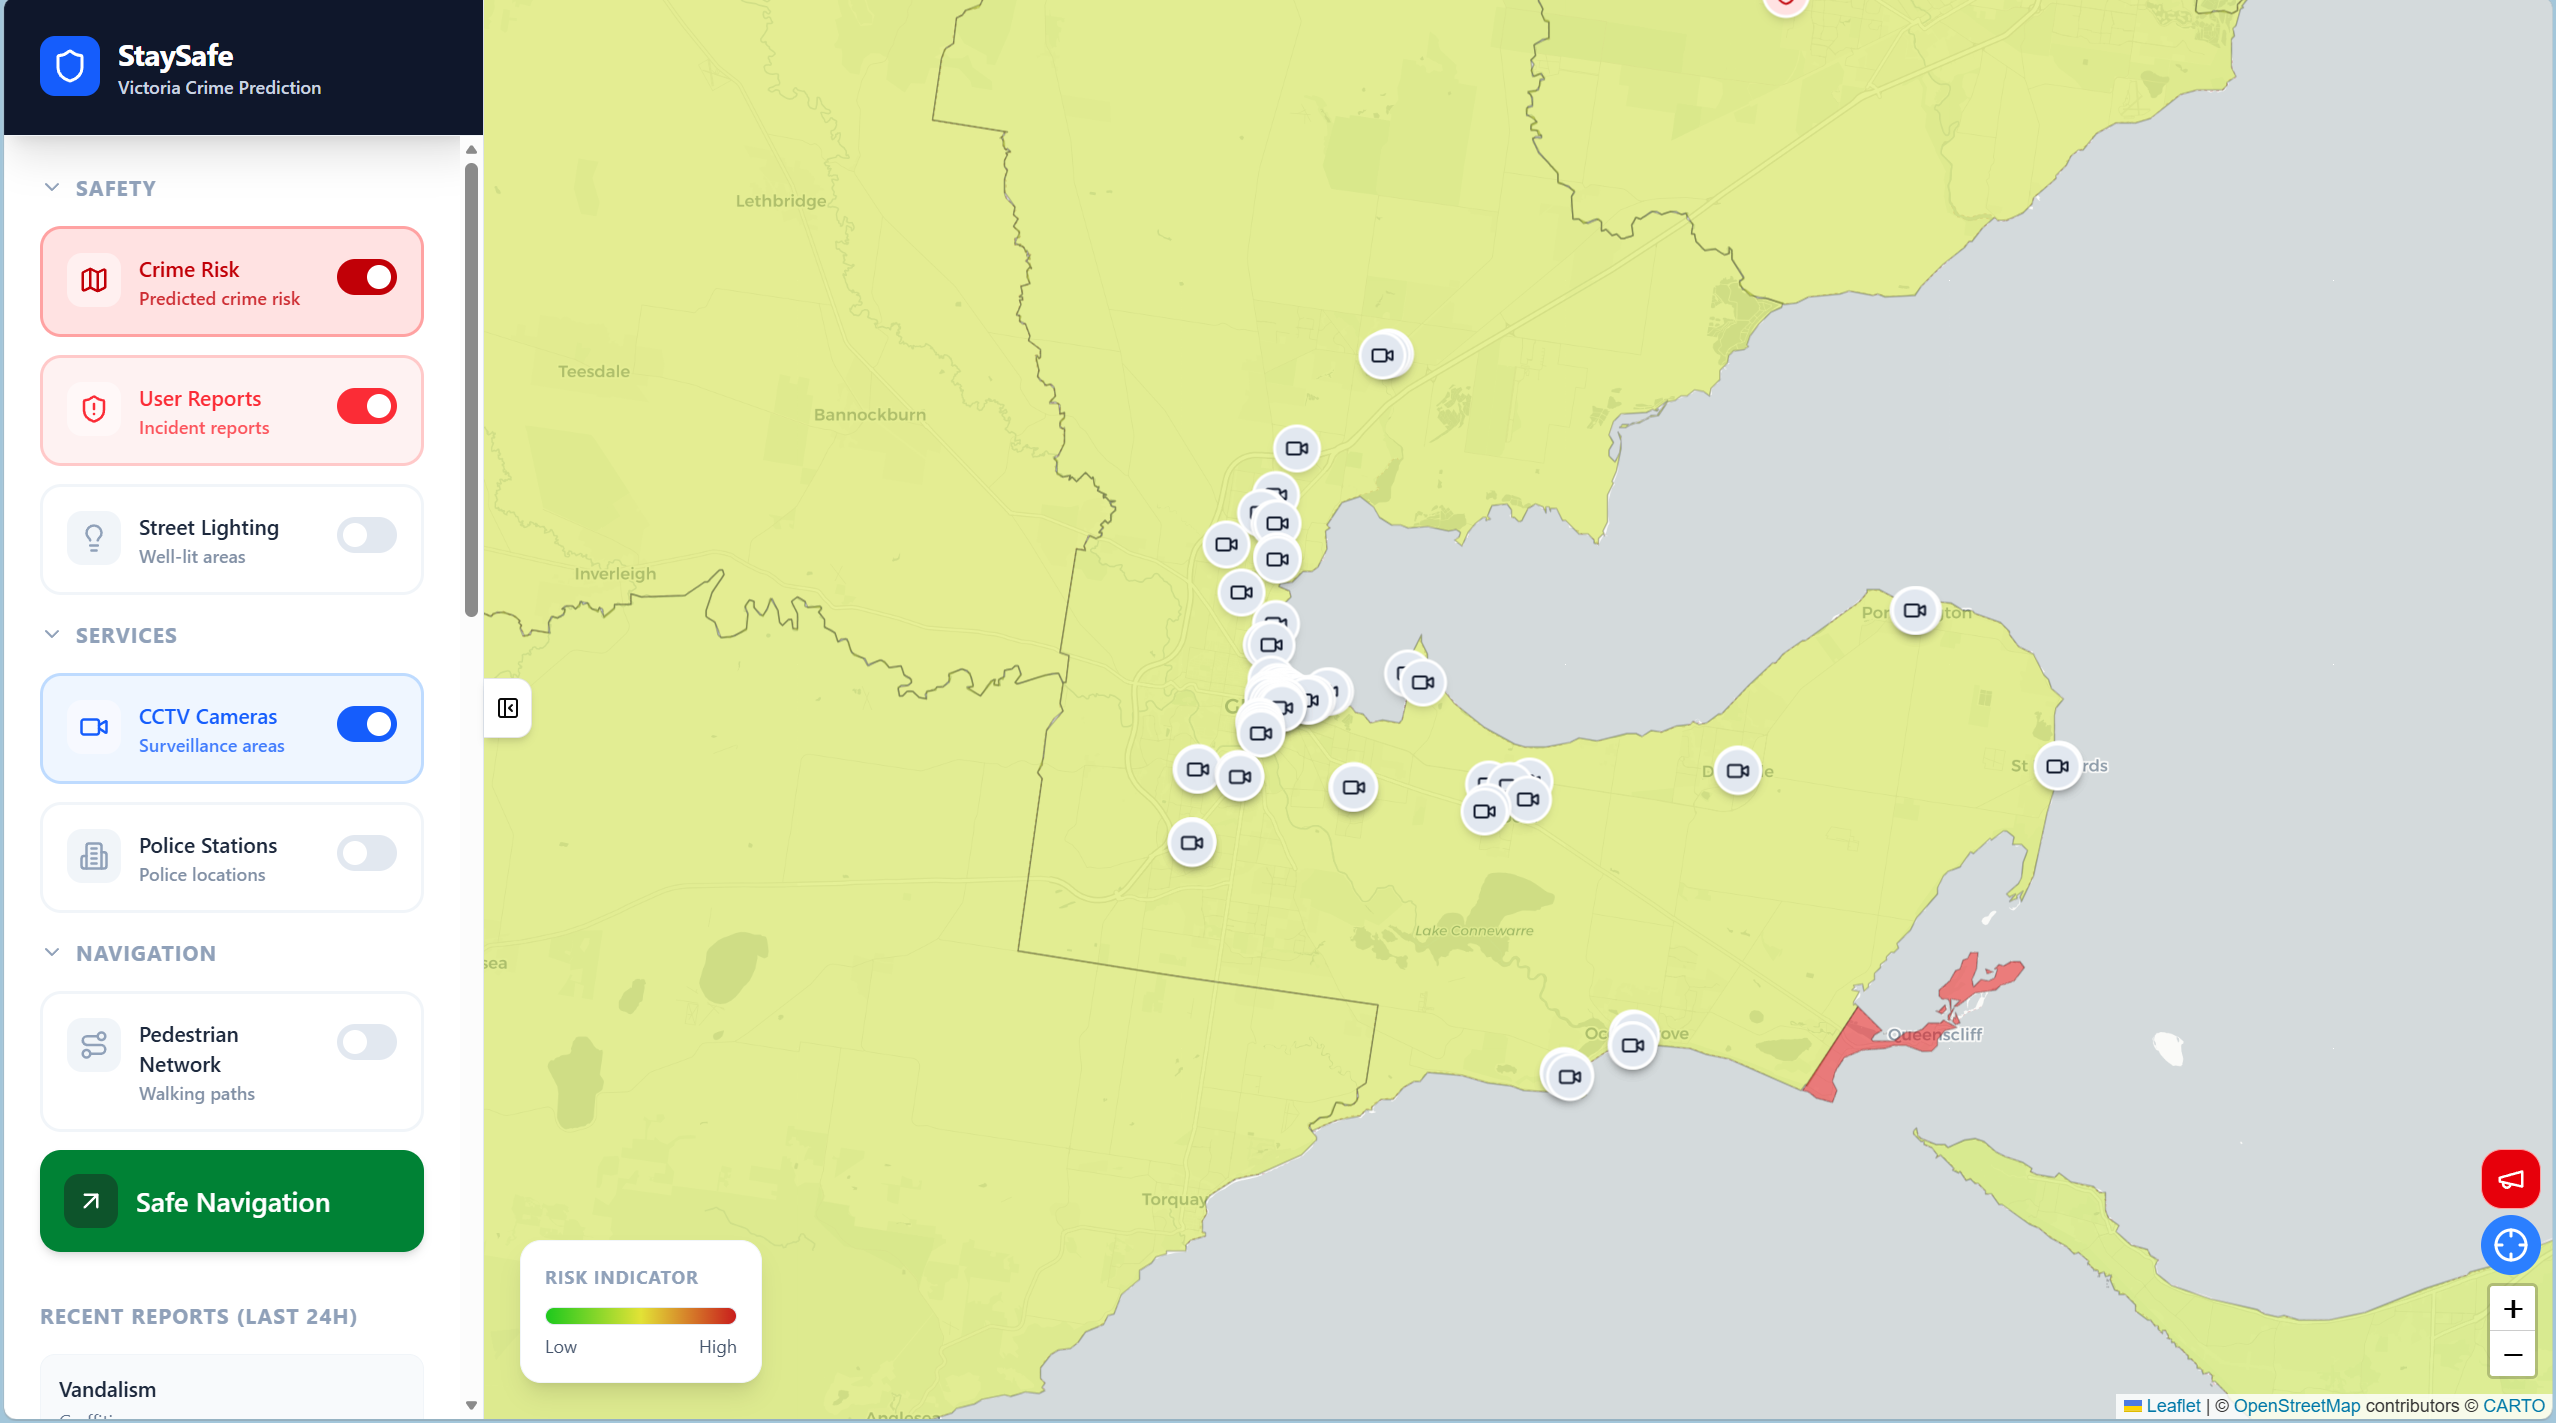
CCTV locations in Geelong
-
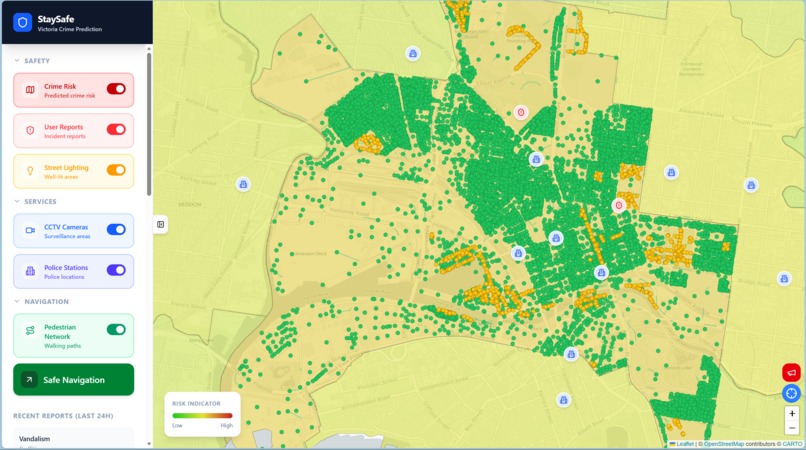
Pedestrian Network in Melbourne CBD
-
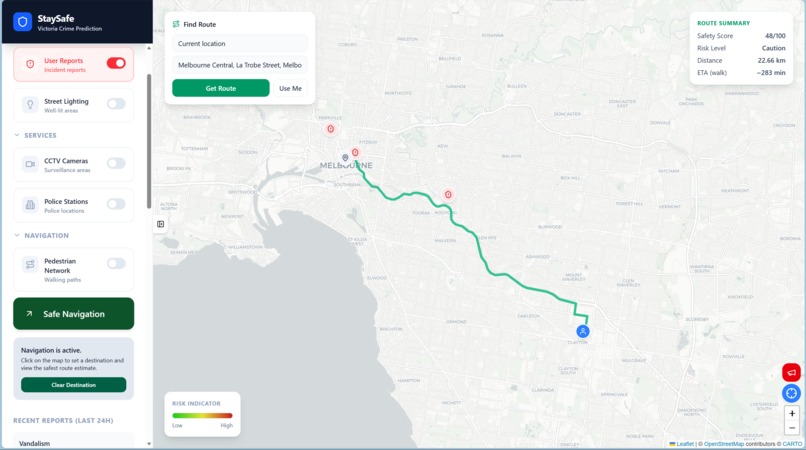
Navigation Demo from Monash University Clayton to Melbourne Central
-
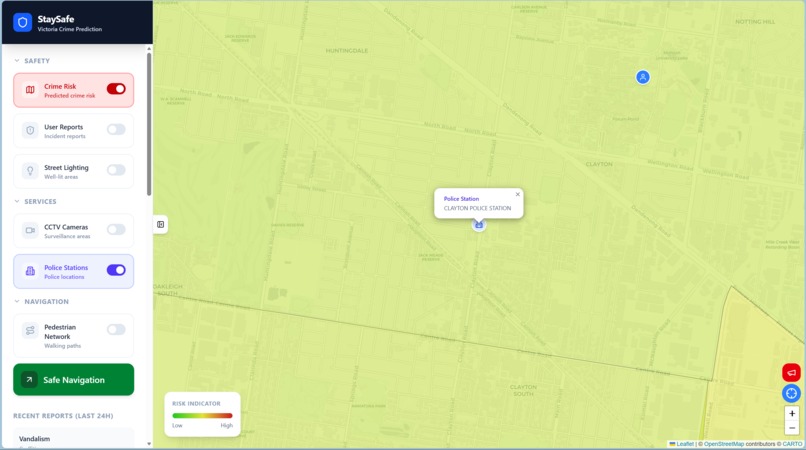
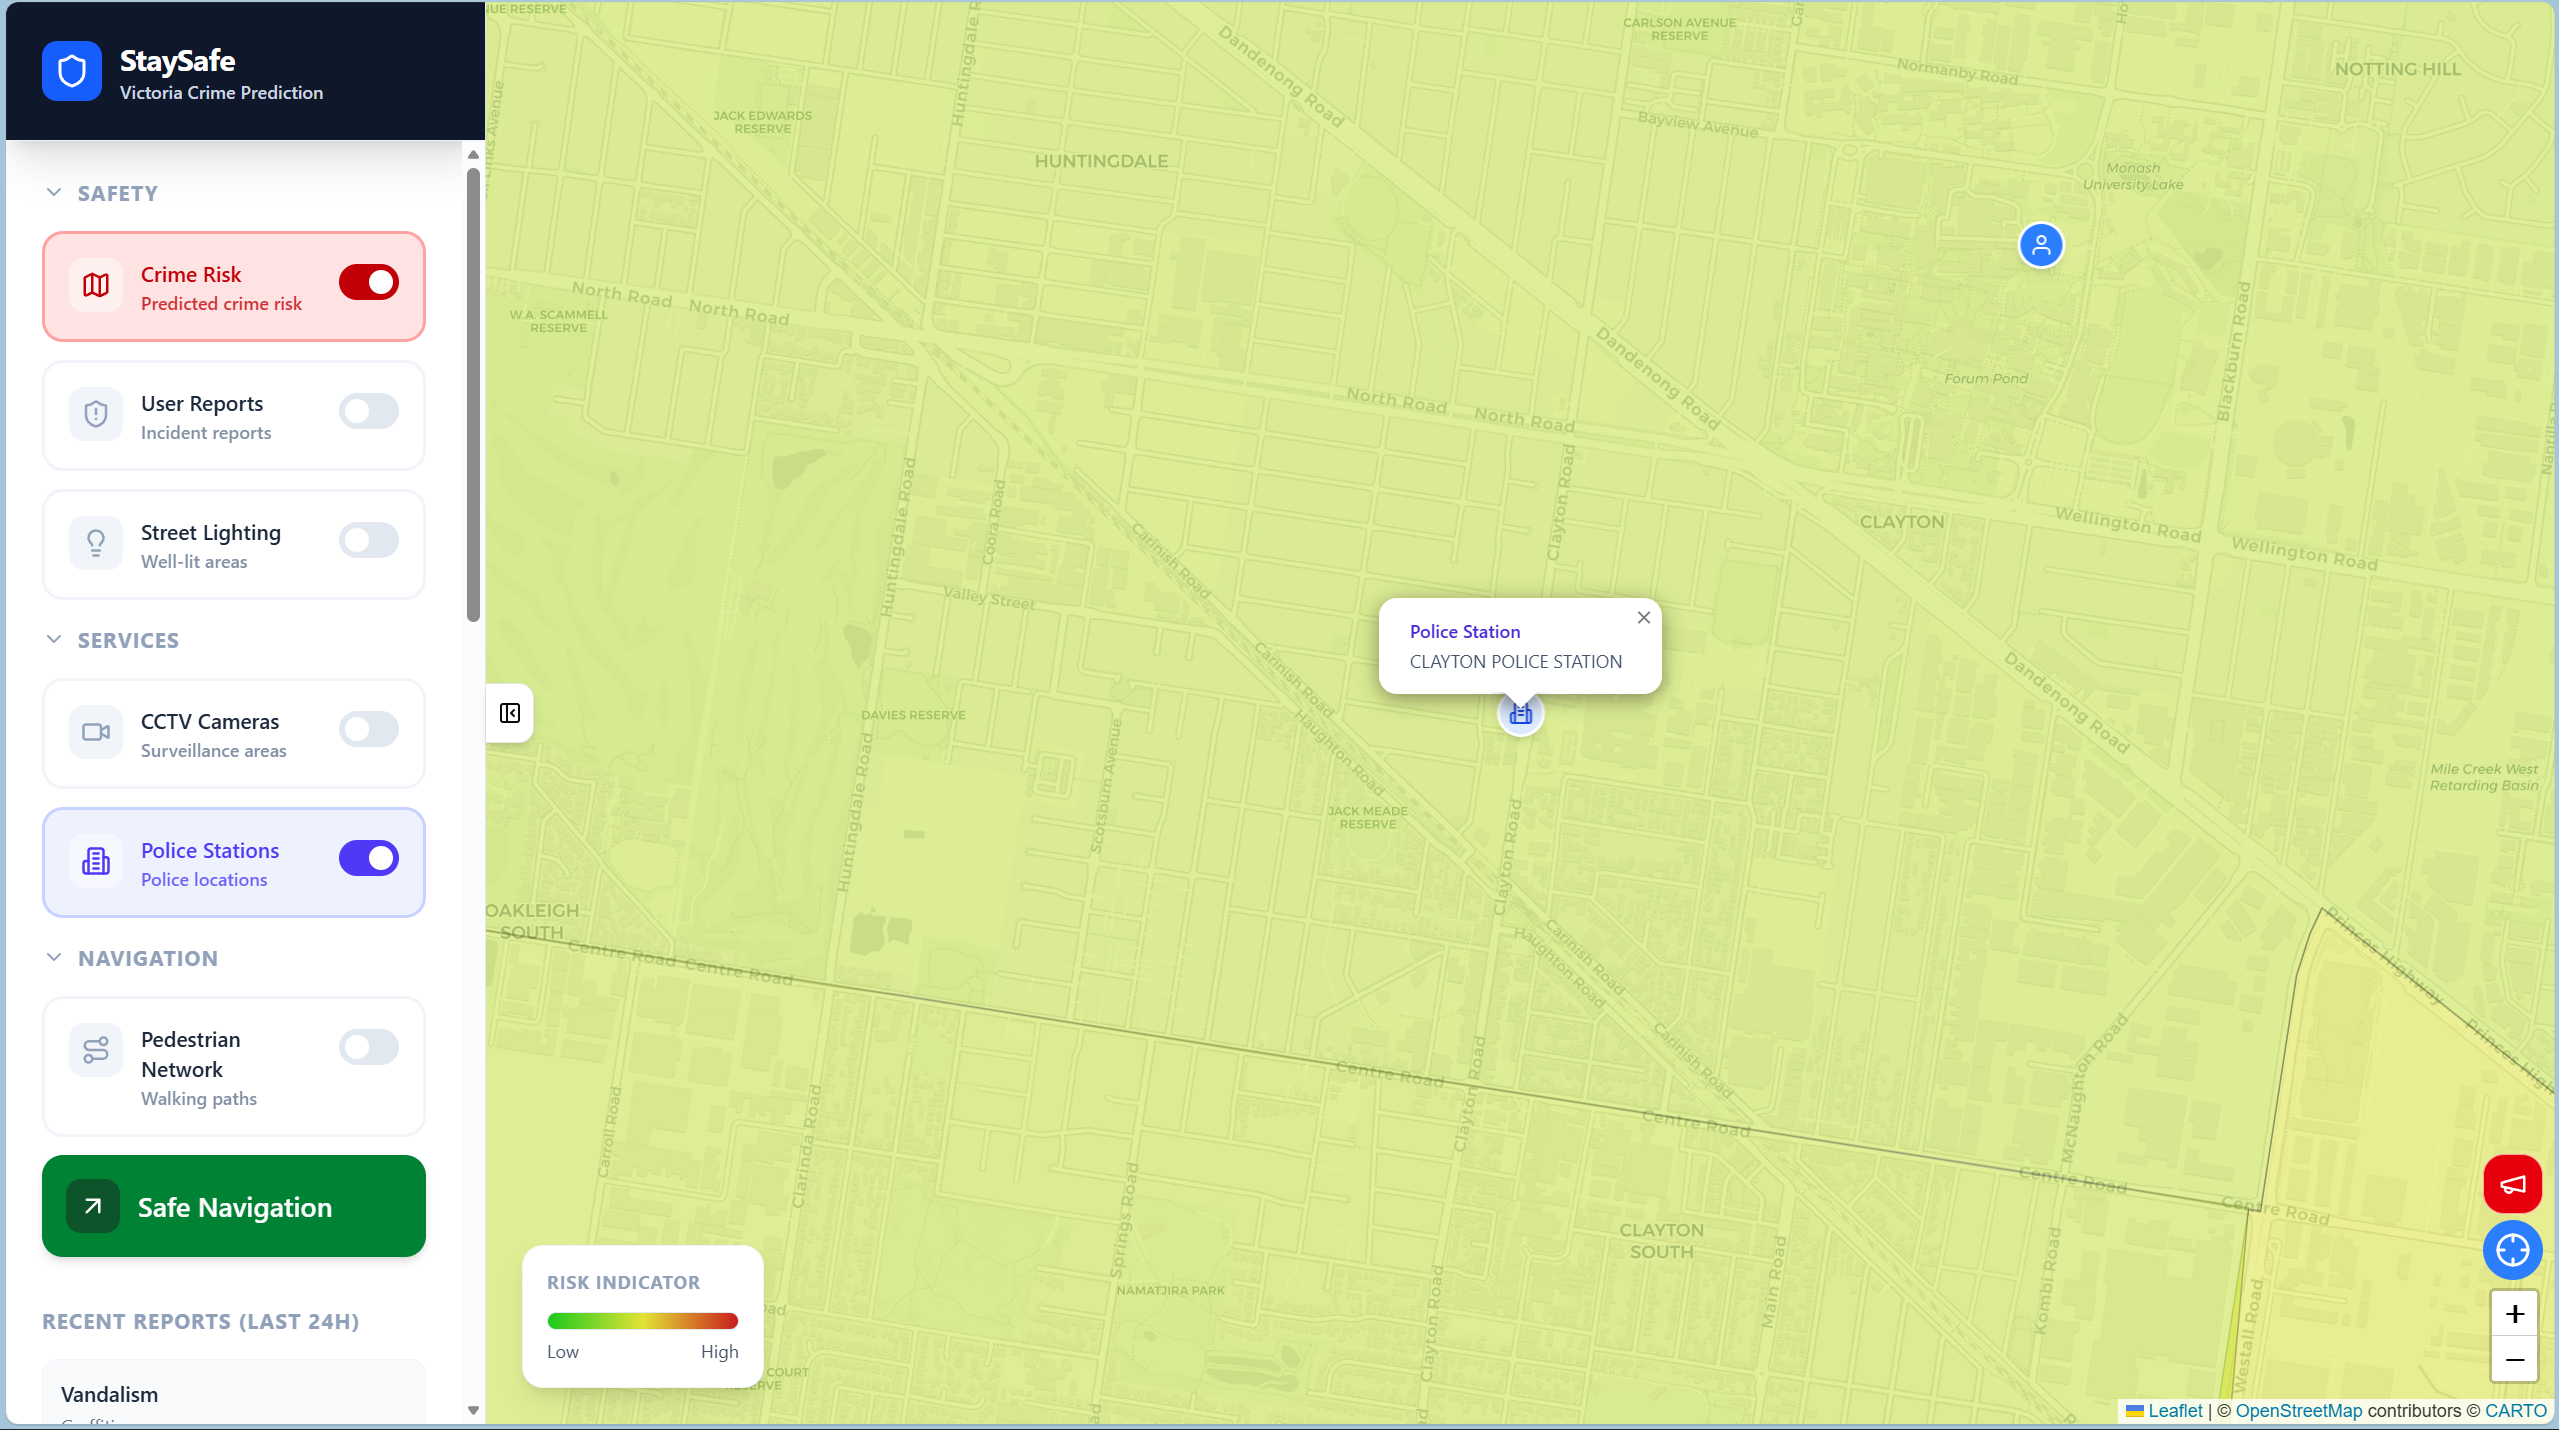
Police station marker - Clayton Police Station
-
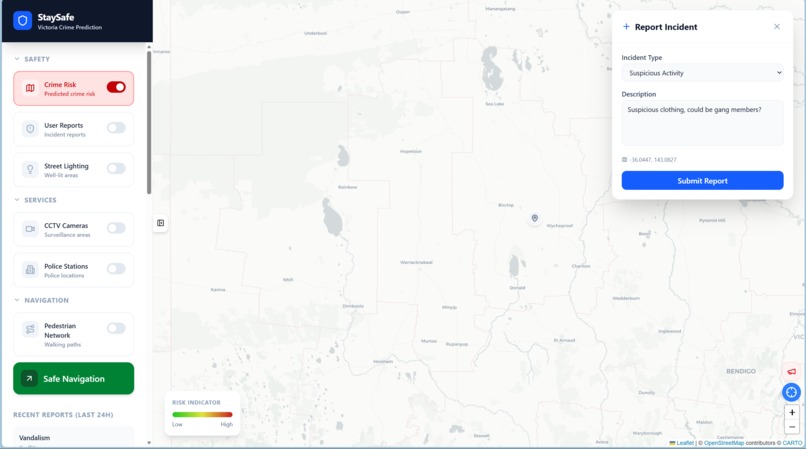
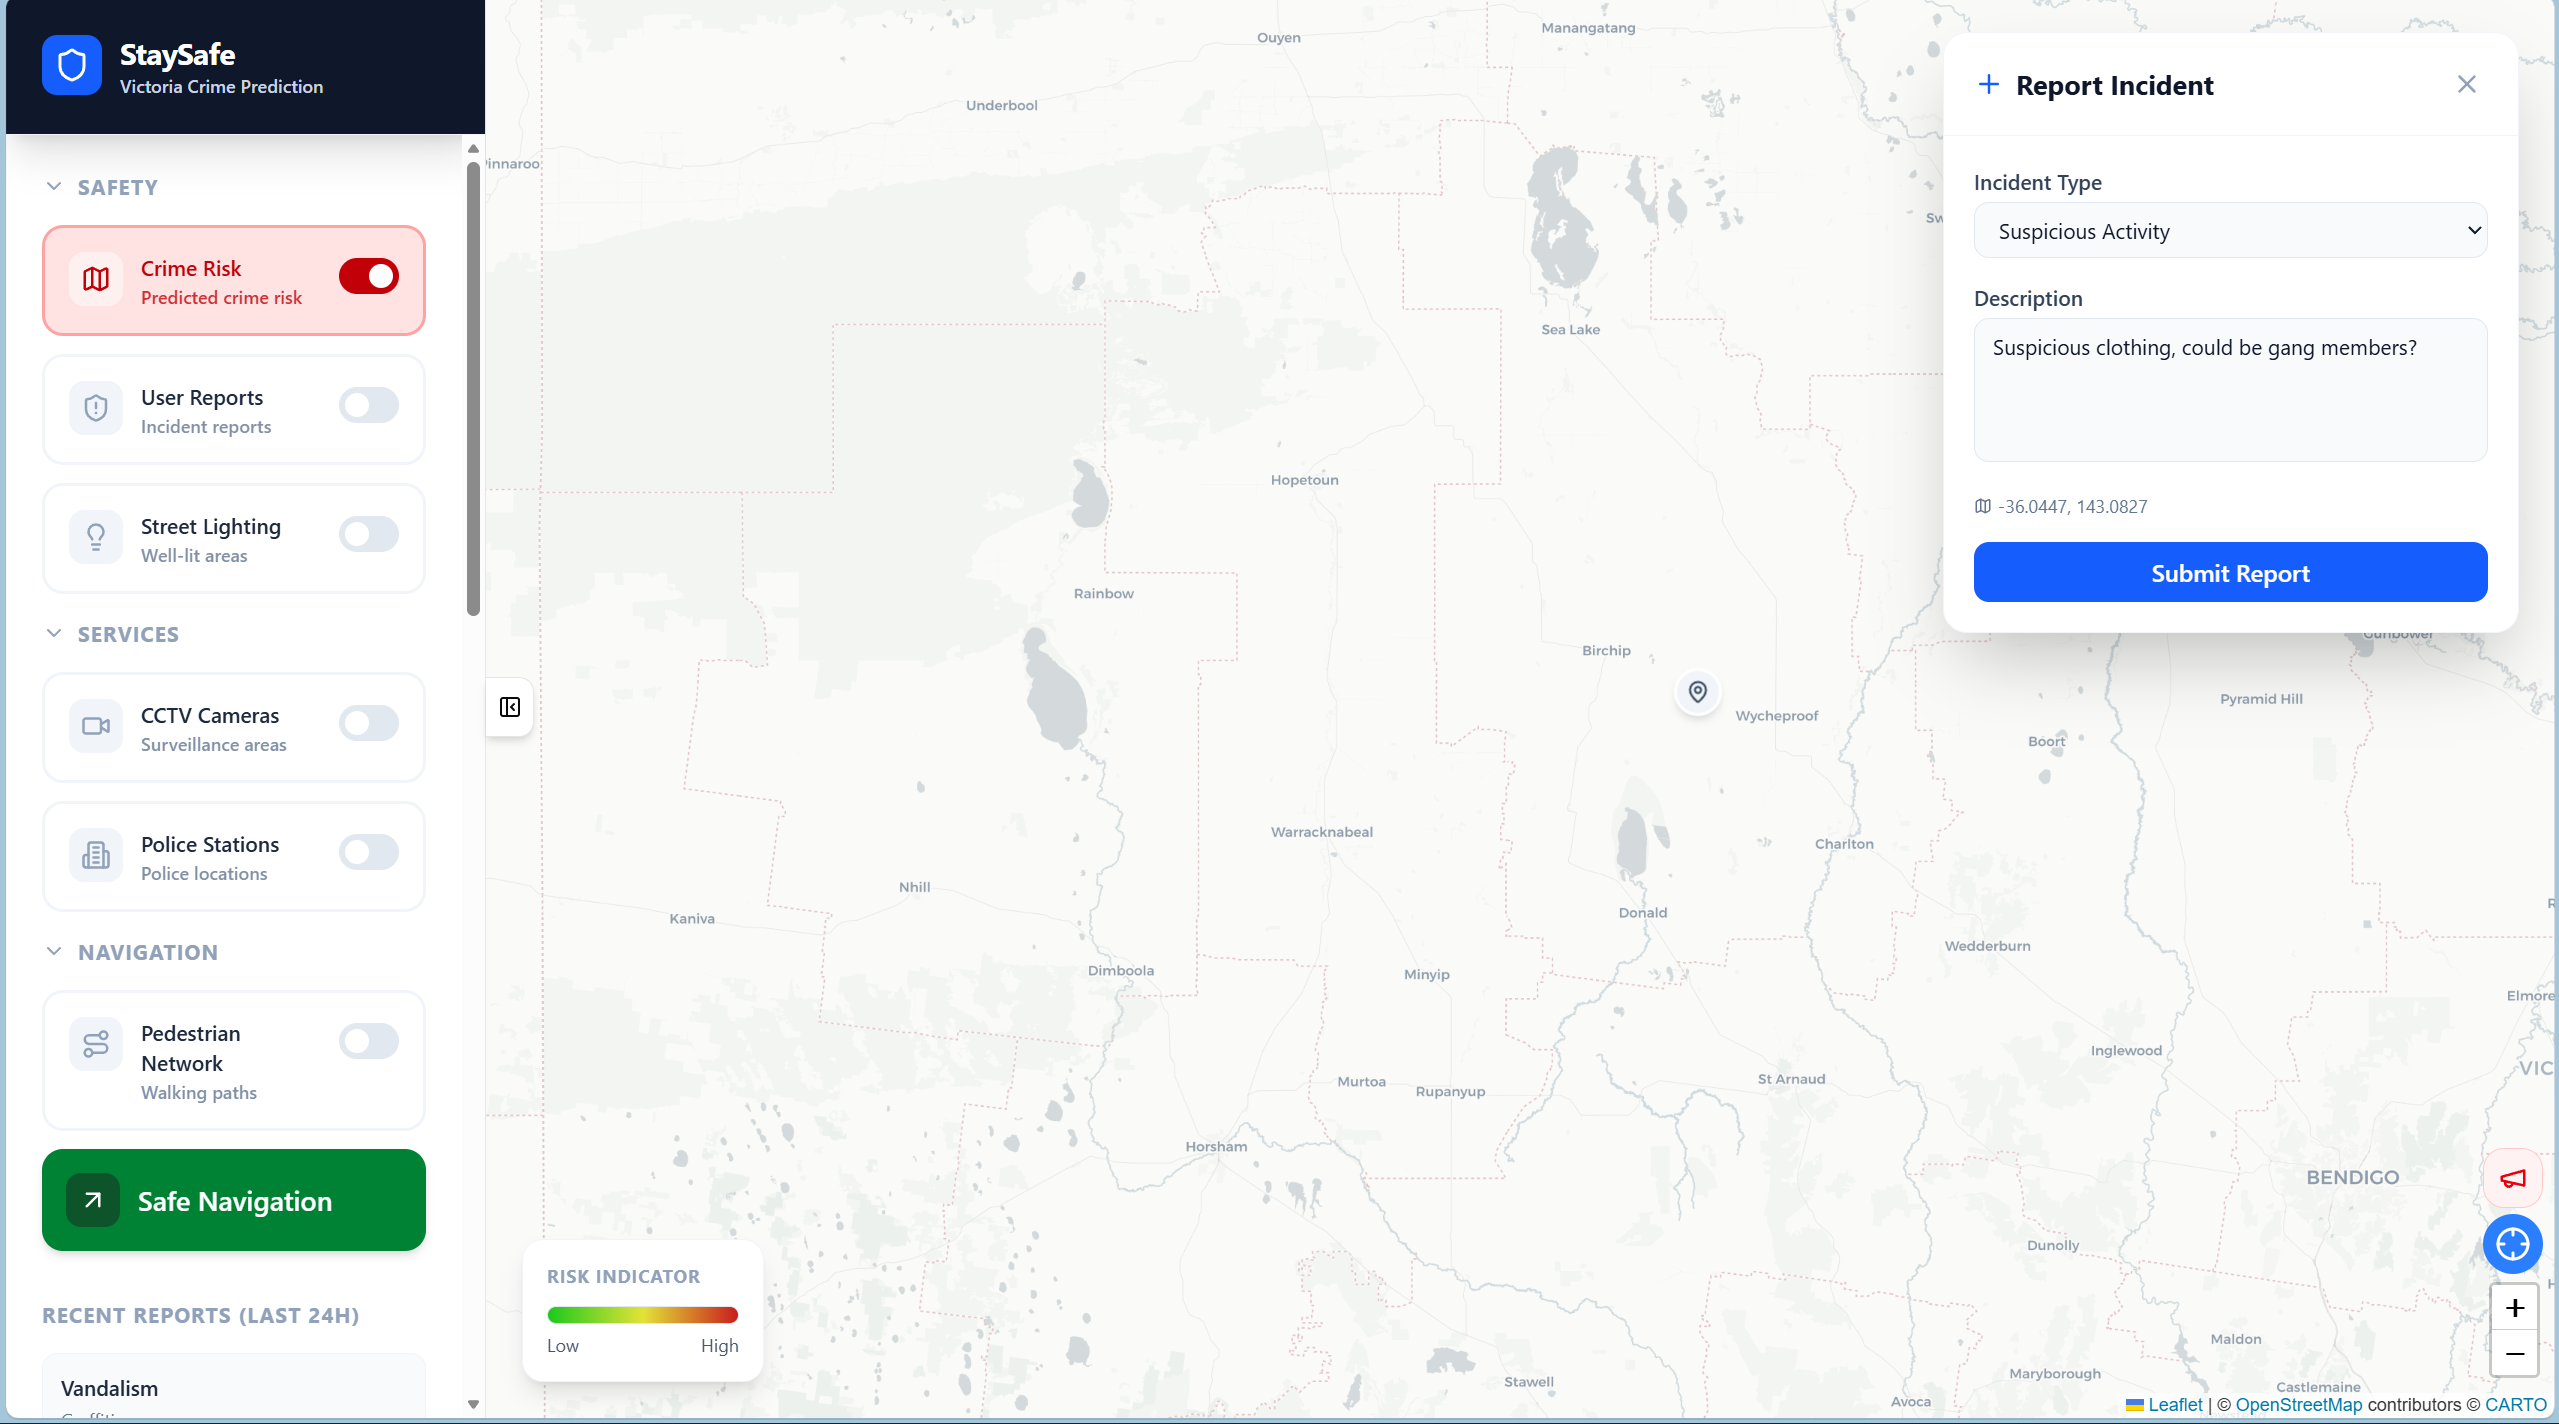
Demo of reporting an incident
-
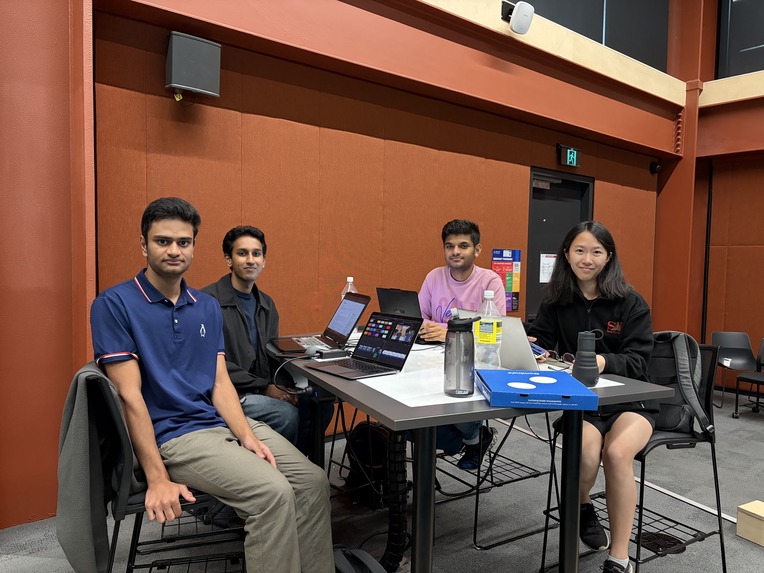
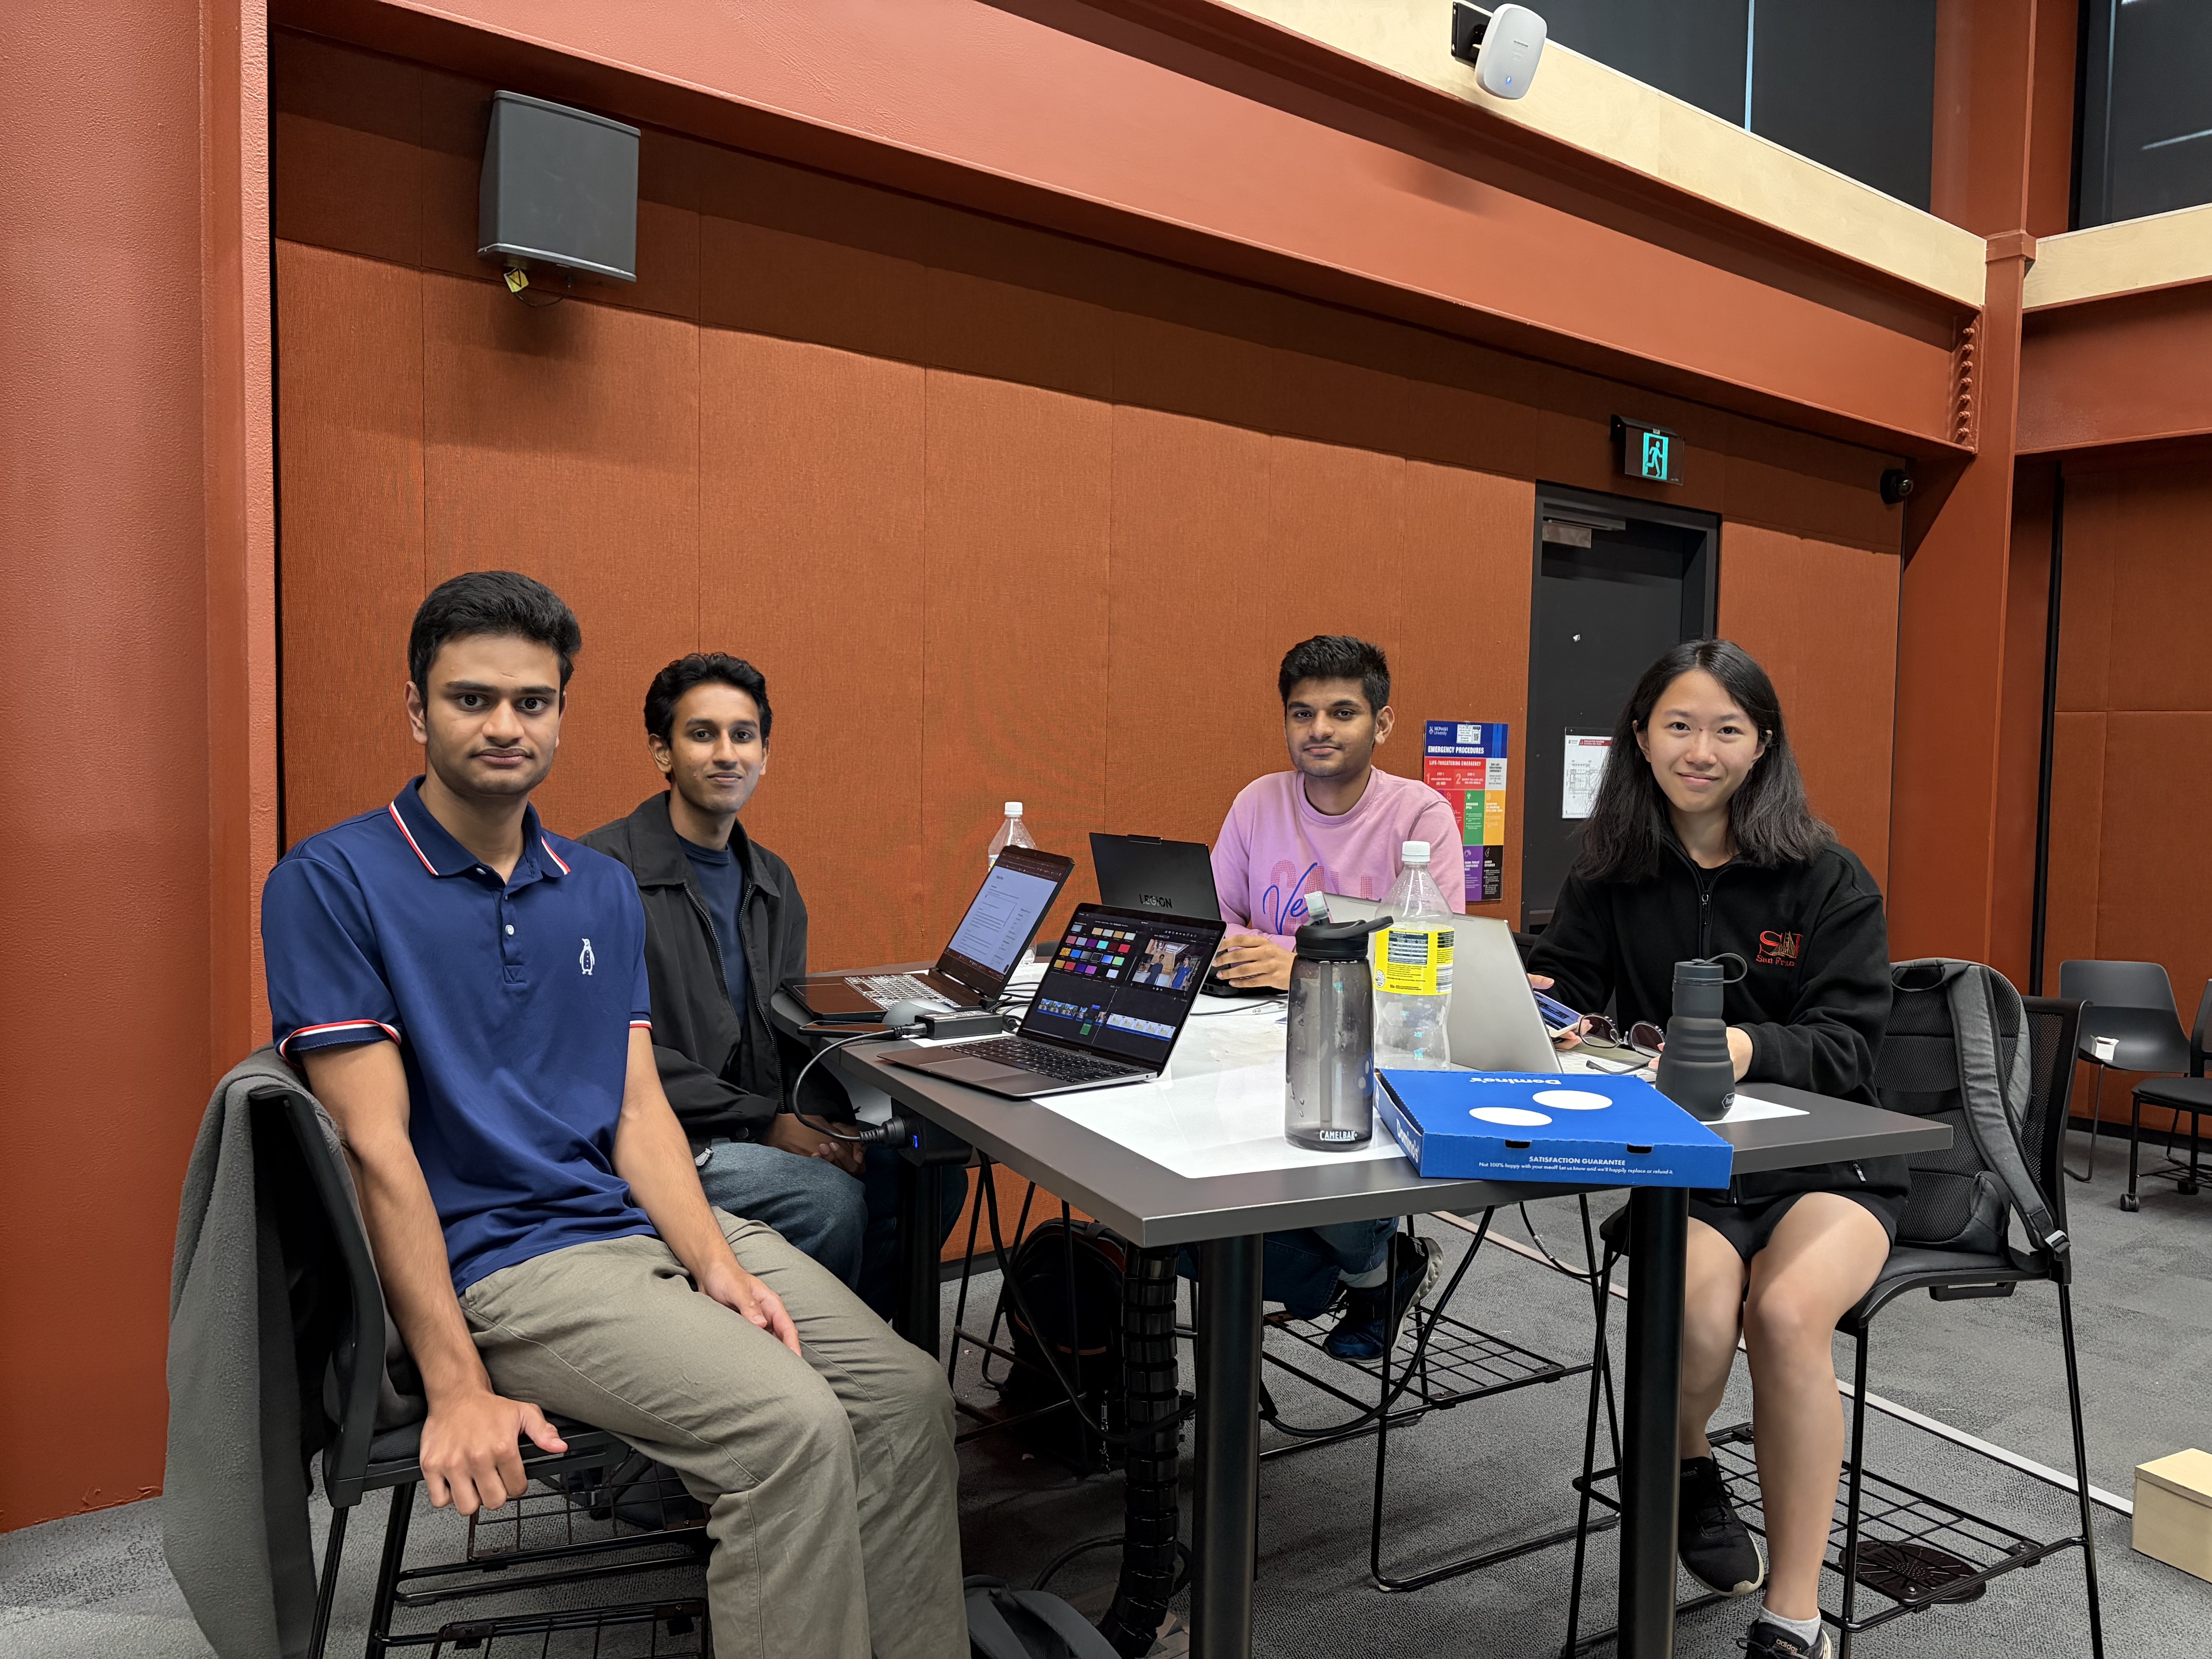
Team photo


How do you survive the streets without getting surprised?
Inspiration
We believe everyone deserves to feel secure navigating their city. While historical crime data exists, it’s often static and hard for the average person to interpret. We wanted to bridge the gap between complex data and daily decision-making by creating a dynamic, accessible tool. Our inspiration was to empower the residents of Victoria with real-time situational awareness and predictive insights, turning raw data into actionable peace of mind.
What it does
StaySafe is an interactive web application that visualizes community safety across Victoria. It features:
- Predictive Crime Heatmap: Displays machine-learning-powered risk levels using intuitive, color-coded map layers.
- Community Reporting: Allows users to drop a pin on the map to submit real-time incident reports, feeding into a live 24-hour activity log.
- Safety Infrastructure Layers: Toggles essential contextual data, including street lighting, CCTV locations, and nearby police stations.
- Safe Navigation Routing: Generates step-by-step directions to a destination, actively prioritising the safest paths based on lighting, camera coverage, and safety data rather than just the fastest route.
How we built it
For the frontend, we chose Vite and React to deliver a lightning-fast, highly responsive user experience, pairing it with OpenStreetMap and Leaflet for our geospatial rendering. To power the backend, we utilised Supabase. It acts as our robust, centralised data layer, seamlessly storing and serving our machine-learning predictions, public infrastructure coordinates, and the live stream of user-submitted incident reports.
Challenges we ran into
- Git Merging Bottlenecks: With the team moving fast on the same codebase, coordinating our branches became chaotic. We ran into several complicated merge conflicts, especially when multiple people were tweaking the core React map components simultaneously, which cost us valuable development hours to untangle.
- Sourcing and Mapping Geo Bounds: Finding accurate, usable geographic bounding data for Victoria was surprisingly difficult. Once we finally secured the right GeoJSON data, the next major hurdle was accurately mapping those boundaries onto our Leaflet instance. It took a lot of trial, error, and coordinate formatting to get the geo bounds to align perfectly over our basemaps without tanking the app's performance.
Accomplishments that we're proud of
We are incredibly proud of getting the core map and reporting system fully functional within the tight hackathon time limits. Creating a seamless user experience where someone can instantly toggle between viewing ML predictions and submitting a live community report without the map lagging is a major technical win for our team.
What we learned
We leveled up our skills in geospatial data visualization, specifically mastering how to manage complex state in React when dealing with multiple interactive Leaflet layers. We also learned a lot about the nuances of UI/UX design, specifically how to present risk and crime data in a way that is informative and cautious without being alarmist.
What's next for StaySafe
Our immediate next step is integrating the remaining datasets to provide an even more comprehensive safety picture. From there, we plan to refine our crime prediction model with more granular historical data.


Log in or sign up for Devpost to join the conversation.