-
-
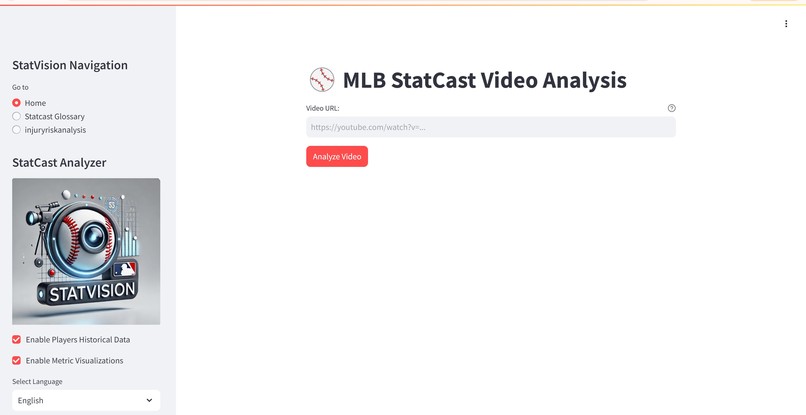
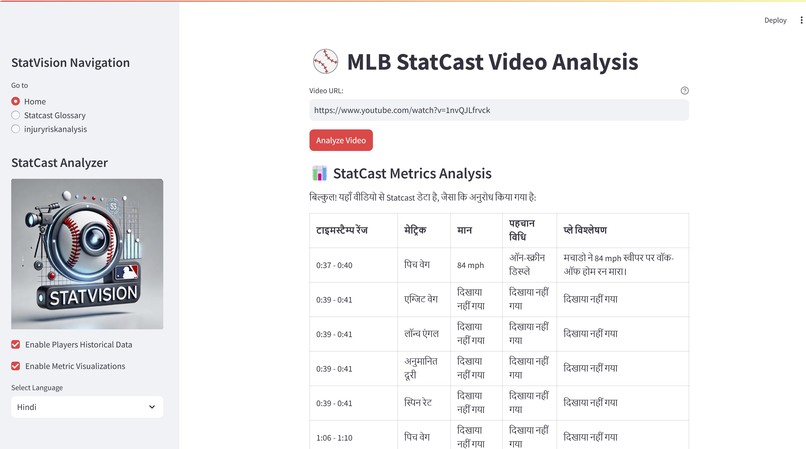
Home page
-
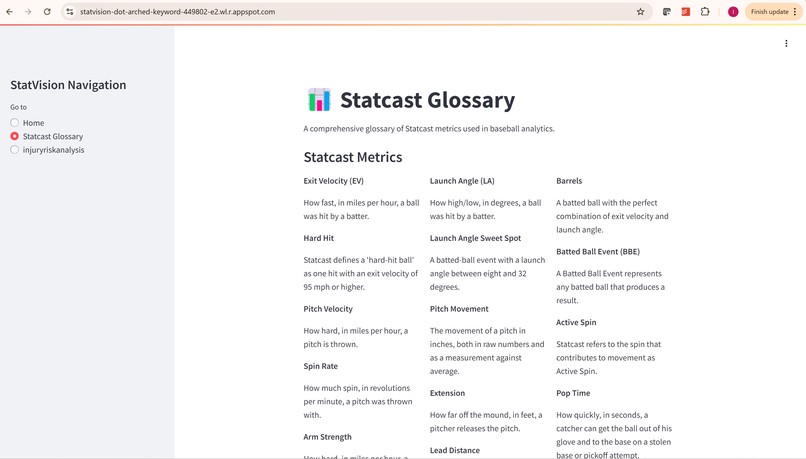
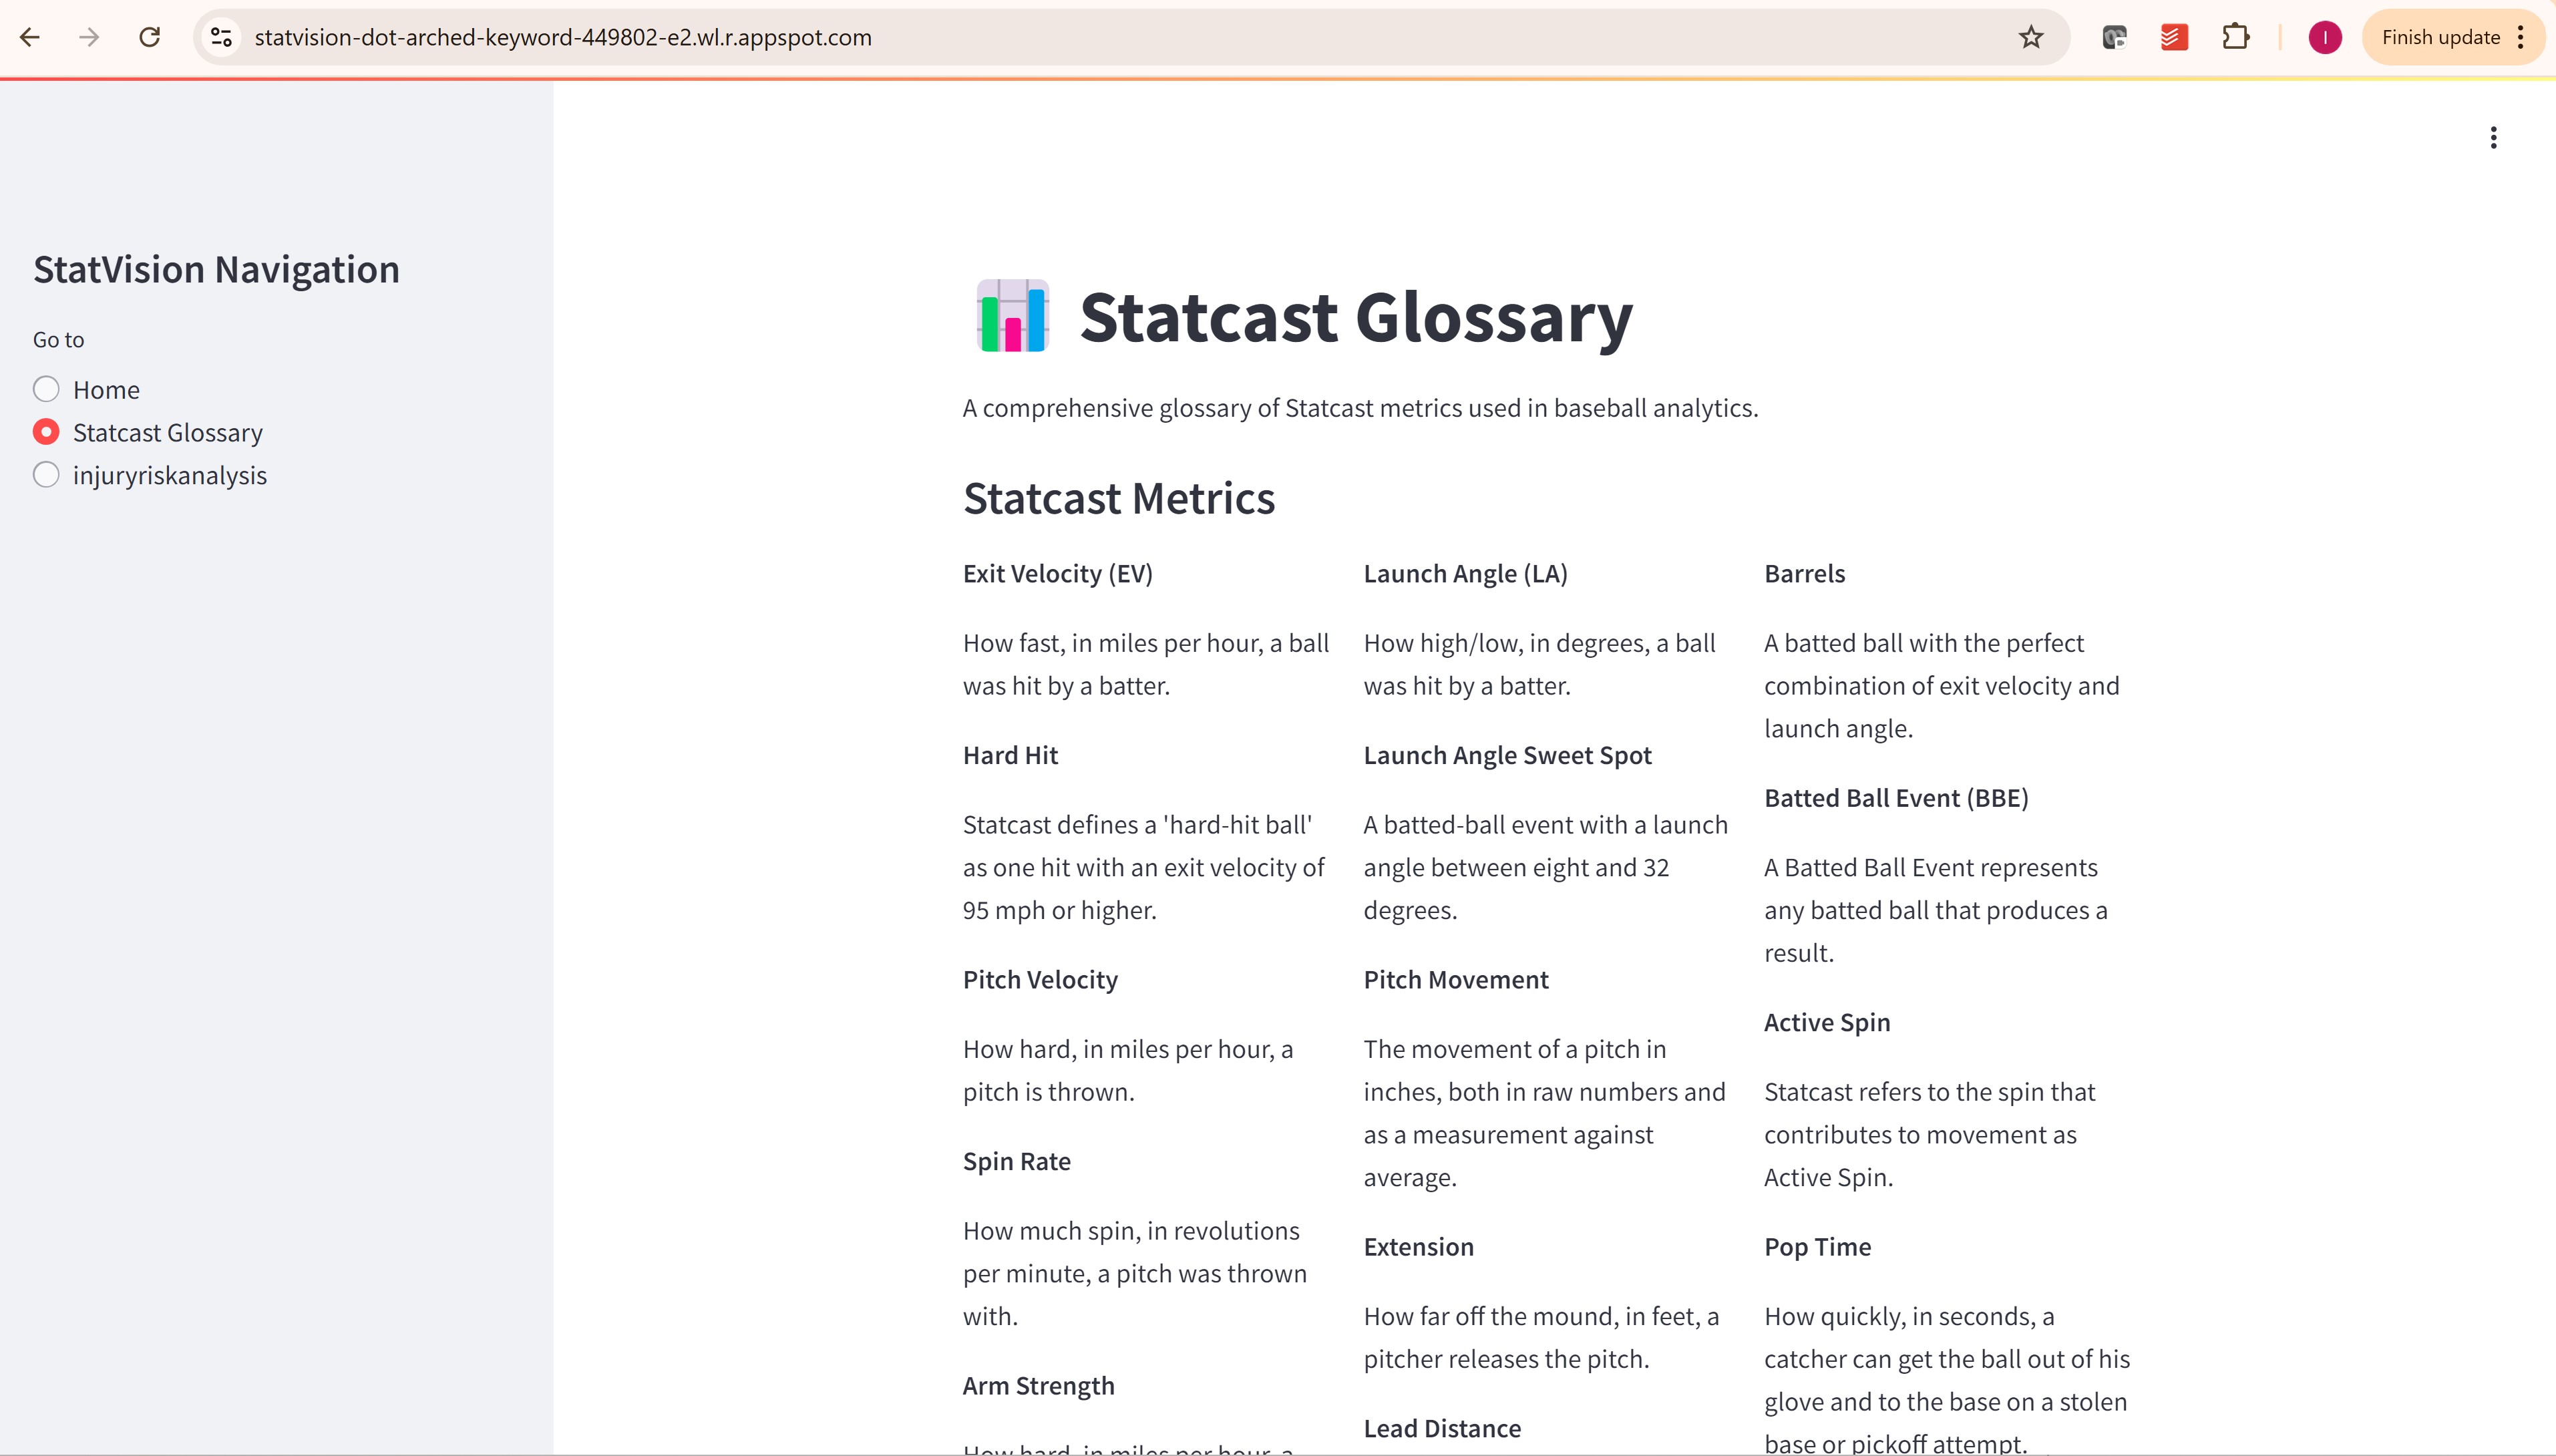
Glossary
-
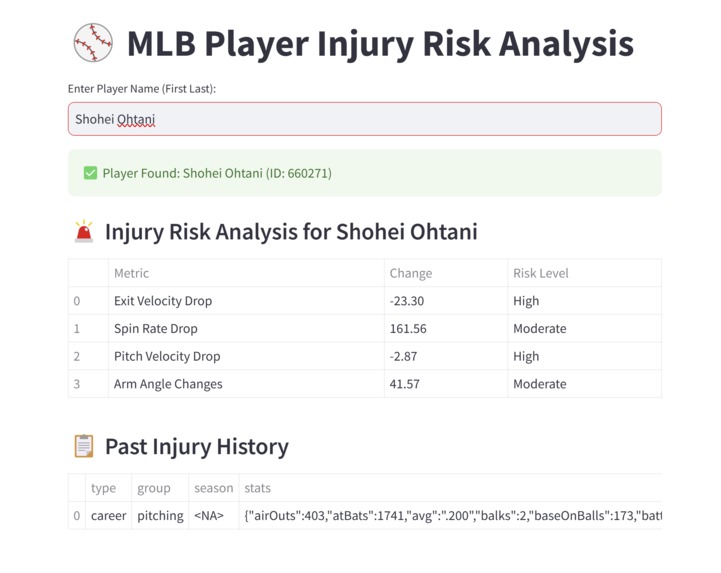
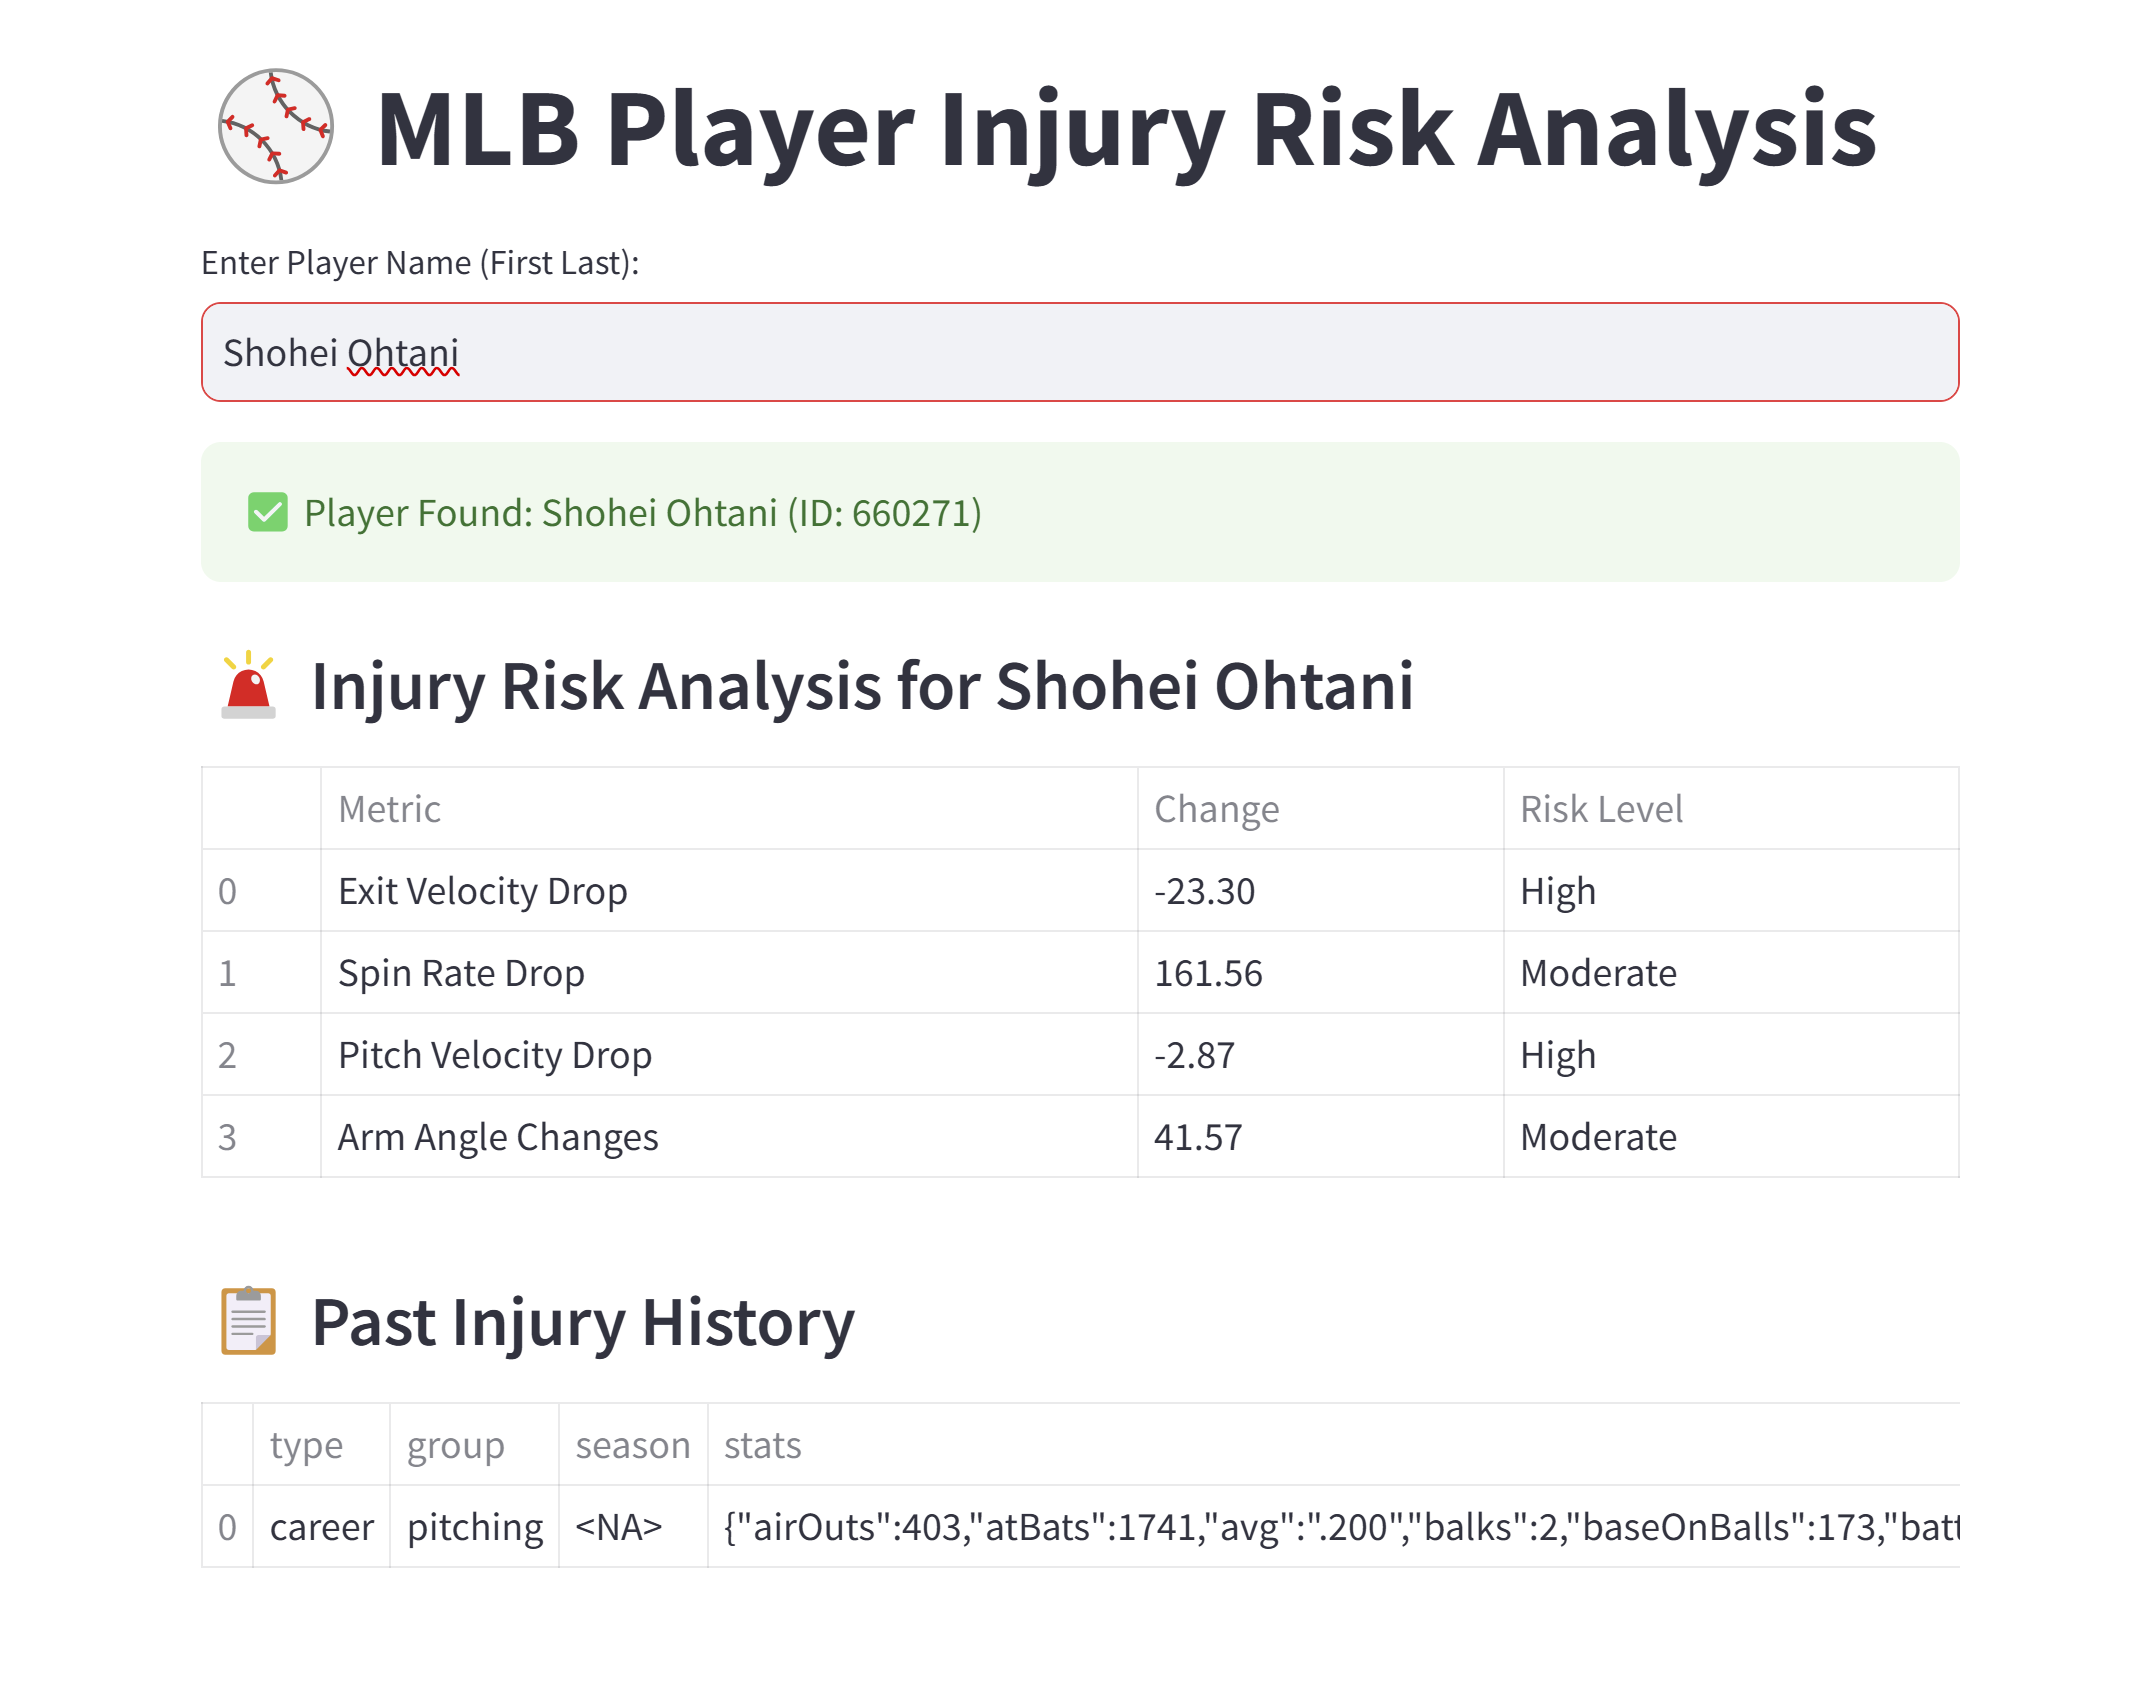
Player risk analysis
-
-

-

Inspiration
Baseball teams and fans often struggle with digesting the vast amounts of data available through StatCast, which provides metrics about pitch speed, launch angles, and other important statistics. Players also face potential injury risks related to changes in their gameplay metrics, such as drop in pitch velocity or changes in sprint speed.While StatCast data is powerful, most of the time it's challenging to visualize or analyze the data without expert-level knowledge. Additionally, a gap exists in terms of automatically analyzing video footage to pull relevant metrics and track player performance trends in real-time.
Also Baseball teams are constantly looking for ways to monitor their players’ health. Injuries, especially those related to subtle changes in a player's performance, often go unnoticed until it's too late. The challenge was to create a system that could help coaches, analysts, and medical teams catch these early warning signs, allowing for more proactive management of player health.
What it does
developing an innovative application that integrates cutting-edge AI technologies and StatCast data to enhance the analysis and understanding of baseball performance. As a team, we were passionate about leveraging AI and machine learning to deliver actionable insights from video content, focusing on player performance, injury risks, and metrics like exit velocity, spin rate, and pitch velocity.
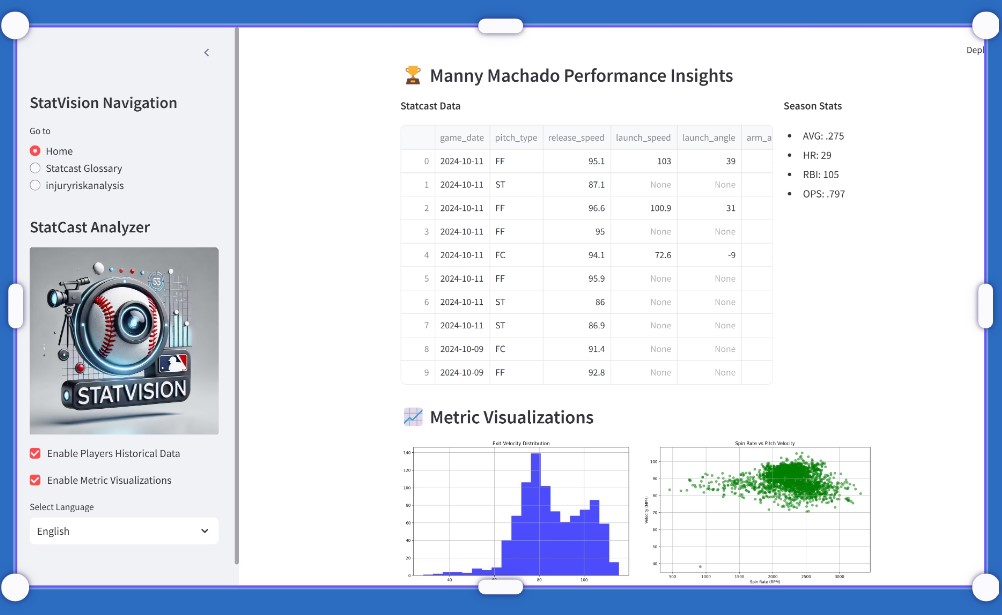
StatVision is a StatCast Video Analysis tool that uses Vertex AI (Google Gemini) to analyze baseball game footage. Our application would take a YouTube video URL, extract metrics like pitch velocity, exit velocity, launch angle, spin rate, and projected distance, and then provide a comprehensive analysis of the player’s performance. Additionally, we used Google Cloud's Vertex AI to support multilingual analysis, allowing players and analysts from around the world to easily access the insights, in their preferred language.
It integrates multiple sources of player data, particularly Statcast metrics and injury history, to create a tool that would identify any potential injury risks based on trends. The tool would use machine learning and statistical analysis to flag changes in a player's performance, such as drops in sprint speed, exit velocity, or spin rate, which are known to correlate with injuries.
How we built it
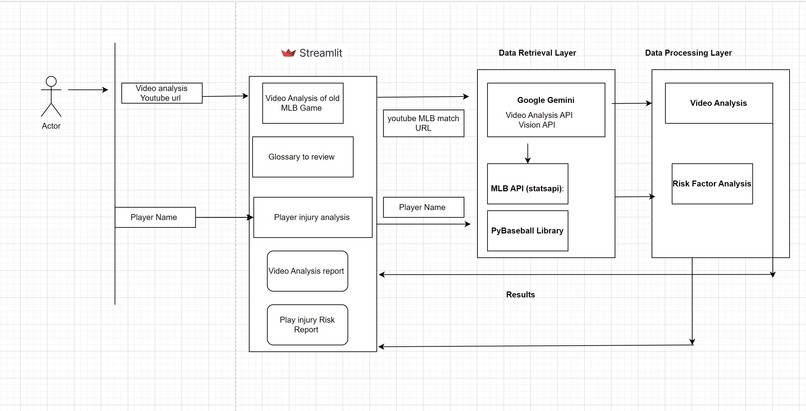
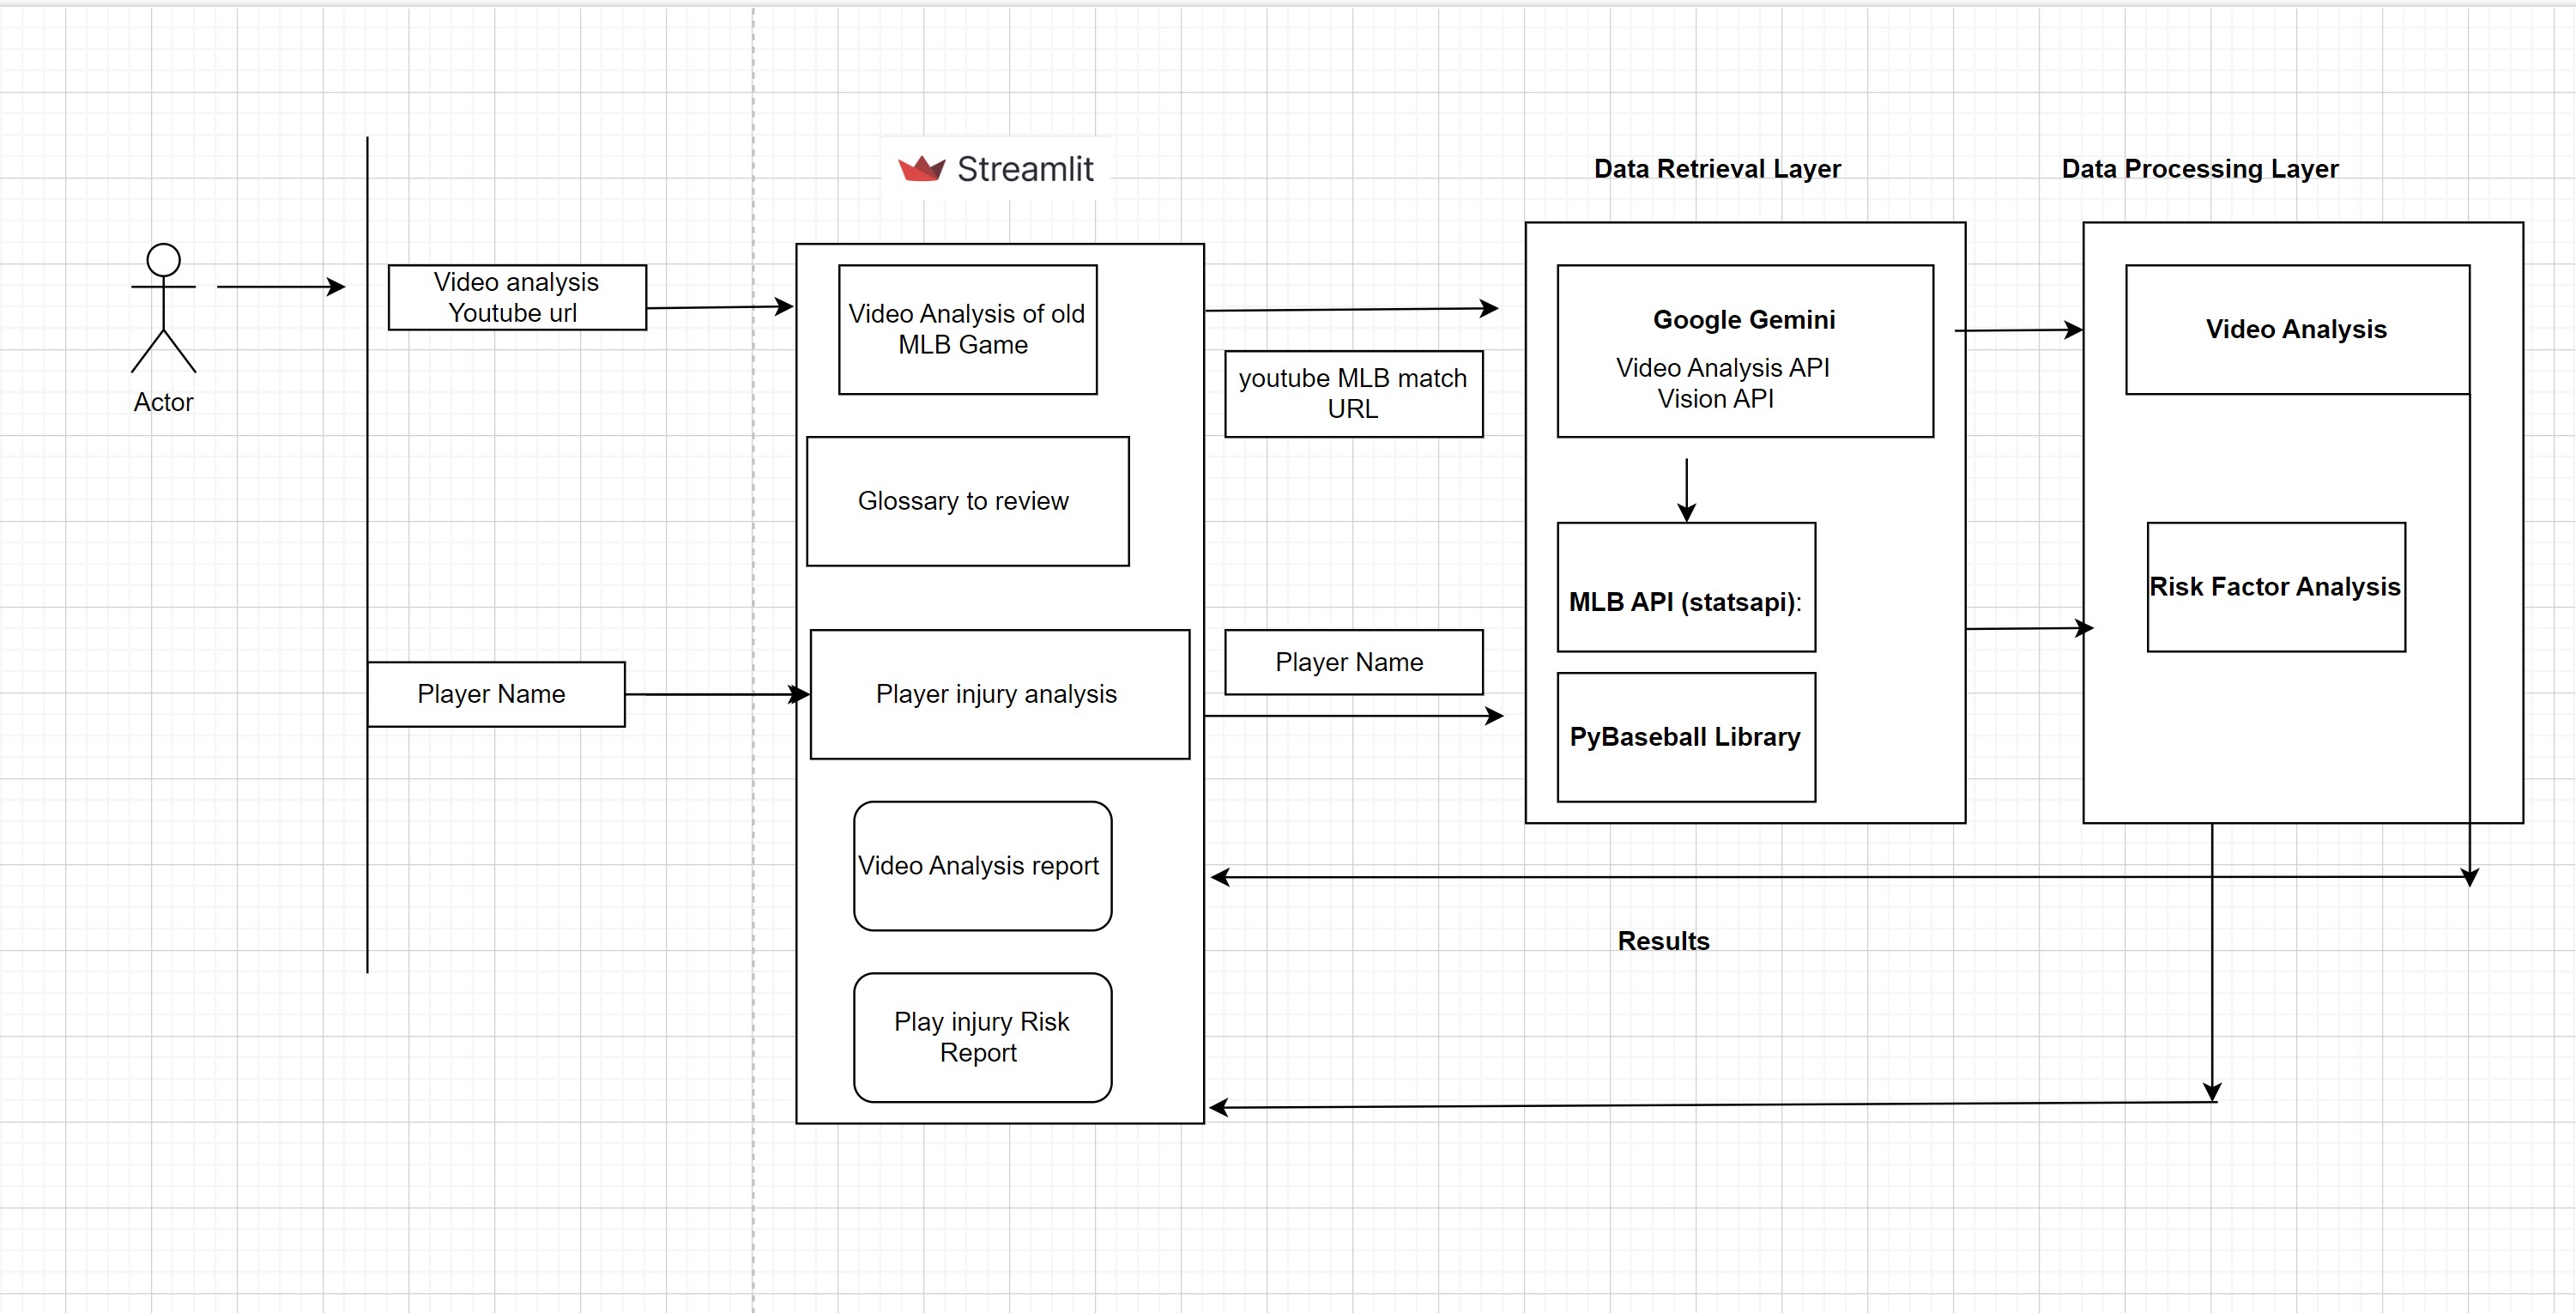
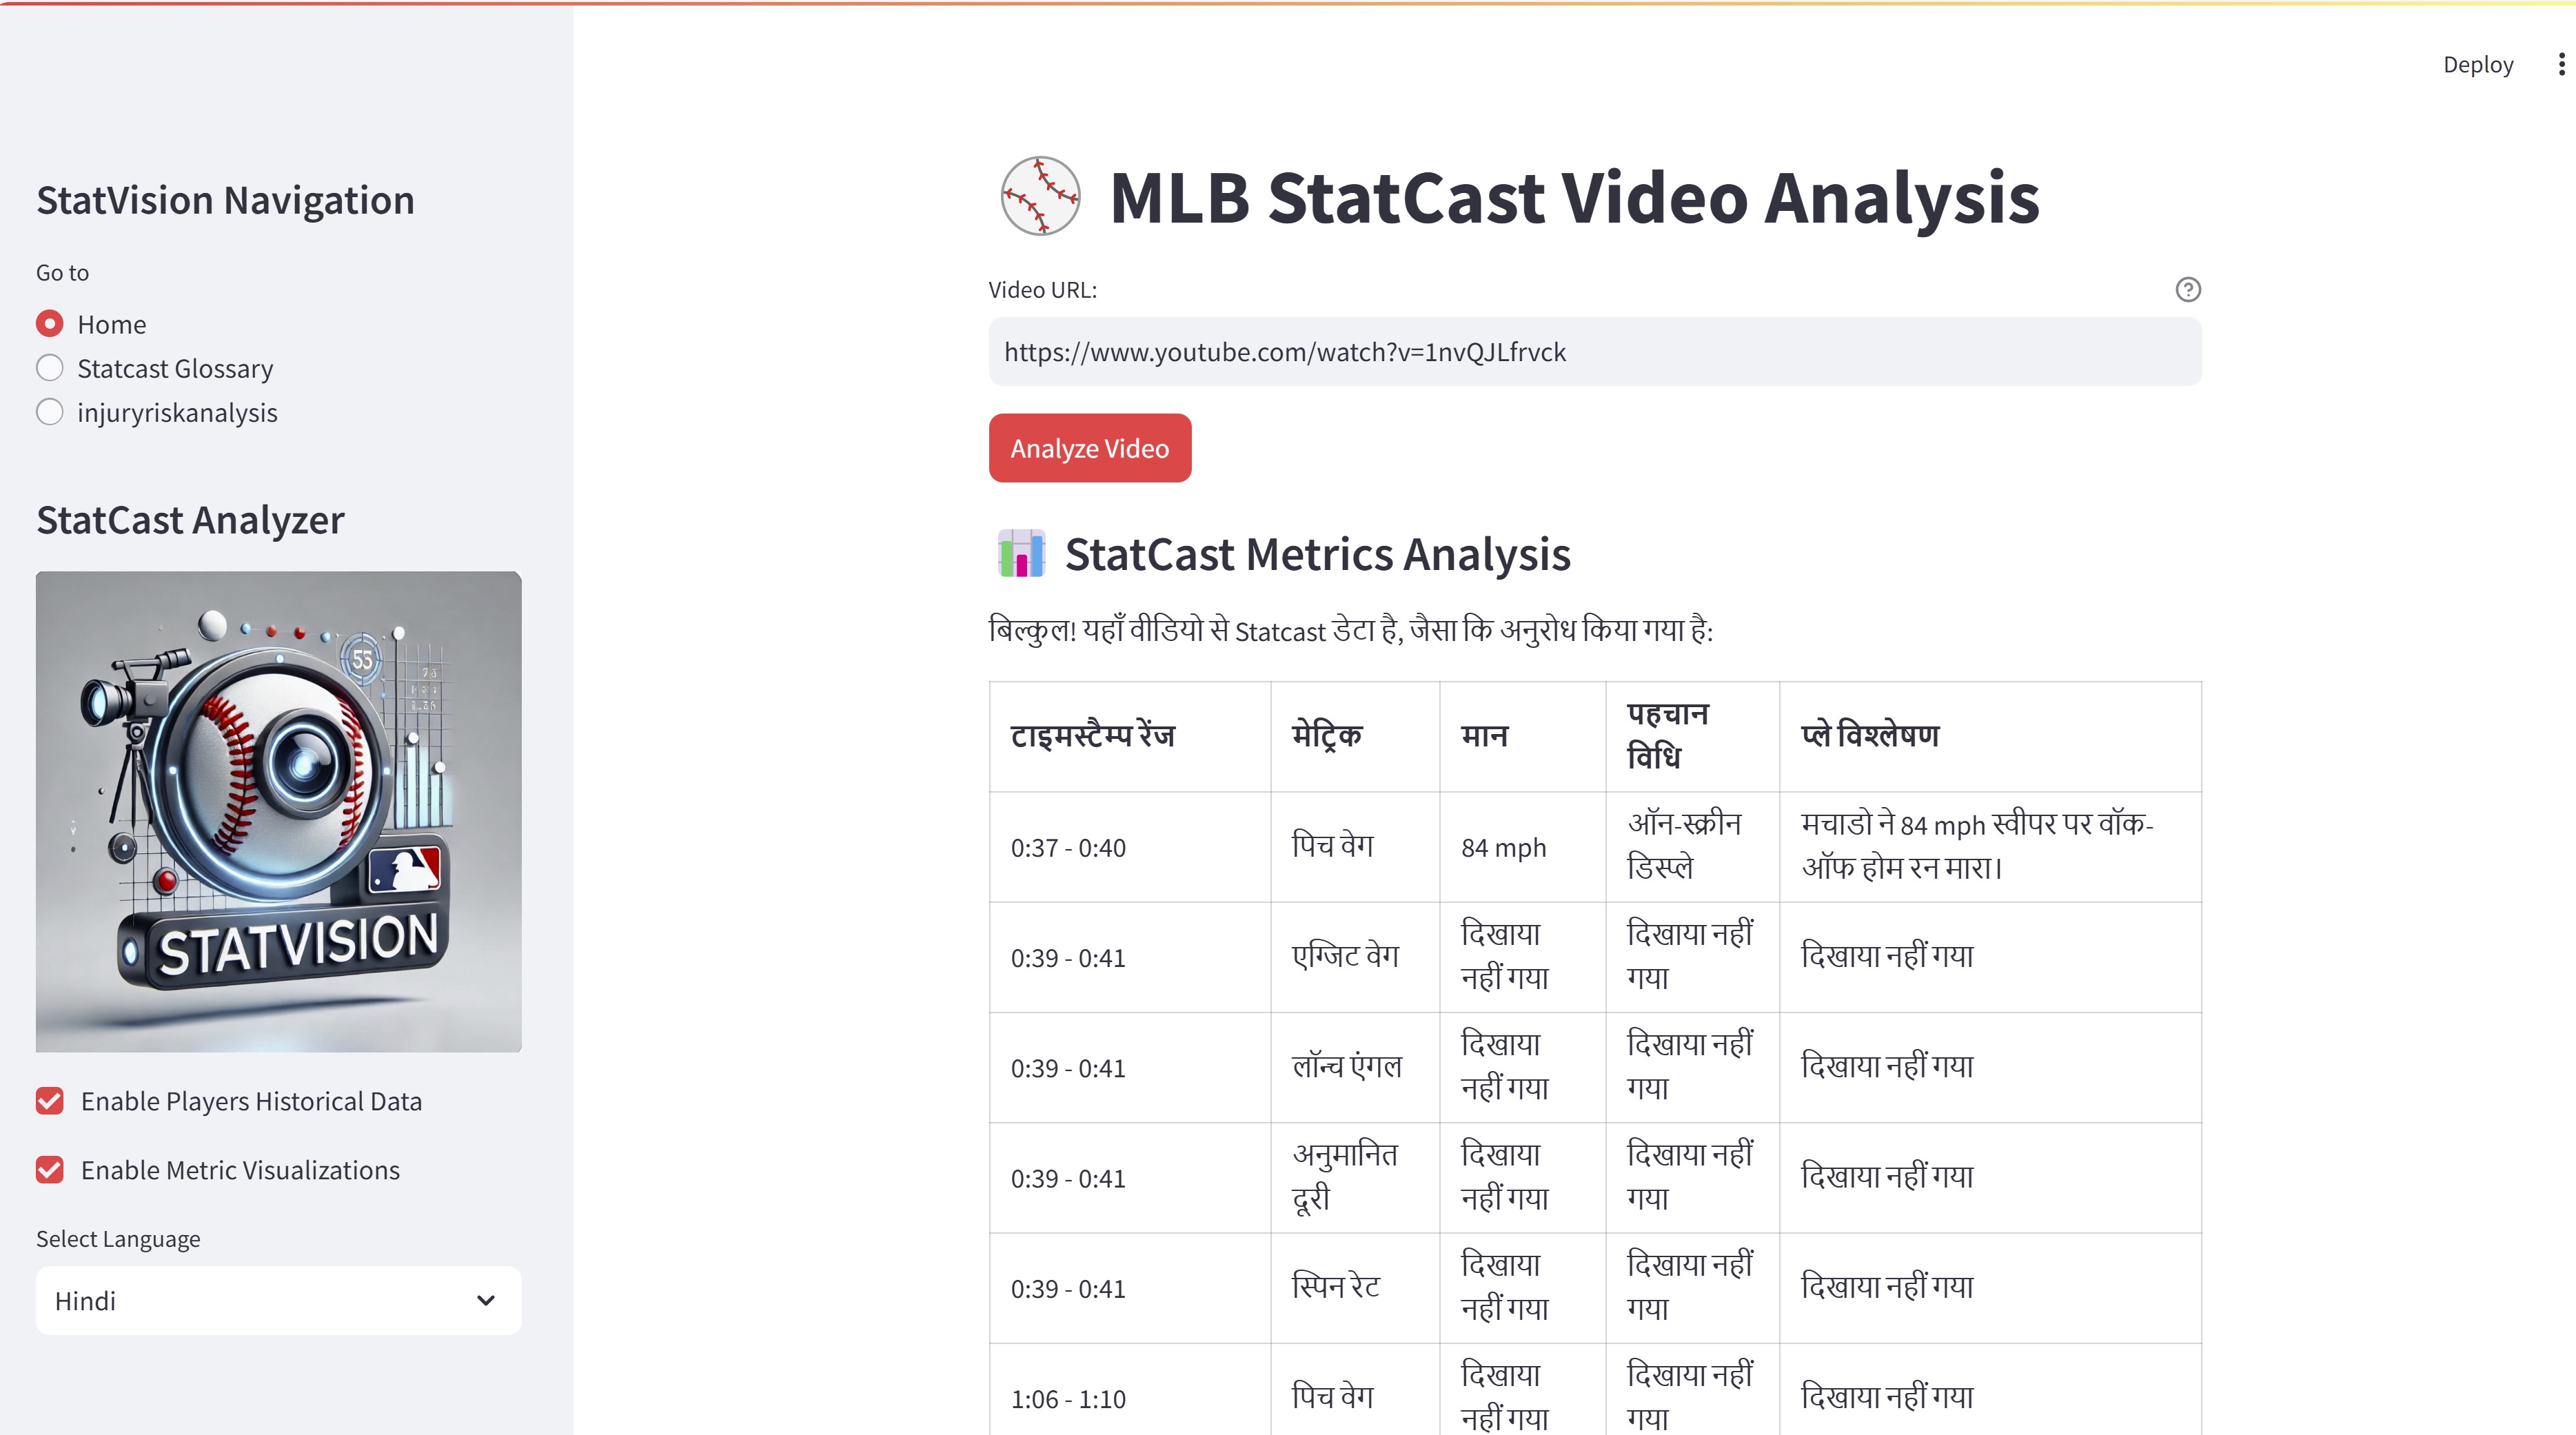
The Workflow User Input: The user enters a YouTube URL of a baseball game featuring the player of interest.
AI Analysis: The AI analyzes the video, extracting metrics such as pitch velocity, spin rate, and exit velocity. It also provides timestamps for each key metric occurrence in the video.
Player Data: The app fetches real-time StatCast data for players appearing in the video and provides a detailed performance breakdown, including season stats and any historical injuries.
Multilingual Translation: If the user selects a non-English language, the app translates the analysis and results into the specified language, ensuring accessibility for a global audience.
Visual Insights: Visualizations are generated for specific metrics like exit velocity or spin rate, giving users a graphical representation of player performance.
Injury Risk Detection: The app analyzes changes in performance over time to identify any potential injury risks related to changes in key metrics.
Technologies Used Vertex AI (Gemini 1.5 Pro): For AI-powered video analysis and multilingual translation. Google Cloud: For video processing, cloud storage, and overall scalability. StatsAPI and pybaseball: For retrieving player and team data, including real-time StatCast metrics. Streamlit: For building a user-friendly web application interface. Matplotlib: For generating visualizations of player performance metrics.
Challenges we ran into
Video Analysis Accuracy
Challenge: Analyzing video content for accurate and precise extraction of StatCast metrics, such as pitch velocity and exit velocity, proved to be challenging. We needed to ensure that the AI model was able to recognize key events in the game (e.g., pitch release, bat contact) and accurately extract the metrics at the correct timestamps. Solution: We iterated on the analysis prompt and fine-tuned the AI model’s parameters to improve the quality of the video analysis. Extensive testing on various types of baseball footage helped the model learn to identify key moments with higher accuracy. Player Name Recognition and Data Retrieval
Challenge: Extracting player names from the video analysis and matching them with the correct player stats from multiple data sources (MLB API, StatCast, etc.) was difficult. There were instances where player names were misspelled, or the AI couldn’t identify a player correctly, leading to incomplete or inaccurate data retrieval. Solution: We improved the player name extraction model by refining the natural language processing (NLP) prompt to be more robust. Additionally, we incorporated fallback mechanisms to manually verify or request user input if names were not recognized. Handling Diverse Video Content
Challenge: Not all YouTube videos provided clear, usable gameplay data. In some cases, the video had poor quality, wrong angles, or was missing key frames needed for analysis. This led to incomplete or non-accurate metrics being extracted. Solution: We implemented a video quality check to ensure that only videos with a clear view of the player and ball were processed. We also built error-handling logic to gracefully handle low-quality content and notify the user of the issue. Multilingual Translation Accuracy
Challenge: Ensuring that the translation of analysis content was both accurate and contextually appropriate in different languages was a tough hurdle. Baseball terminology doesn’t always have direct equivalents in other languages, and phrases could get lost in translation. Solution: We manually reviewed translations and adjusted the model prompts to make them more culturally and linguistically appropriate. Additionally, we tested the translations with native speakers to ensure that technical terms were correctly conveyed. Data Integration from Multiple Sources
Challenge: Integrating data from various sources (StatCast, pybaseball, and MLB API) with different formats and structures was complex. Synchronizing player data and ensuring that the correct stats were matched to the right player and video footage took time. Solution: We designed a unified data pipeline to ensure consistent data formatting and applied validation checks to ensure that the right player data was pulled from the right source. We also added logic to handle cases when certain stats were missing or incomplete. Scalability and Cloud Infrastructure
Challenge: Given the volume of data being processed (video files, player stats, real-time analytics), ensuring that the application would scale efficiently in the cloud was a concern. We were working with a limited timeframe and cloud resources. Solution: We optimized the app’s performance by caching frequently used data and processing video content in smaller, manageable chunks. We also made use of Google Cloud’s Vertex AI infrastructure to handle the heavy lifting in terms of model inference and cloud-based storage. User Experience (UX) Design
Challenge: Creating an intuitive and interactive interface that could seamlessly guide users through the analysis process was tricky. Since our app had a lot of moving parts (video input, player data, StatCast metrics, visualizations, translations), it was important to keep the UI clean and user-friendly. Solution: We worked iteratively with feedback from testers, refining the UI in Streamlit. We added clear instructions, tooltips, and warnings to guide users through the process. Additionally, we made sure the app was responsive and displayed meaningful error messages when something went wrong. Time Constraints and Limited Resources
Challenge: As with most hackathons, we were working under tight time constraints. Some features, such as the in-depth injury risk analysis, were more ambitious than we had time to fully implement. We also had limited resources to test the system with a diverse set of videos, which limited our ability to fully refine the analysis. Solution: We prioritized the core functionalities—video analysis, player data retrieval, and multilingual support—while leaving advanced features, like injury risk analysis, for future improvements. We also made use of mock data to simulate edge cases and ensure that the system worked under various scenarios. Model Safety and Bias Issues
Challenge: Ensuring that the AI models, particularly in language generation, didn’t produce harmful or biased content was an important concern. We had to make sure that the video analysis and text generation didn’t generate inappropriate or biased statements. Solution: We incorporated safety settings from Vertex AI, specifically targeting categories like hate speech, dangerous content, and harassment, to block any inappropriate content. We also conducted manual reviews of edge cases to ensure that the generated content remained respectful and unbiased. Final Testing and Deployment
Challenge: Just before the hackathon deadline, we ran into issues with deployment. The app was working perfectly in the development environment, but when deploying to the cloud, we encountered errors related to authentication, file paths, and API keys. Solution: We quickly debugged by reviewing the deployment logs and resolving issues related to environment variables, file paths, and API credentials. To ensure smooth deployment in the future, we automated the environment setup using Docker containers and conducted thorough testing before the final presentation.
Accomplishments that we're proud of
Video Analysis: The application takes a YouTube URL of a baseball game and extracts key performance metrics (pitch velocity, spin rate, etc.) from the video content using AI-powered models from Vertex AI.
Multilingual Support: The app supports multiple languages (Spanish, French, Japanese, etc.), enabling users from different regions to access the analysis and understand it in their native language.
Player Data: The tool fetches StatCast data for players to correlate the video analysis with real-life statistics. The application pulls data from MLB API and pybaseball, including performance stats and historical injury data.
Player Comparison: Users can compare current performance data with historical stats to identify trends, performance dips, or potential injury risks.
Visualizations: The app generates easy-to-understand visualizations (like histograms and scatter plots) for important metrics like exit velocity and spin rate, helping users interpret complex data.
Injury Risk Analysis: Using recent StatCast data, the app identifies potential injury risks by detecting sharp changes in performance metrics, helping players and teams proactively address possible concerns.
What we learned
Deploying slim images makes the deployment faster
AI and Model Safety Considerations
Implementing AI safety settings was an eye-opening experience. It’s not enough to just create a powerful AI model—it’s essential to actively monitor and control the outputs to ensure that they adhere to ethical standards, especially when dealing with potentially sensitive content. We realized that building models that are both powerful and safe requires continuous evaluation and fine-tuning, particularly around issues like bias, language generation, and harmful content. Video Analysis is Complex but Powerful
While the AI's ability to analyze video content in real-time was impressive, we learned that accurate video analysis is a very challenging task. It involves recognizing nuanced events, understanding context, and sometimes interpreting low-quality or unclear footage. The accuracy of video processing heavily depends on data quality and model training. We realized that training and refining models for specific use cases (like sports video) takes a lot of time and iterative testing to get right. Data Integration Can Be Tricky
Integrating multiple data sources, especially those with differing structures (e.g., StatCast, MLB API, pybaseball), highlighted the challenges of data consistency and data pipeline management. We learned the importance of designing flexible data pipelines that can handle missing, incomplete, or inconsistent data, as well as how to validate data from multiple sources before processing it in real time. The Power of Streamlit for Rapid Prototyping
Using Streamlit was one of the most effective parts of our development process. The framework allowed us to quickly build, test, and iterate on the user interface with minimal overhead, saving us precious time. We learned that while it’s a great tool for rapid prototyping, careful attention to UX/UI design is still needed to ensure the final product is polished and intuitive.
What's next for StatVision
- Real-time Game Data Integration Enhancement: Integrate live real-time game data (such as pitch-by-pitch data, player stats, and more) directly into the app so users can get insights during the game. Benefit: Users can receive immediate feedback and analysis as the game progresses, creating an interactive, real-time experience.
Advanced Video Analysis Enhancement: Incorporate object detection and motion tracking to automatically detect key events, like pitch release, bat impact, and catcher's movements, directly from the video. Benefit: Improve the accuracy of event recognition and reduce dependency on pre-recorded timestamps, allowing for faster analysis.
Player Comparison Tool Enhancement: Add a player comparison feature, allowing users to compare multiple players’ performances side by side based on StatCast data, MLB stats, or even specific metrics like exit velocity, launch angle, etc. Benefit: This would be valuable for coaches, analysts, and fans who are trying to compare the performance of different players in various contexts (e.g., season vs. career performance).
Personalized Insights and Recommendations Enhancement: Implement an AI-powered recommendation system that offers personalized insights based on a user’s preferences, such as favorite teams or specific metrics. Benefit: Users can receive tailored advice, tips, and recommendations on players or plays they should focus on, improving engagement with the app
5.Enhanced Injury History Analysis Enhancement: Include a more detailed analysis of a player’s injury history (e.g., muscle strains, joint issues) in combination with performance metrics (such as pitch velocity, bat swing, etc.). Benefit: By identifying recurring injury patterns and correlating them with specific performance metrics or training regimes, teams can better predict which players are at higher risk.
- Environmental and Game Context Factors Enhancement: Include environmental factors (e.g., weather conditions, game intensity, field type) and game context (e.g., pitch count, batter-pitcher matchups, game length) as part of the risk assessment. Benefit: Environmental stressors like extreme weather, high-intensity games, or fast-paced seasons can contribute to injury risks, and adjusting play strategies to these factors can improve risk management.
7.Nutrition and Hydration Monitoring Enhancement: Incorporate nutrition and hydration data to assess whether players are meeting their dietary needs, which directly impact physical performance and injury risk. Benefit: Proper nutrition and hydration are crucial for muscle recovery and overall performance. Tracking these factors can help avoid fatigue-related injuries and improve player longevity.
- Real-time Risk Monitoring Enhancement: Implement real-time monitoring tools during games or practices that assess player fatigue, physical stress, or biomechanical irregularities and provide immediate feedback on potential injury risks. Benefit: This allows for proactive adjustments during gameplay (e.g., pulling a player from the field to prevent further strain) rather than reactive analysis after the fact.
9.Psychological Stress Assessment Enhancement: Include metrics related to mental stress, like focus, anxiety, or emotional exhaustion, which can contribute to injury risk and performance decline. Benefit: Mental health is closely tied to physical performance, and players experiencing high psychological stress may be more prone to injuries due to decreased concentration, coordination, or fatigue.
Built With
- appengine
- gemini
- streamlit
- vertexai
- visionapi


Log in or sign up for Devpost to join the conversation.