
Predictive Travel Model Using SkyScanner API and R and Trip Destination Recommender APP
Mission
The purpose of this project was to leverage the SkyScanner API to tackle a complex problem: helping a group of friends with diverse interests choose the best travel destination. Each friend had different preferences, and our goal was to develop a predictive model that could assess the likelihood of each person deciding to go on a proposed trip, based on various characteristics of that destination.
All code was written primarily in R using RStudio IDE, with a few auxiliary blocks in Python when needed. The primary file format used throughout the project was R Markdown (.Rmd), which allowed us to combine code, documentation, and analysis in a single environment.
Accessing the SkyScanner API
Here’s an example of how we queried the SkyScanner API to retrieve flight and airport data in a structured dataframe format:
library(httr)
library(jsonlite)
library(dplyr)

api_key <- "sh96749013922489669243964410****"

obtener_vuelos <- function(origen, destino, fecha_salida, fecha_regreso = NULL, pais = "ES", moneda = "EUR", idioma = "es-ES") {
  url <- paste0("https://skyscanner-skyscanner-flight-search-v1.p.rapidapi.com/apiservices/browsequotes/v1.0/",
                pais, "/", moneda, "/", idioma, "/", origen, "/", destino, "/", fecha_salida)

  if (!is.null(fecha_regreso)) {
    url <- paste0(url, "/", fecha_regreso)
  }

  res <- GET(url, add_headers(
    "X-RapidAPI-Key" = api_key,
    "X-RapidAPI-Host" = "skyscanner-skyscanner-flight-search-v1.p.rapidapi.com"
  ))

  if (status_code(res) != 200) {
    warning(paste("Request failed with status:", status_code(res)))
    return(NULL)
  }

  json_data <- fromJSON(content(res, as = "text", encoding = "UTF-8"), flatten = TRUE)

  if (length(json_data$Quotes) == 0) {
    message("No results found.")
    return(NULL)
  }

  vuelos <- lapply(json_data$Quotes, function(q) {
    carrier_id <- q$OutboundLeg$CarrierIds[1]
    carrier_name <- json_data$Carriers$Name[json_data$Carriers$CarrierId == carrier_id]
    origin_id <- q$OutboundLeg$OriginId
    destination_id <- q$OutboundLeg$DestinationId
    origin_name <- json_data$Places$Name[json_data$Places$PlaceId == origin_id]
    destination_name <- json_data$Places$Name[json_data$Places$PlaceId == destination_id]

    data.frame(
      Price = q$MinPrice,
      Direct = q$Direct,
      Airline = ifelse(length(carrier_name) > 0, carrier_name, NA),
      Origin = ifelse(length(origin_name) > 0, origin_name, NA),
      Destination = ifelse(length(destination_name) > 0, destination_name, NA),
      DepartureDate = q$OutboundLeg$DepartureDate,
      stringsAsFactors = FALSE
    )
  })

  return(bind_rows(vuelos))
}
Data Processing & Logistic Regression Modeling
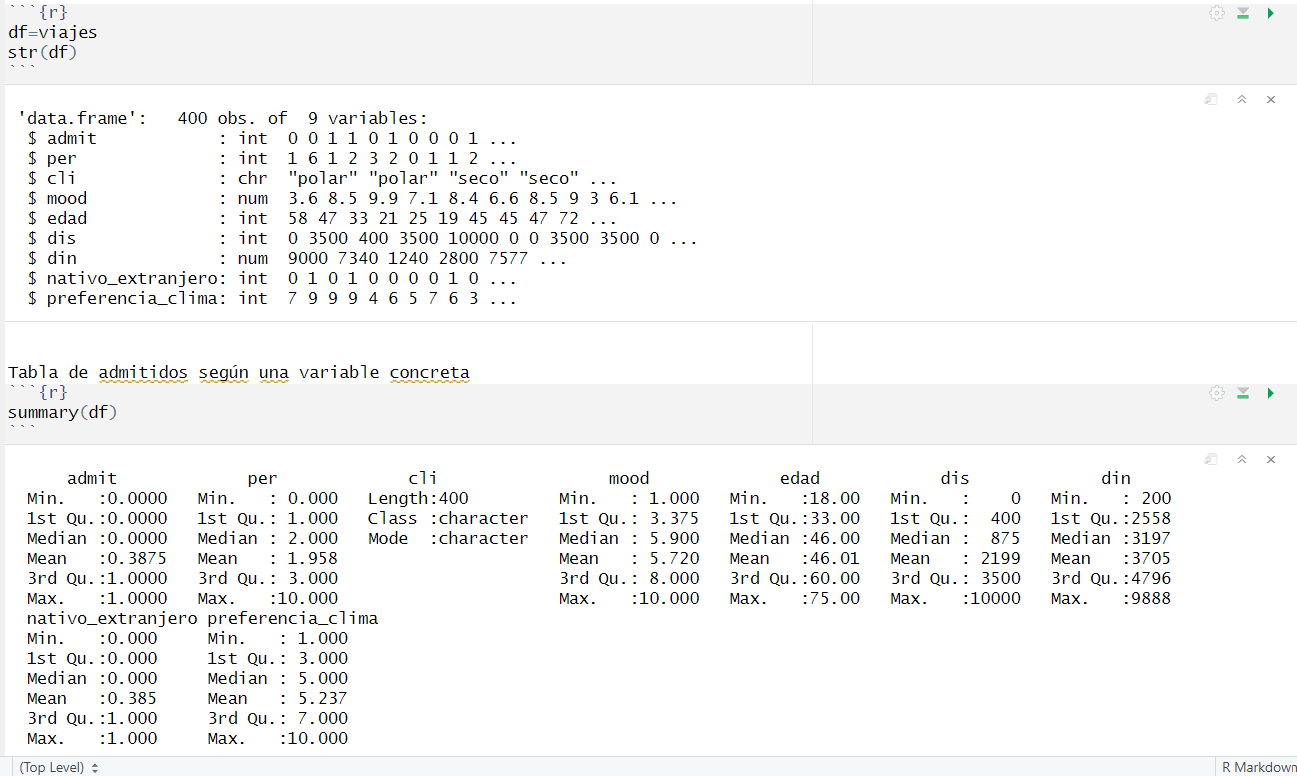
After retrieving and cleaning the flight data (around 400 observations), we tailored the dataset to train a logistic regression model (logit model) to predict travel decisions.
Final Dataset
We exported our dataset to a .csv file and used it as input to define our model variables.
Data Description
The dataset contains information on travel decisions made by several users. The binary response variable admit is:
0: the user decides not to go on the trip
1: the user does go
We modeled the probability of a user accepting the trip based on the following variables:
per: Number of travel companions
mood: Peacefulness of the destination (scale 0–10)
dis: Distance to the destination (in kilometers)
din: Estimated cost (in EUR)
idi: Language spoken at the destination (0 = native, 1 = foreign)
temp: Climate factor (0–10)
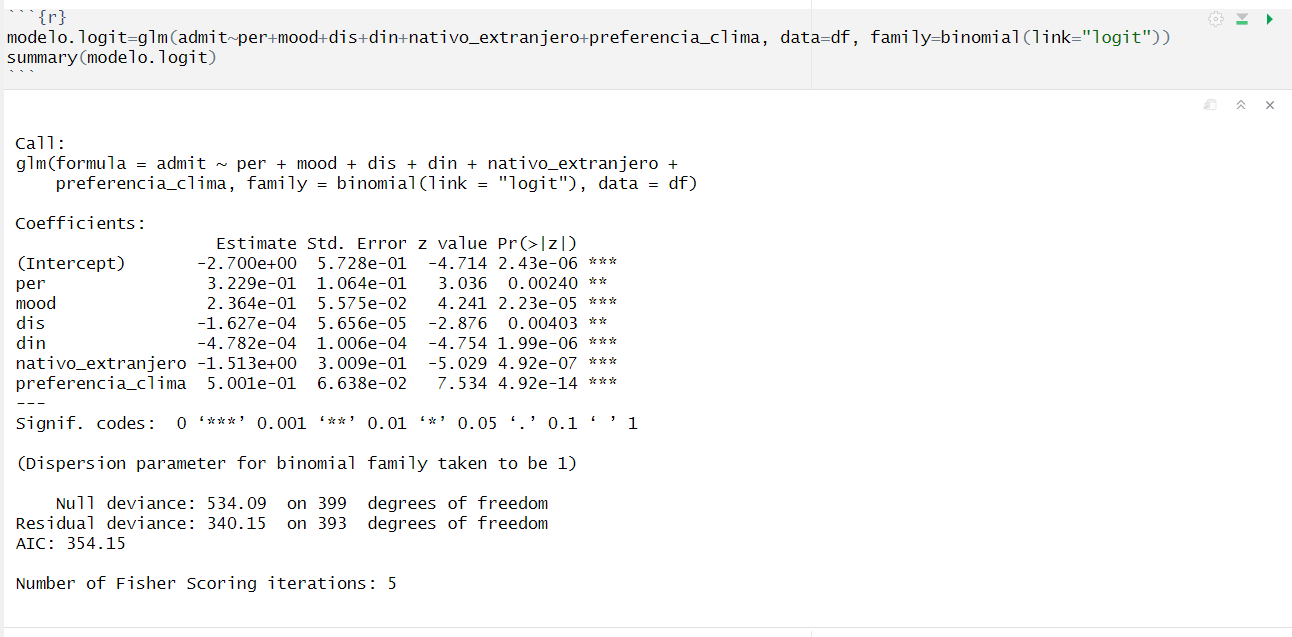
Model Summary
The logistic model produced reliable results, with statistically significant coefficients (p-values) for most variables.
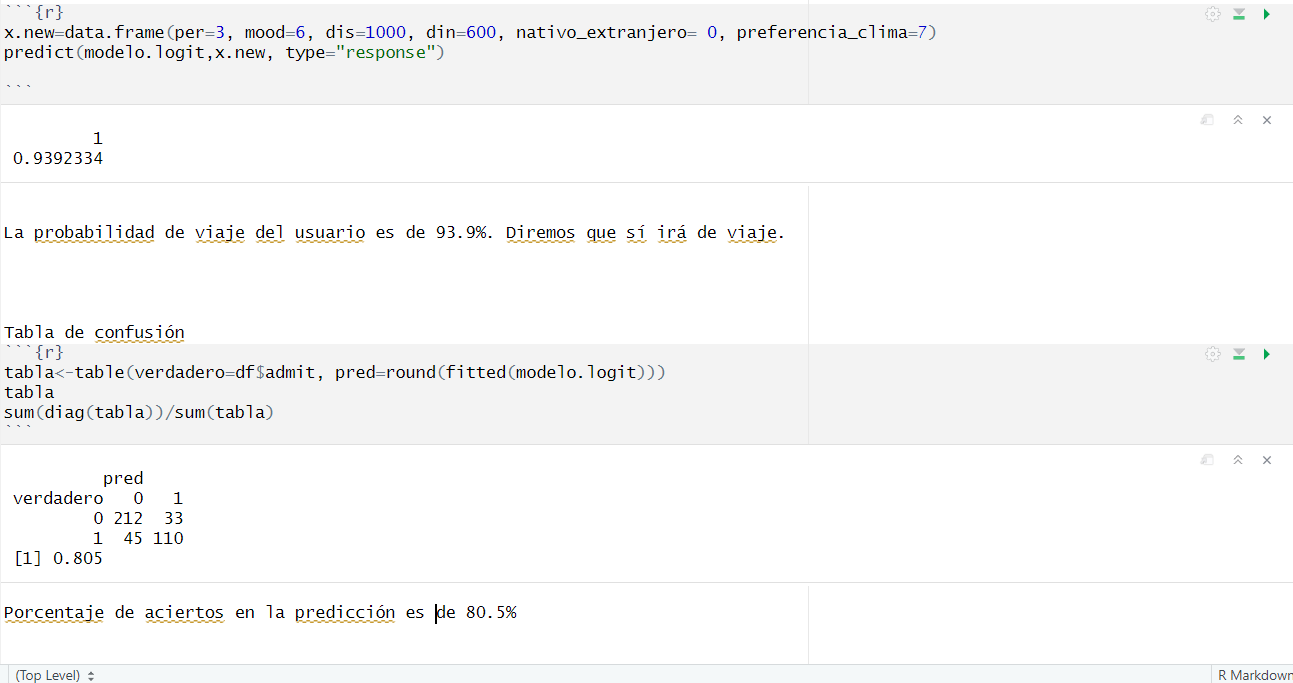
Making Predictions
With the trained model, we could predict whether a new user would decide to go on a trip based on a set of destination attributes.
Prediction Accuracy:
Our model achieved a prediction accuracy of 80.5%, indicating solid generalization performance.
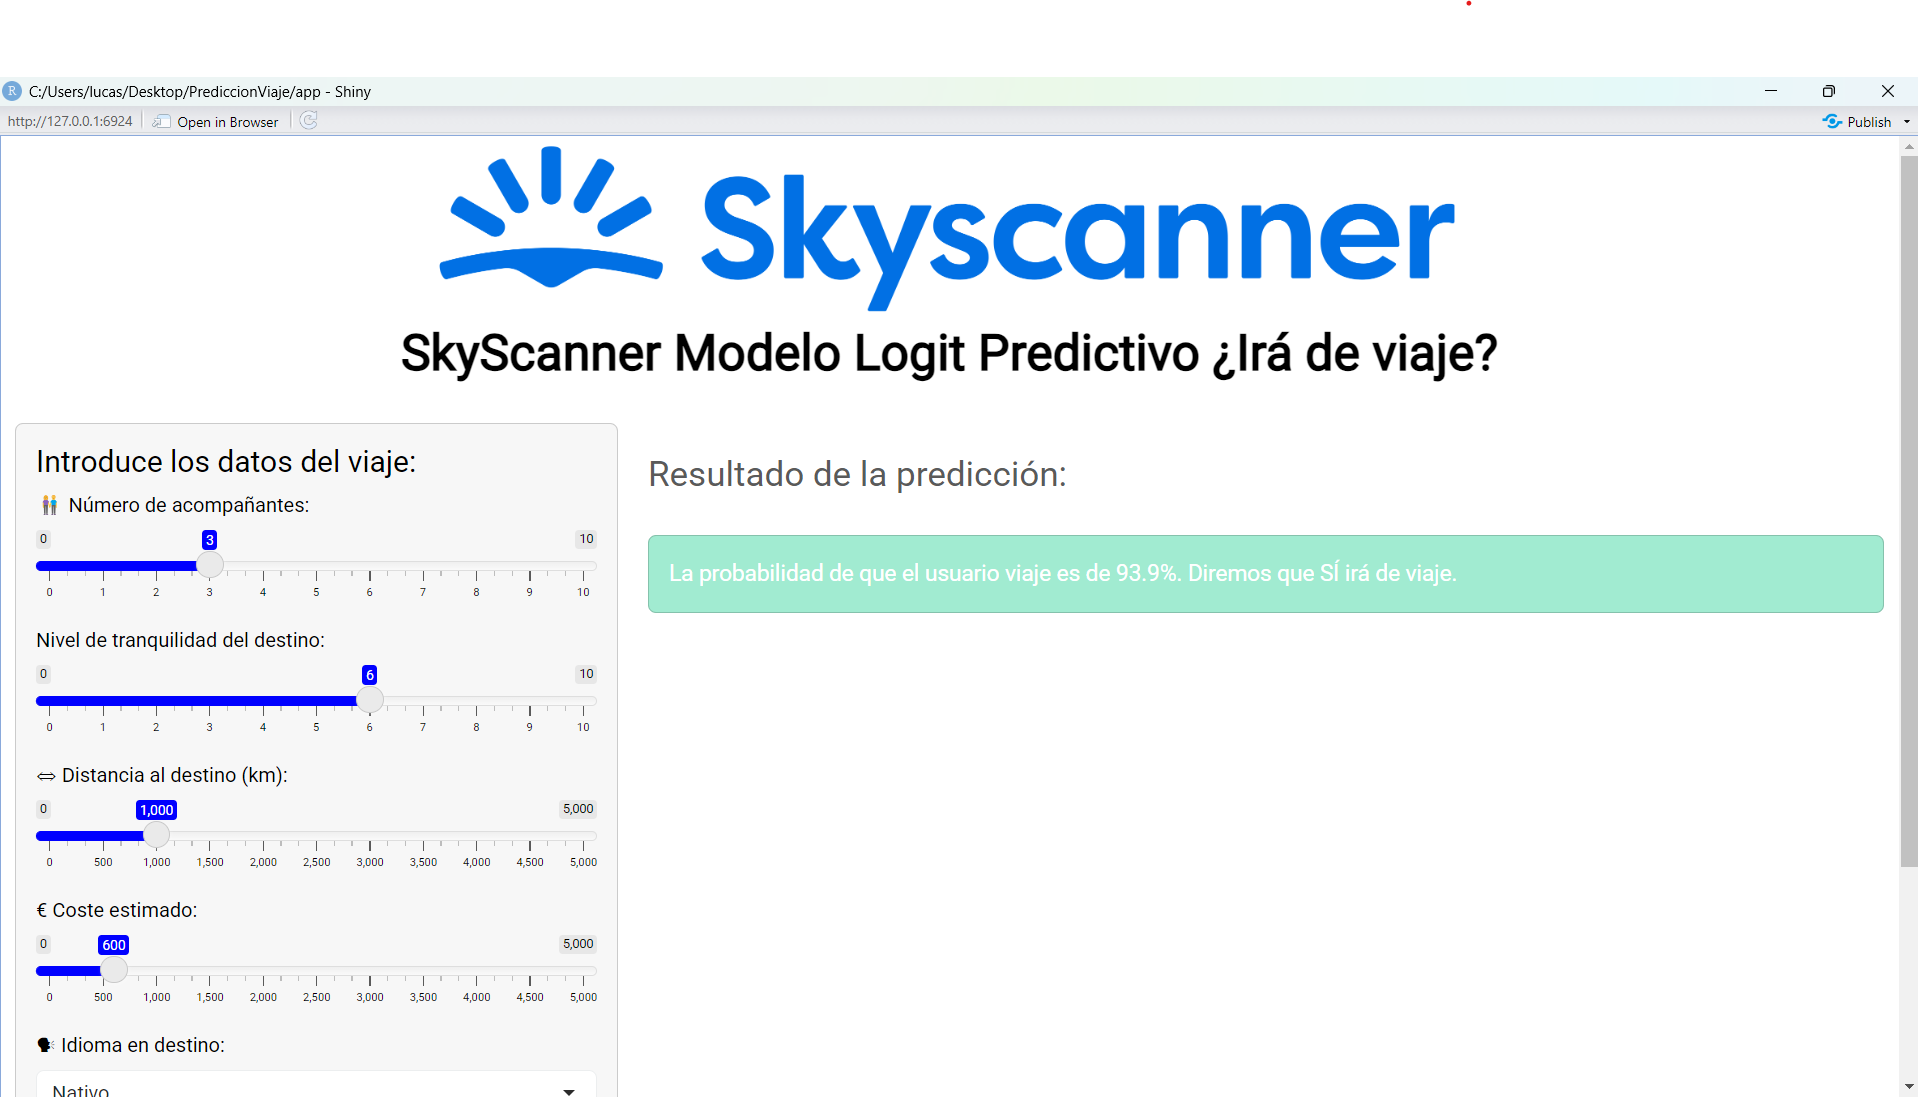
Developing the User Interface with Shiny
To make our model accessible and interactive, we created a graphical user interface using the Shiny library in R.
library(shiny)
library(shinythemes)
library(bslib)

mi_tema <- bs_theme(
  version = 5,
  bootswatch = "minty",
  primary = "blue",
  secondary = "blue",
  base_font = font_google("Roboto"),
  heading_font = font_google("Roboto")
)

ui <- fluidPage(
  tags$head(tags$title("Travel Prediction")),
  tags$img(src = "logo.png", height = "150px", style = "display: block; margin-left: auto; margin-right: auto;"),

  theme = mi_tema,
  div(
    h1("SkyScanner Logit Predictive Model: Will You Travel?",
       style = "text-align: center; font-weight: bold; color: black;")
  ),
  br(),
  sidebarLayout(
    sidebarPanel(
      h4("Enter trip details:"),
      sliderInput("per", "Number of companions:", min = 0, max = 10, value = 3),
      sliderInput("mood", "Peacefulness of the destination:", min = 0, max = 10, value = 6),
      sliderInput("dis", "Distance (km):", min = 0, max = 5000, value = 1000, step = 100),
      sliderInput("din", "Estimated Cost (EUR):", min = 0, max = 5000, value = 600, step = 50),
      selectInput("nativo_extranjero", "Language spoken:", choices = c("Native" = 0, "Foreign" = 1)),
      sliderInput("preferencia_clima", "Climate Preference (0–10):", min = 0, max = 10, value = 7),
      br(),
      actionButton("predecir", "Predict", class = "btn btn-success btn-lg")
    ),
    mainPanel(
      br(),
      h3("Prediction Result:"),
      br(),
      wellPanel(
        style = "background-color: #A1EBD1; border-left: 5px solid: #A1EBD1",
        uiOutput("resultado")
      )
    )
  )
)

server <- function(input, output) {
  observeEvent(input$predecir, {
    x.new <- data.frame(
      per = input$per,
      mood = input$mood,
      dis = input$dis,
      din = input$din,
      nativo_extranjero = as.numeric(input$nativo_extranjero),
      preferencia_clima = input$preferencia_clima
    )

    prob <- predict(modelo.logit, x.new, type = "response")

    mensaje <- sprintf("The probability that the user will travel is %.1f%%.\n", prob * 100)

    if (prob >= 0.5) {
      mensaje <- paste0(mensaje, "Prediction: YES, the user will travel.")
    } else {
      mensaje <- paste0(mensaje, "Prediction: NO, the user will not travel.")
    }

    output$resultado <- renderUI({
      tags$div(style = "color: white; font-size: 18px; line-height: 1.6;", mensaje)
    })
  })
}

shinyApp(ui = ui, server = server)
Finally, we created an app using real data flights price with the amadeus API. The app consists in an user request with this parameters: number of people, budget, dates, departure and the preference of a climate. We take some possibles places and we analyze it with this parameters. The app sends the top 3 destinations to the user using the stadistic journey app.
Trip Destination Recommender
A desktop application that helps you find the top 3 travel destinations from your departure city, based on your budget, travel dates, distance preferences and climate tastes. Under the hood it uses:
- The Amadeus API to discover nearby airports and flight offers
- OpenWeatherMap to classify current climate in each destination
- A logistic regression predictive model (trained on
viajes.csv) to score each option by affinity
🚀 Features
Customizable search parameters
- Number of travelers
- Budget range (min & max price in EUR)
- Departure city
- Maximum flight distance (km)
- Departure & return dates (YYYY‑MM‑DD)
- Climate preference (
tropical,dry,polar)
- Number of travelers
Data sources & scoring
- Nearby airports within your maximum distance via Amadeus
- Best flight for each airport (price, carrier, duration)
- Climate score (1–10) by comparing actual temperature classification against your preference
- Predictive affinity via a trained logistic‑regression model, using features:
per(number of people)dis(distance in km)din(flight price in EUR)nativo_extranjero(same‑country flag)preferencia_clima(climate score)
- Nearby airports within your maximum distance via Amadeus
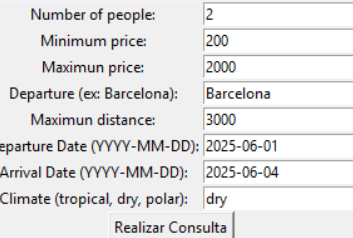
GUI
Built with Tkinter: fill in the form, click Realizar Consulta, and see your top‑3 destinations with estimated price and probability.
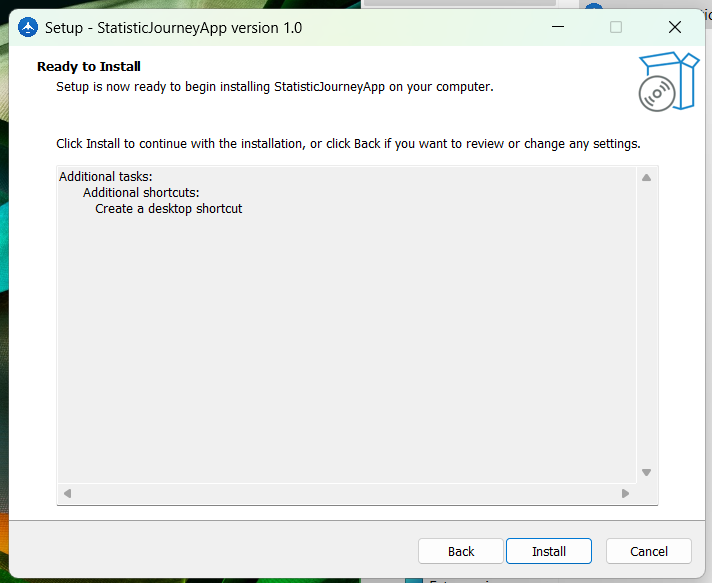
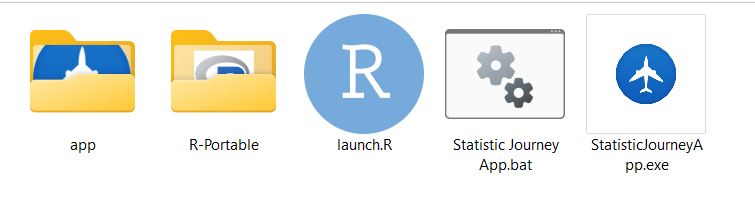
Final Packaging & App Deployment
To make the application easily executable on any computer we installed a portable version of R to avoid dependency issues and organized the app directory into a distributable format. We then used Inno Setup Compiler to generate a Windows installer for the final product.
Conclusion
This project demonstrates how to integrate external data via APIs and perform predictive modeling using logistic regression, but also how to deploy a full-fledged interactive application. The result: a functional tool that can assist users in making personalized travel decisions based on their preferences.

Log in or sign up for Devpost to join the conversation.