Inspiration
Hackathon challenges and available data online.
What it does
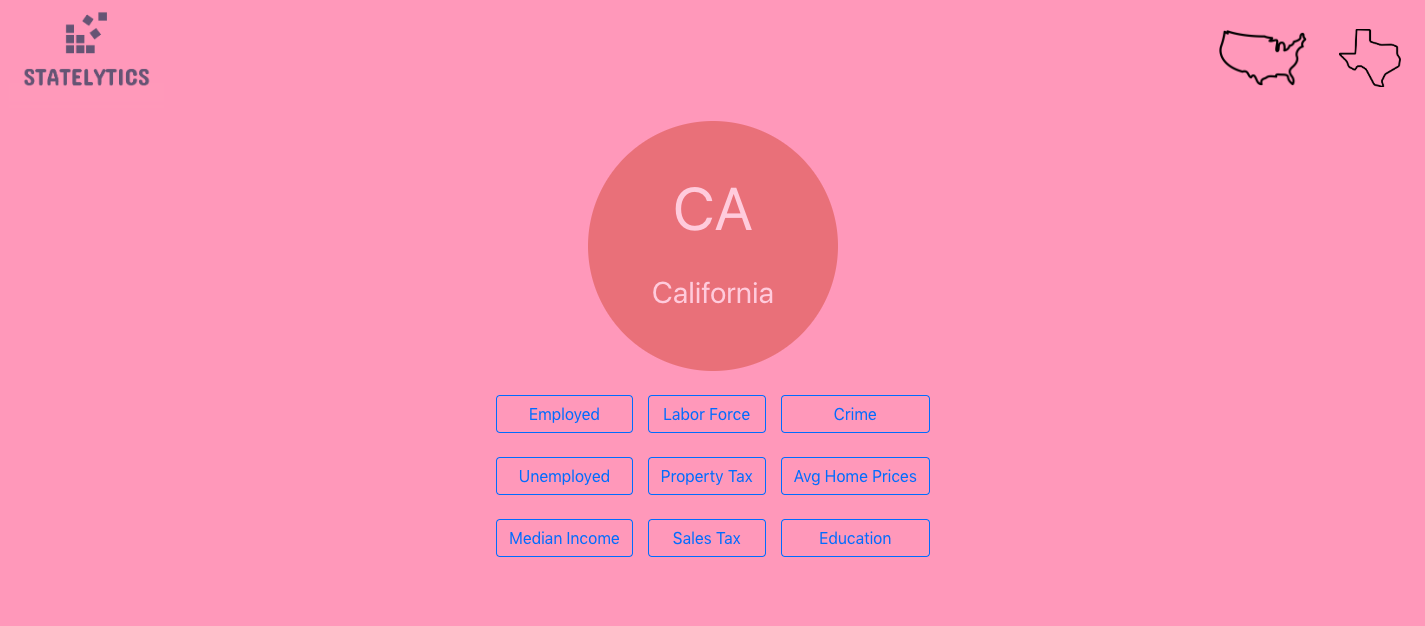
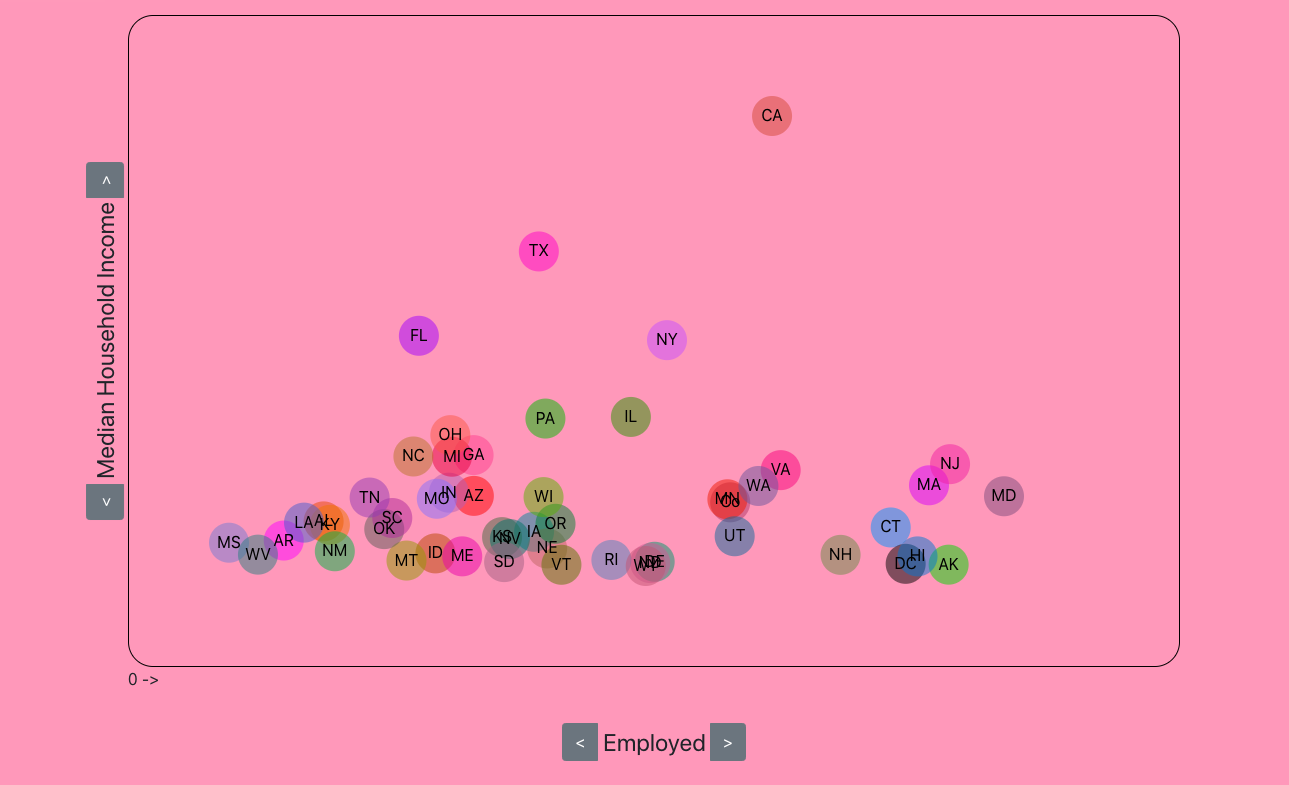
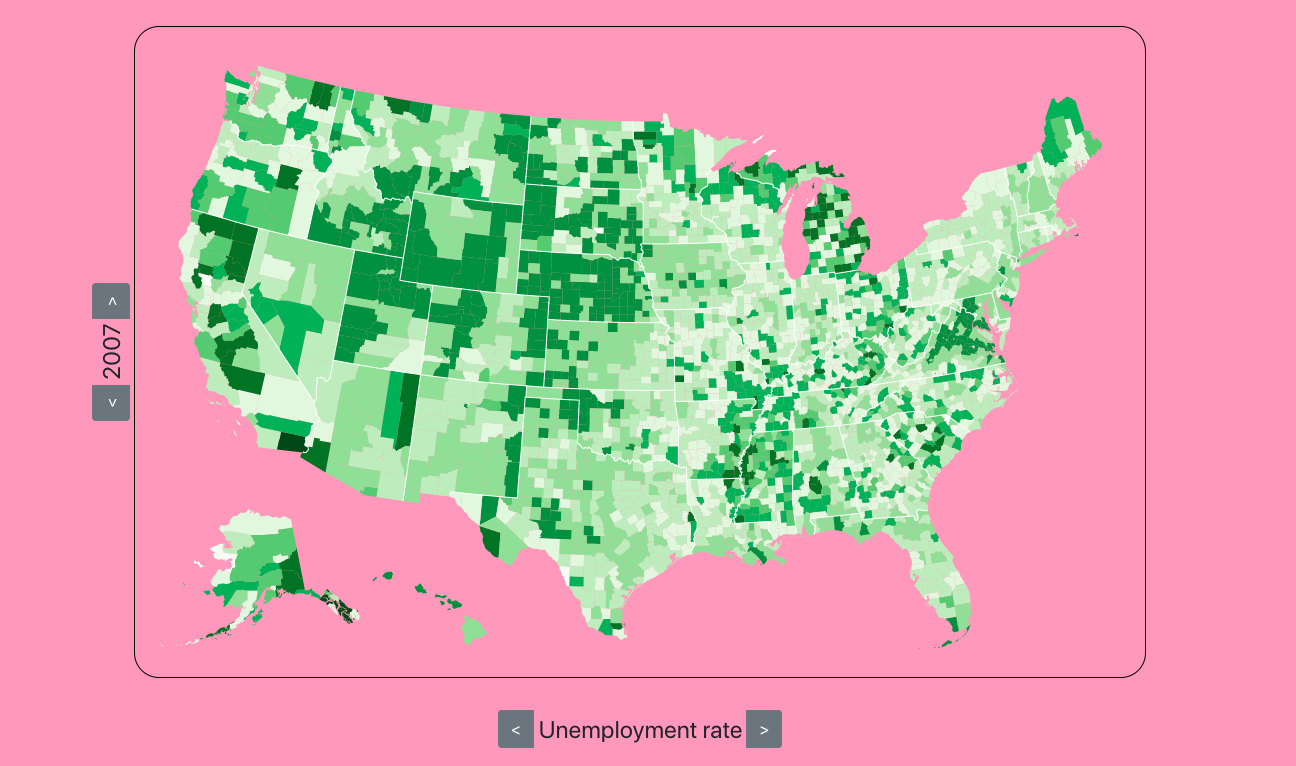
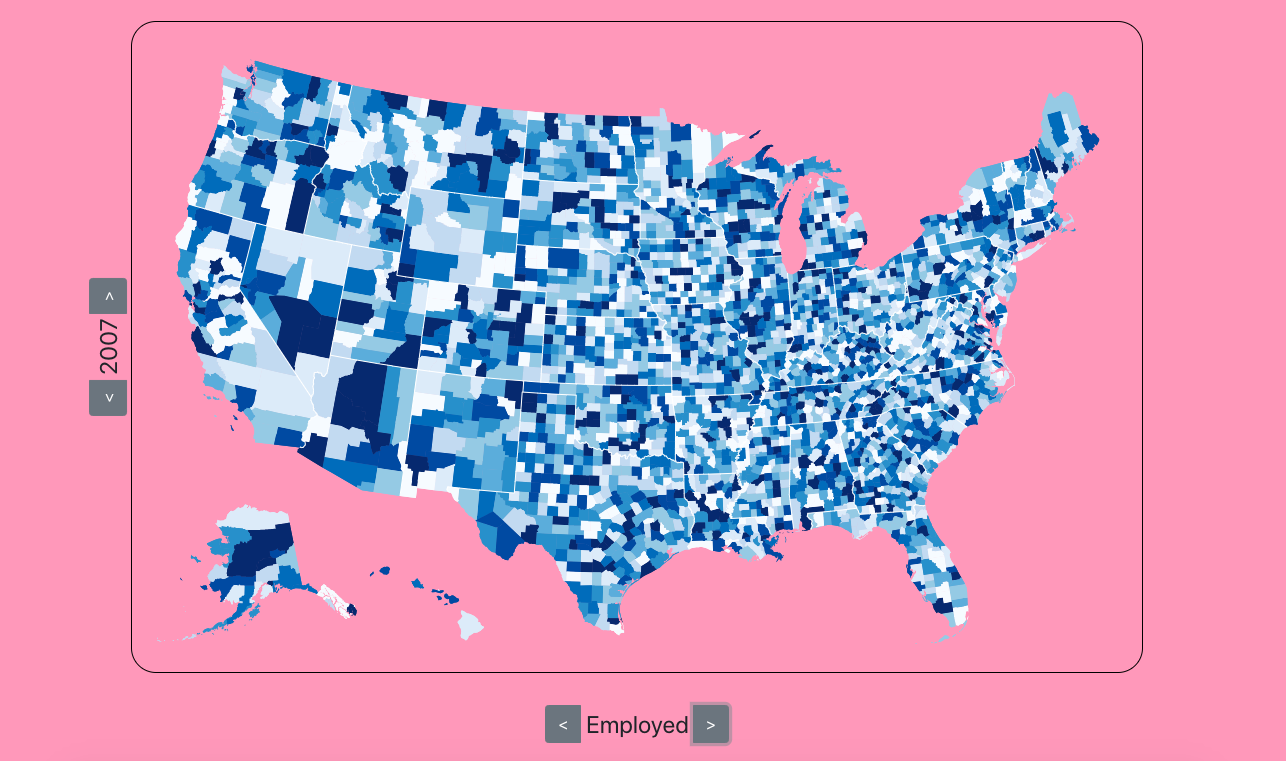
Provides data visualization for socioeconomic statistics in the US such as: poverty rates, employment, tax rates, median income, mortgage rates, education, and crime.
How we built it
Built using React.js, d3.js, Firebase, node.js, and Git.
Challenges we ran into
Designing an appealing frontend and effectively displaying complex datasets.
Accomplishments that we're proud of
Deploying the application using Firebase and succeeding in delivering a comprehensive data analytics tool.
What we learned
Improved React skills and learned how to use d3.js for data visualization.
What's next for Statelytics
Add more datasets and more utility and data comparisons to the app.

Log in or sign up for Devpost to join the conversation.