-
-
Previous
-
Updated
Inspiration State Farm’s challenge, “The Worst Day, at Scale,” asked how to find the people with the most urgent needs after a disaster and make sure no one is overlooked. We noticed that help usually goes to whoever reaches out first. Those people have working phones, power and internet, and are often the least hurt. The people who can’t call are older neighbors, people on medical equipment, and people without a car. That gave us the idea behind our name: silence isn’t safety, it can be the warning sign.
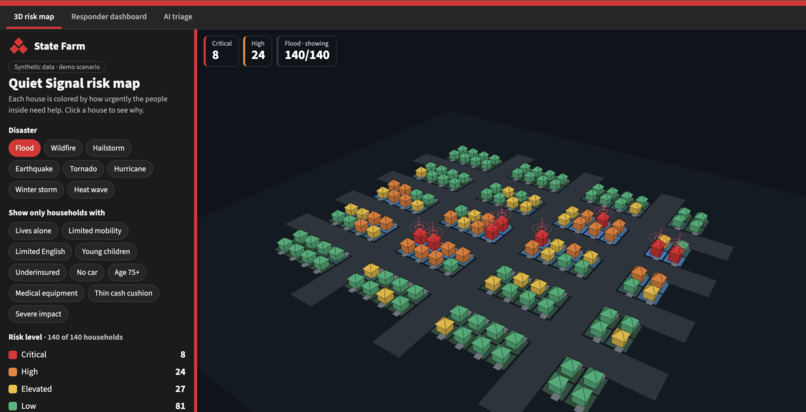
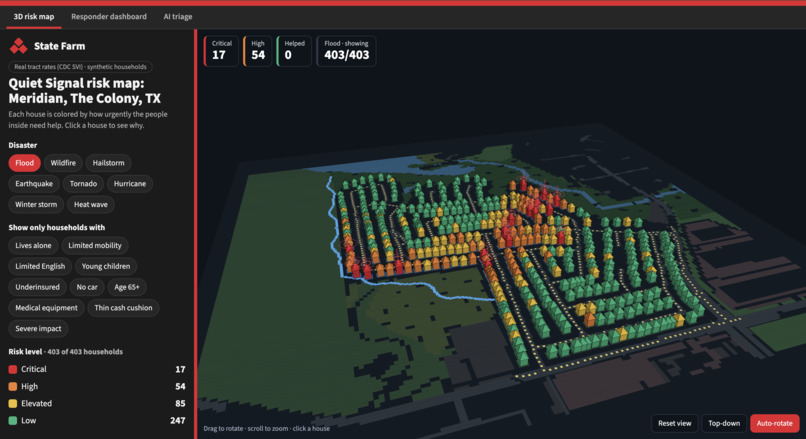
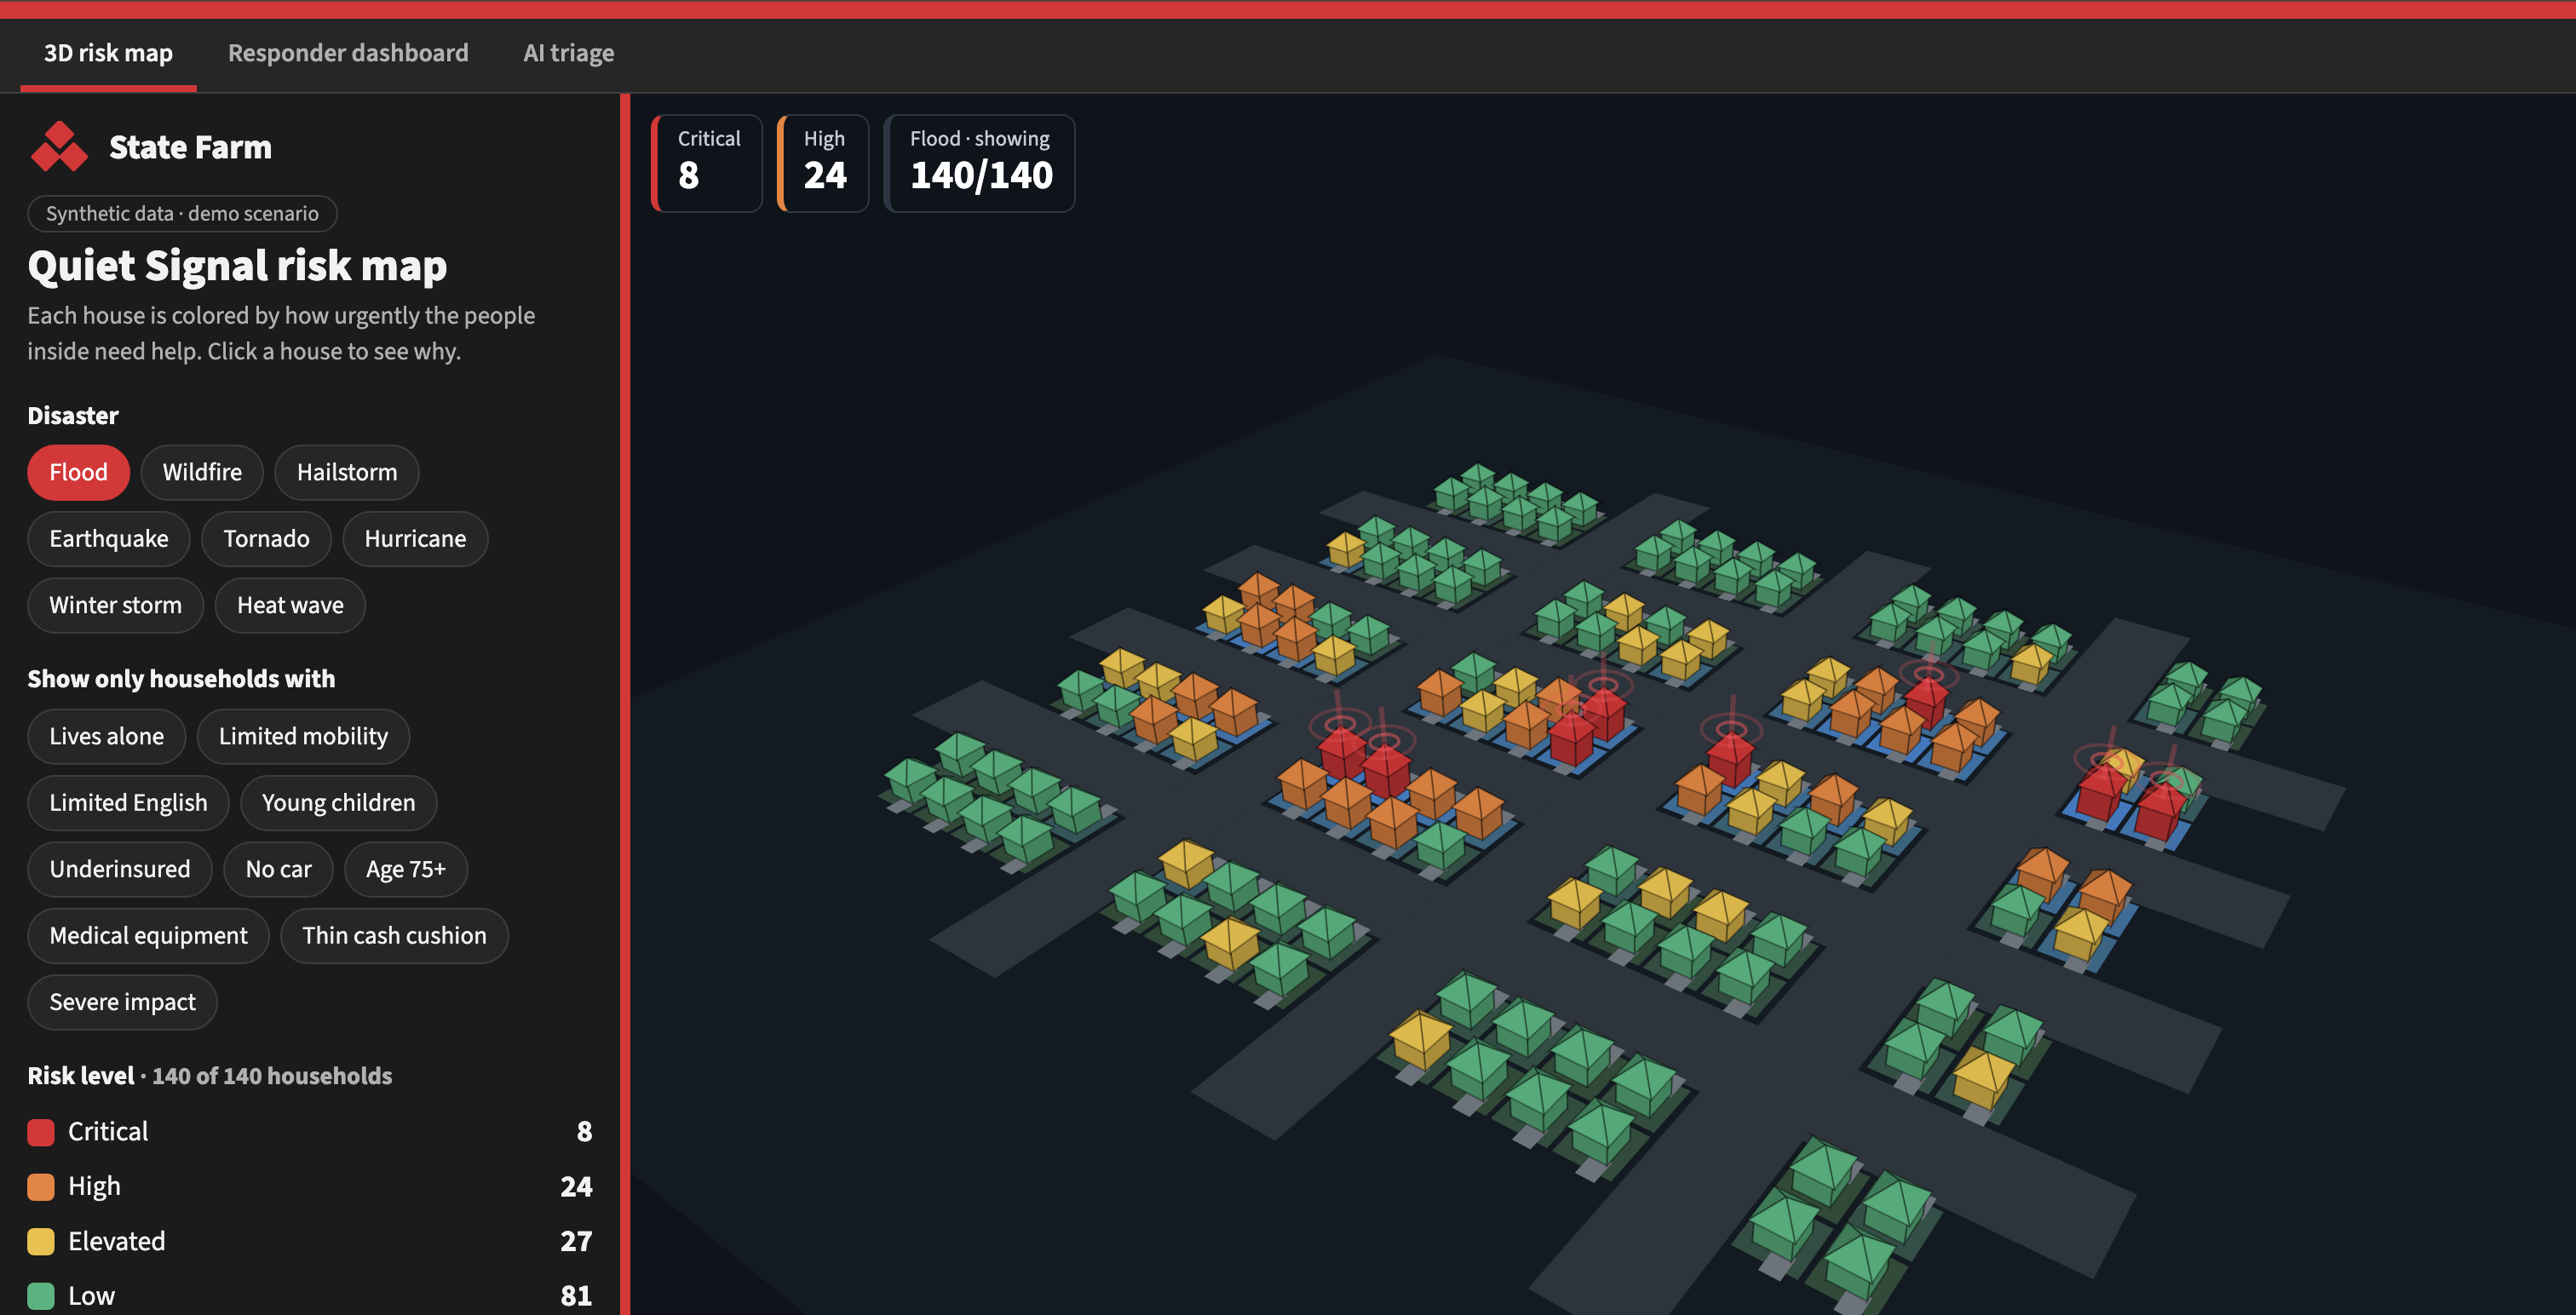
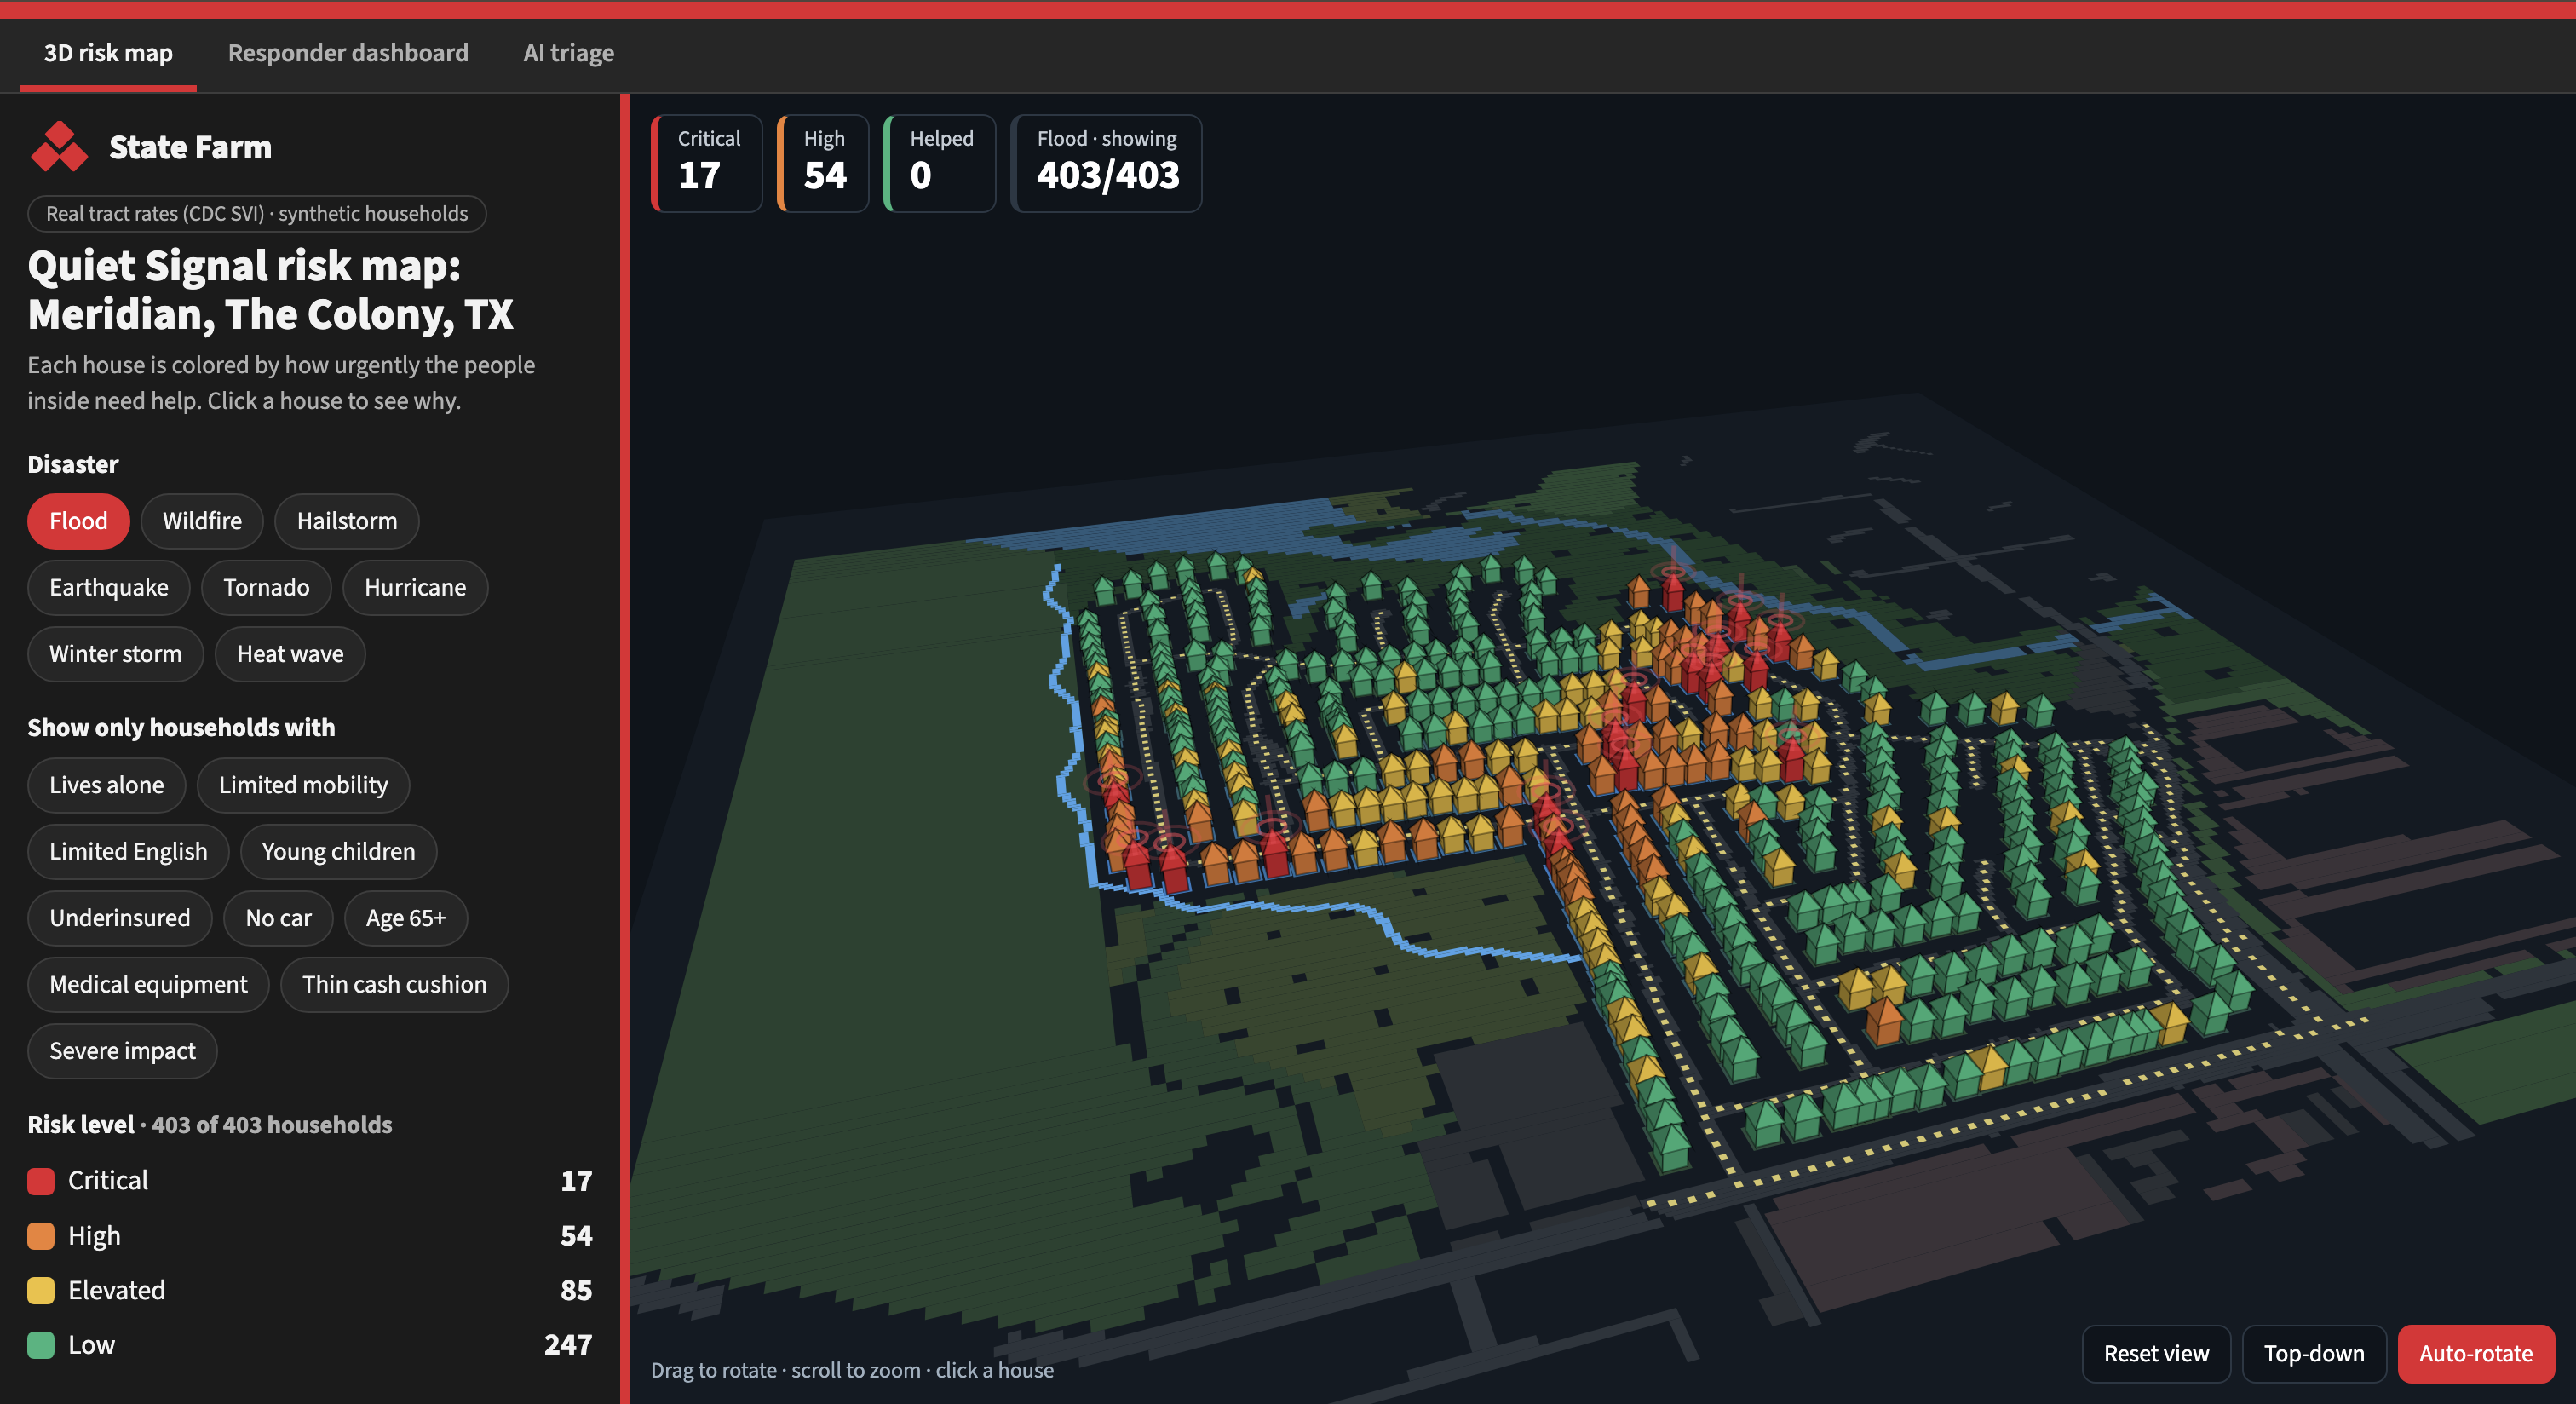
What it does Quiet Signal ranks every household by need, not by who called first. A 3D risk map shows each house colored by risk across 8 disaster types, such as flood, tornado and wildfire. Clicking a house shows why it ranks where it does and lets a responder choose a next step, which lowers that household’s risk level. A responder dashboard tracks who has and hasn’t been reached, and an AI triage tool reads incoming messages and explains its ranking in plain words.
How we built it One HTML file with CSS and JavaScript, and Three.js for the 3D map. It’s hosted on GitHub Pages. A seeded random generator creates 140 synthetic households. Each disaster is a formula that decides how hard each spot was hit. A transparent scoring formula adds points for disaster impact and nine risk factors: age, medical equipment, mobility, no car, thin cash, lives alone, limited English, young children and underinsured. The total sets one of four levels, from Low to Critical. The responder dashboard and AI triage pages are embedded as tabs in the same site. We used Claude to help write and refine the code, and we directed the design, the features and what the demo should show.
Challenges we faced 3D didn’t work in every browser. Some computers can’t run hardware 3D (WebGL), which left a blank map. We added a simplified 3D view built by hand so the demo works anywhere. Too much at once. We tried mixing disasters and varying house models, and it made the map harder to read, so we rolled it back to a cleaner version. Balancing the score. Adding more risk factors pushed too many households to Critical, so we retuned the weights until each disaster had a realistic mix of levels. Making it explainable. We chose a plain formula over machine learning so every score can be explained and audited. No real data. We used synthetic data to protect privacy, which means our results show how the system works, not how it performs on real customers.
What we learned Ranking by need can change outcomes. In our simulation, with the same 6 adjusters, first come, first served helped 22 of the 60 most urgent households by hour 24, and ranking by need helped 59. Trust is part of the design. Risk only changes who is helped first, never coverage or claim decisions, and people make every call. A demo has to survive any laptop, so building fallbacks matters. Simple, explainable rules can be more convincing than a black box.
What’s next Build a real backend with a database and scoring service, add consented data such as outage maps and satellite imagery, link the map to the dashboard, and pilot it with real adjuster capacity.
