-
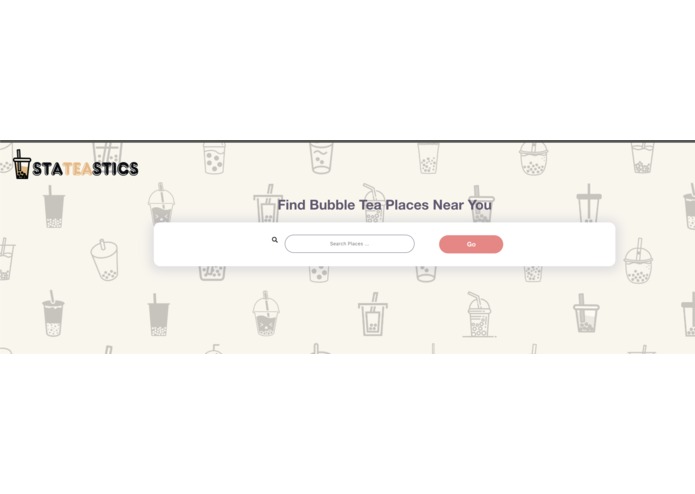
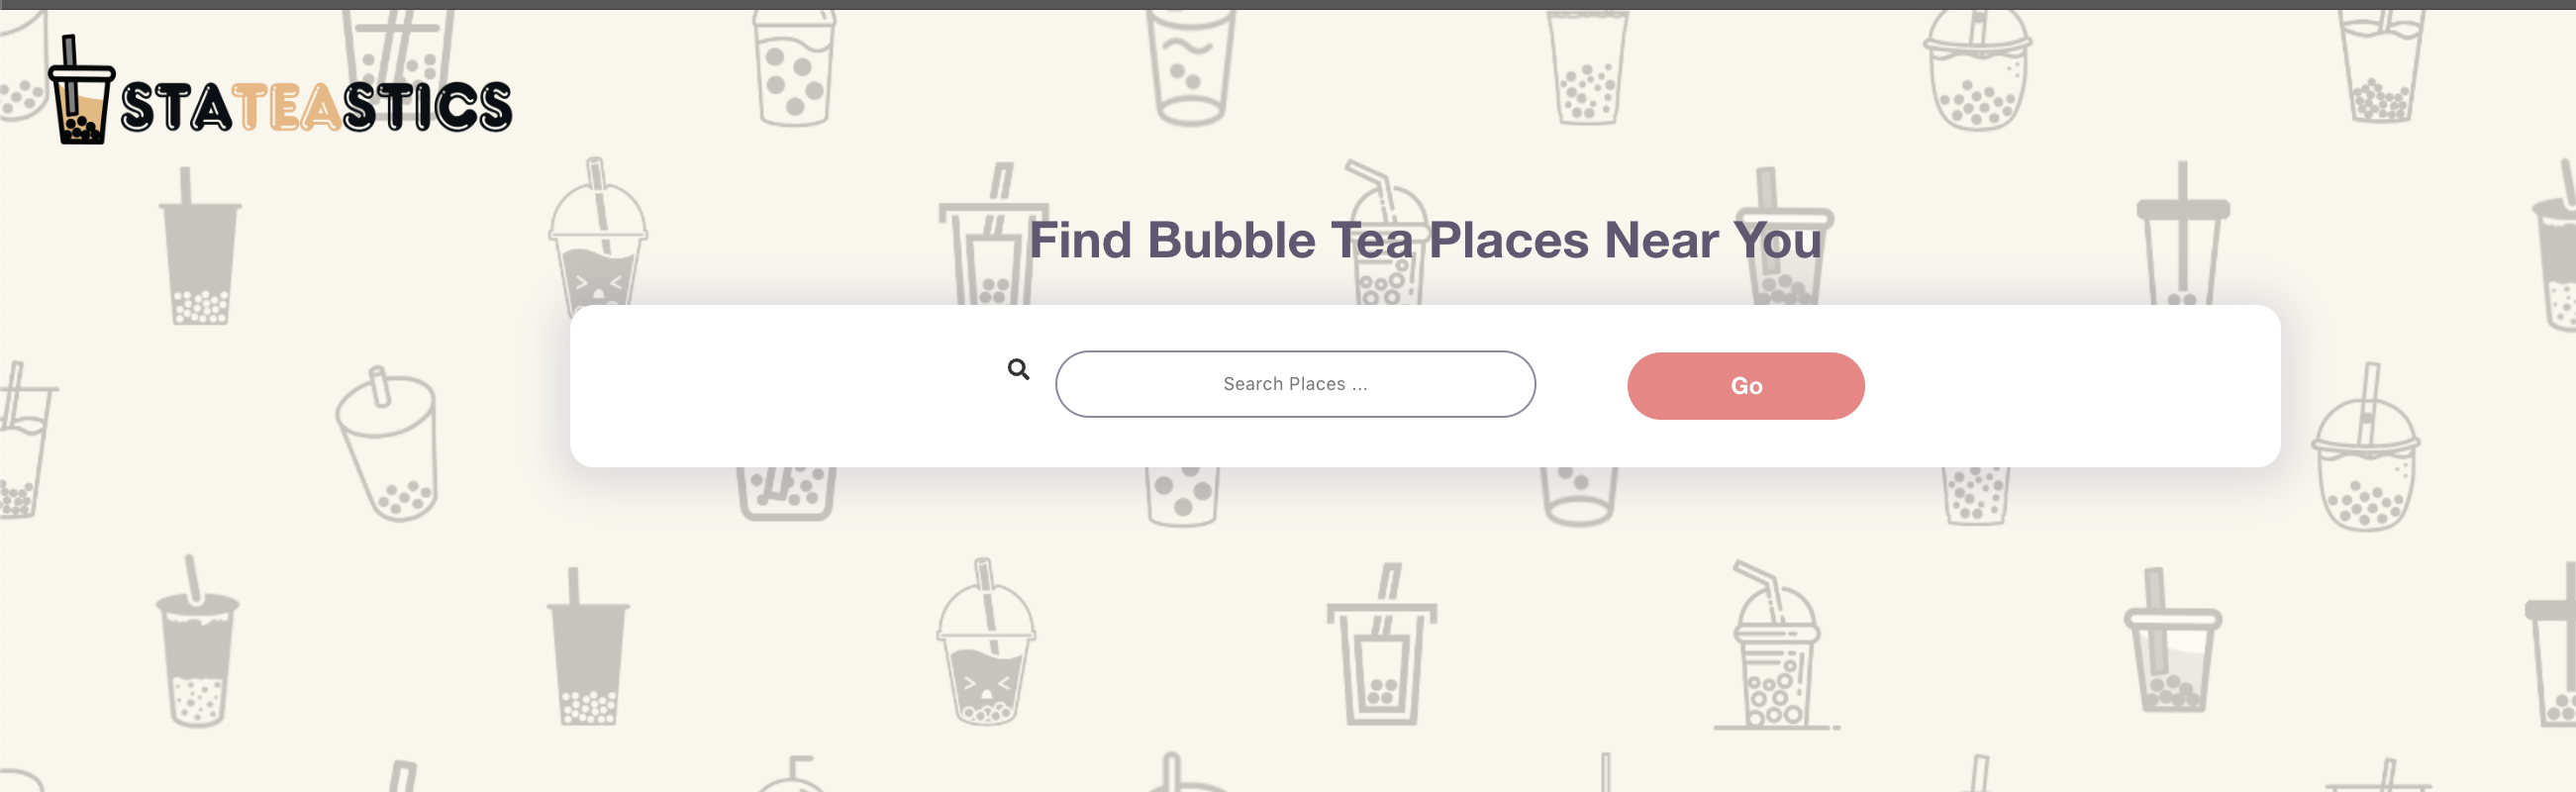
StaTEAstics!
-
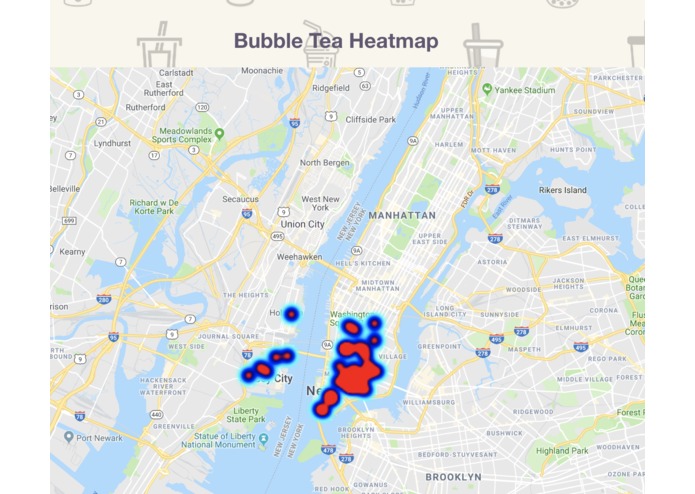
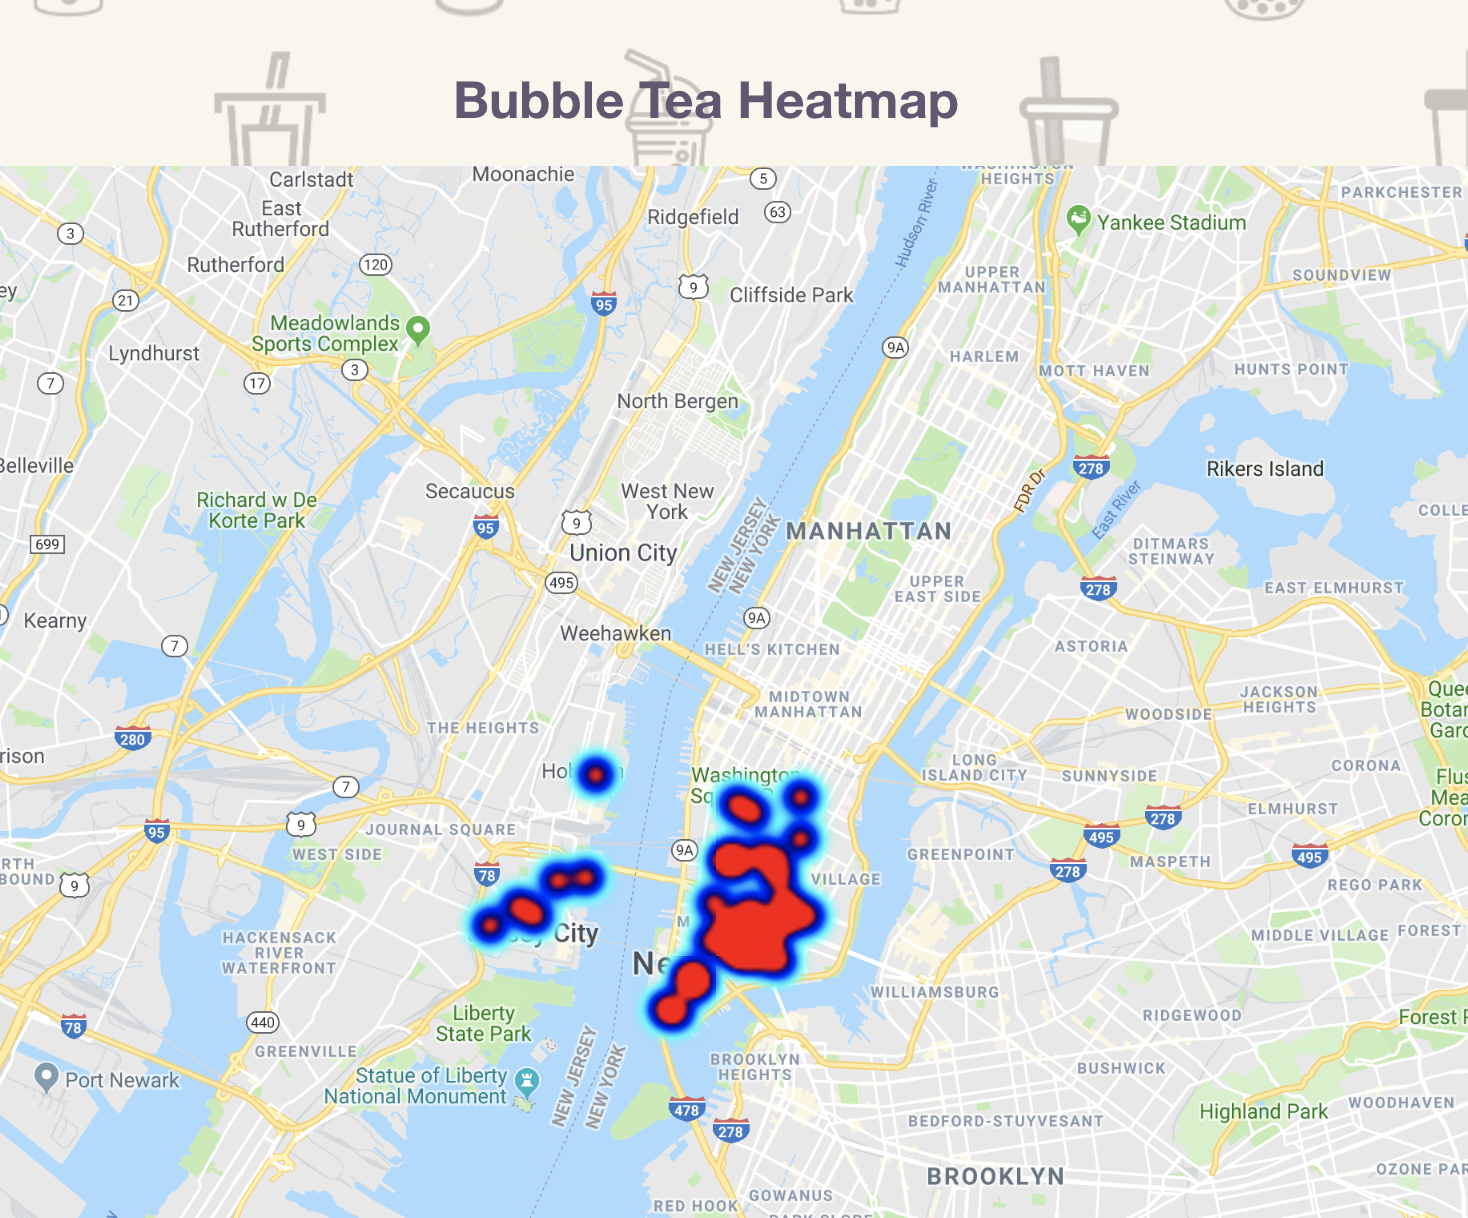
Google Maps heatmap
Domain bought: http://stateastics.space (not hosted on anything)
Inspiration
With the endless amount of bubble tea spots in New York City, our team thought it would be fun to try and map bubble tea places around the city by using data derived from Yelp and visually generating maps based on a given location. We designed this React app for all the boba addicts out there who’ve ever wondered what a heatmap of their favorite bubble tea spots around their neighborhood would look like since data visualization is a visually aesthetic way to explore patterns in datasets.
What it does
Takes coordinate data from google maps, to make yelp requests for reviews and locations for bubble tea restaurants around your specified location. It then aggregates data in a visually appealing way.
How we built it
React, Node, Yelp API, Google Maps API, Gimp, and our best friend- Google
Challenges we ran into
Setting up d3 in react to have animations, and more features
Accomplishments that we're proud of
We were able to make a POC in the short amount of time that we had
What we learned
It’s very difficult to build nice looking maps (especially if you’re looking for that opaque, overlapping effect), how to use Yelp API
What's next for StaTEAstics
Different maps, not just a heat map that presents most popular boba flavors as well a more interactive bubble tea data visualization section with fancy animations. Also have an option for visualizing for larger scopes (entire state, country) (probably accomplished through storing all bubble tea restaurants).

Log in or sign up for Devpost to join the conversation.