-
-

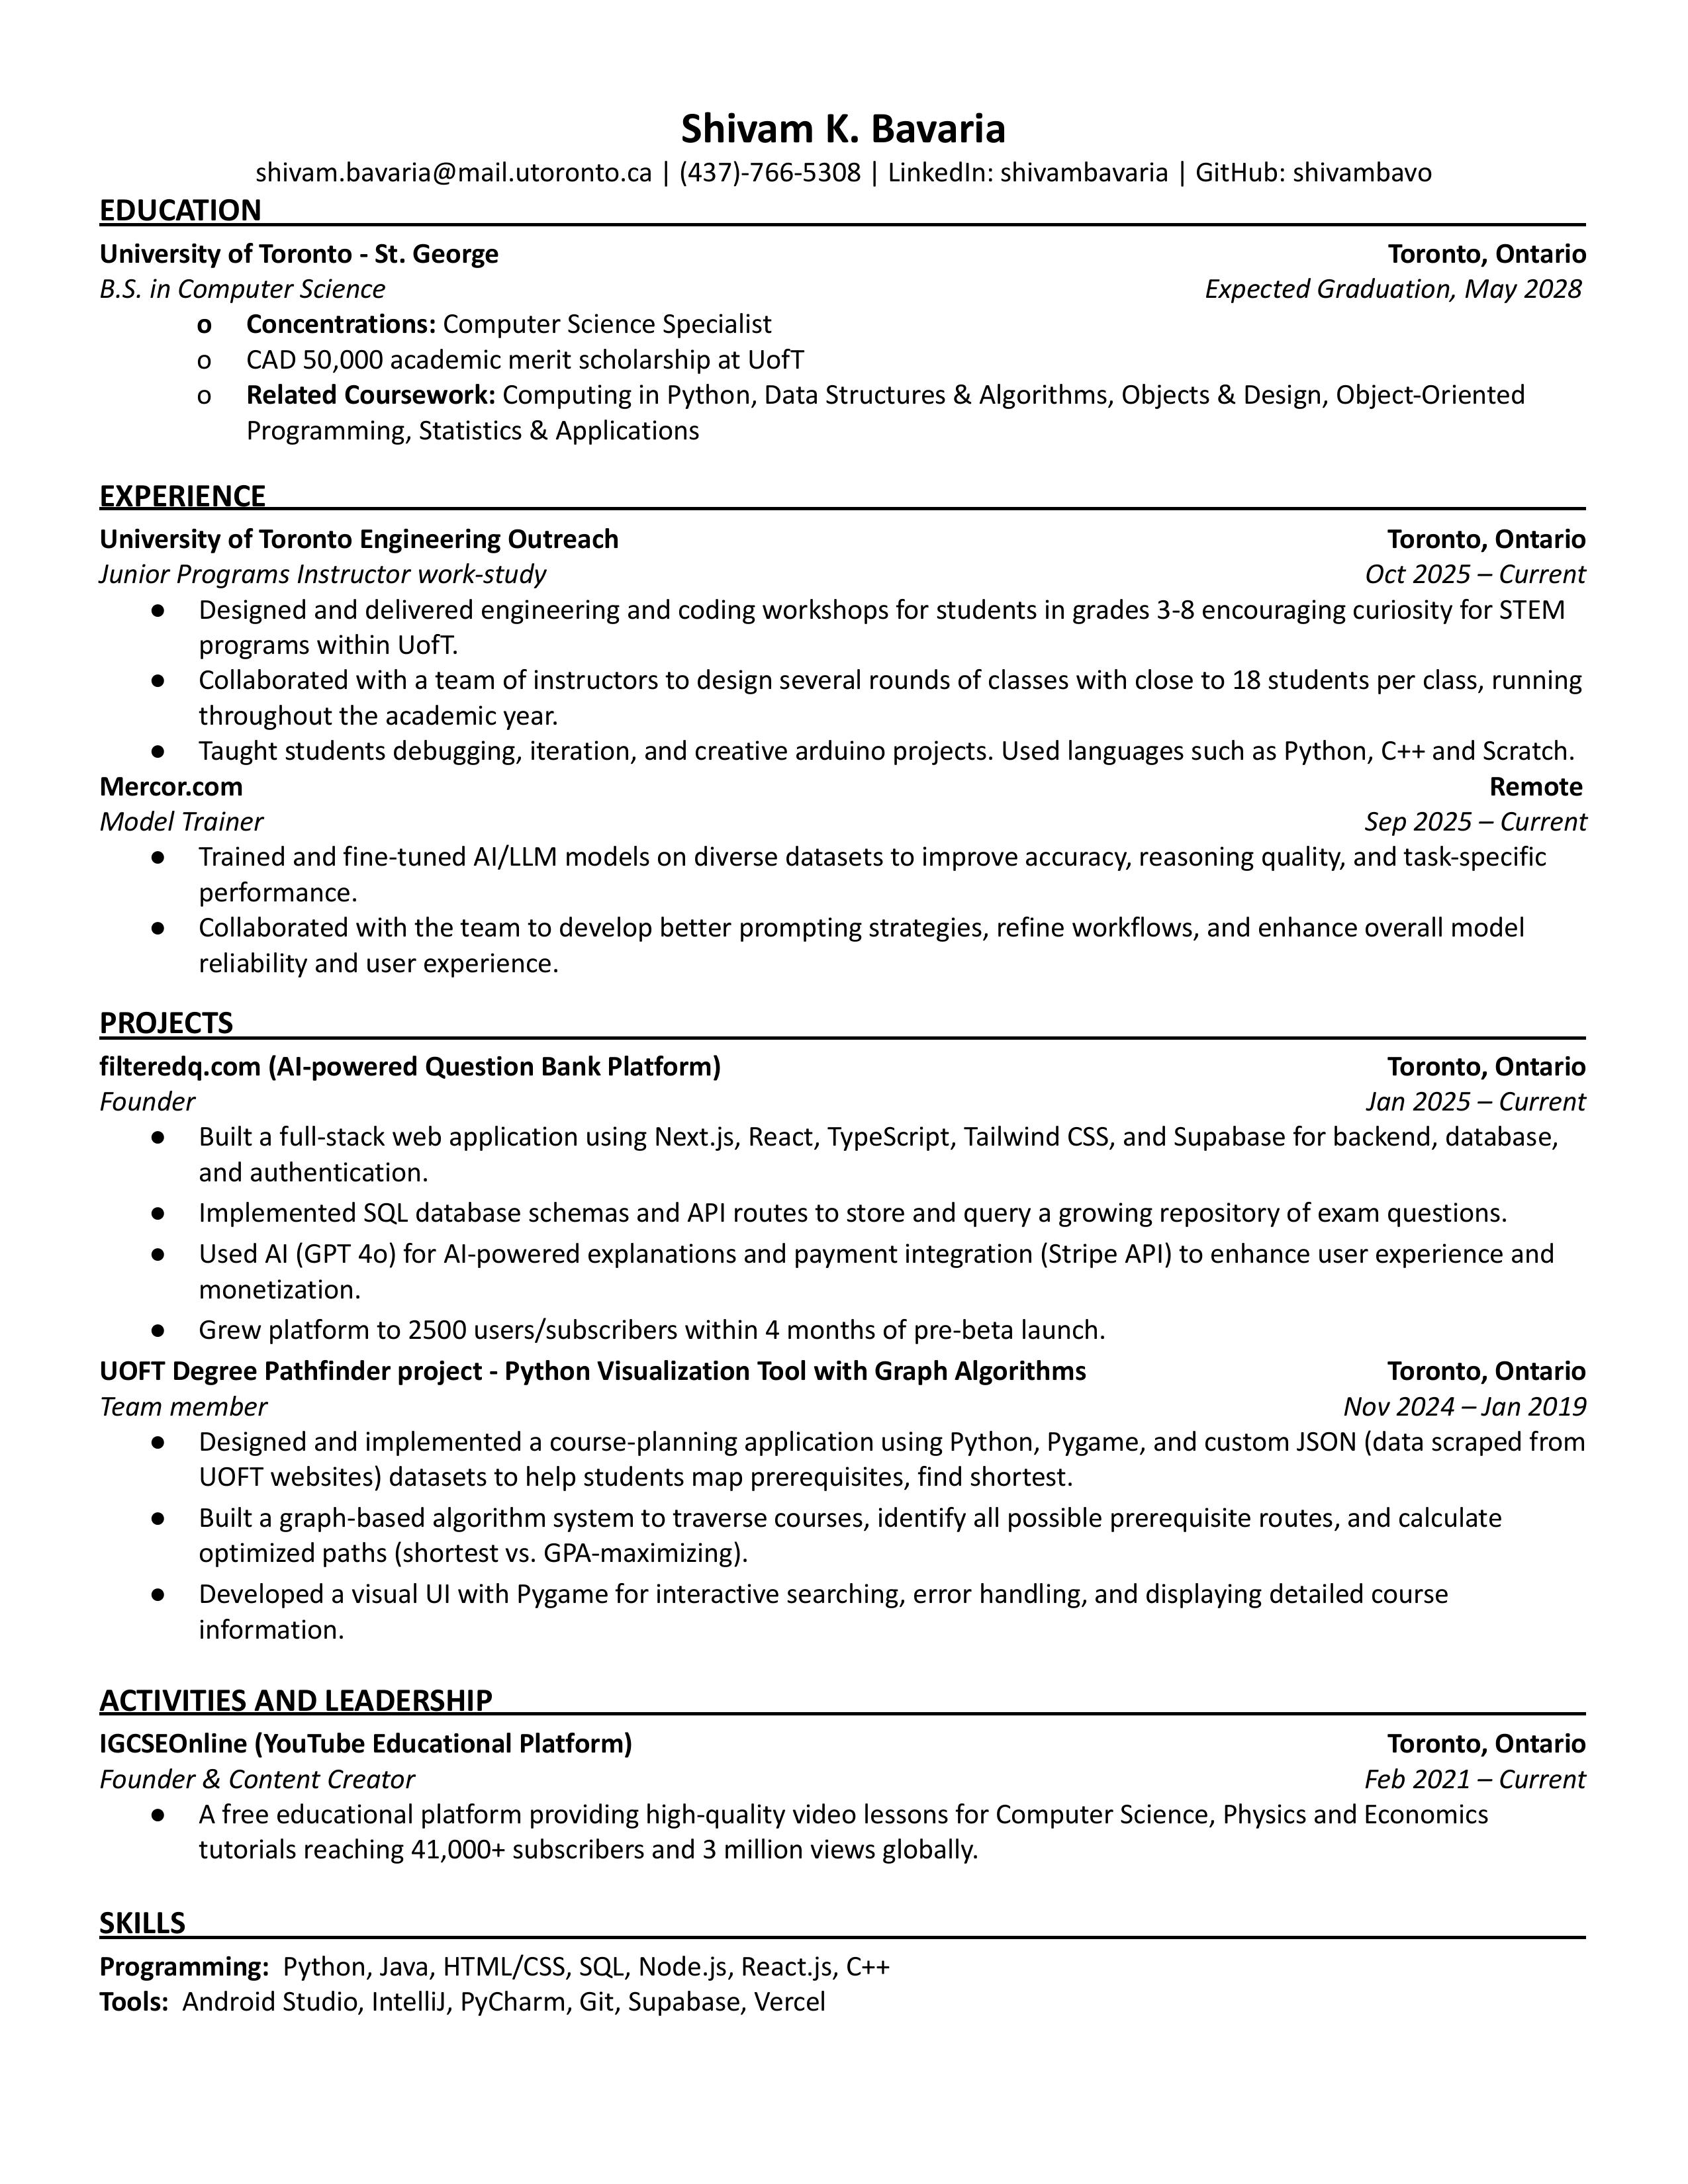
resume (Shivam Bavaria) added as mentioned in criteria
-

resume (Aadi Chauhan) added as mentioned in criteria

Inspiration
The motivation for STAT came from a sobering reality in the Canadian healthcare system: last year, 1.2 million patients walked out of emergency rooms without receiving treatment, and in Ontario alone, 1,300 people died while waiting for a hospital bed. In these high-stress moments, patients often lose their sense of agency, becoming little more than a number in a crowded hallway. We were inspired to build a tool that restores a person's dignity by providing the transparency and data needed to navigate a crisis.
What it does
STAT is a "Time-to-Care" navigator designed to find the fastest path to medical attention. Rather than simply pointing to the nearest hospital, it calculates the total time from a user's current location to an actual doctor’s assessment.
Interactive Map & List Views: Users can visualize hospitals on a Google Maps interface or browse a detailed list to compare facilities.
Real-time Wait & Drive Times: The app provides live wait times and estimated travel times to ensure users make informed decisions.
Hospital Details: Comprehensive information is provided for each facility, including trauma levels and available services.
How we built it
We developed a system that prioritizes human behavior through an "always-on" loop of data, insights, and action.
- Time-to-Care Engine: We modeled the patient journey using the formula , integrating real-time transit data with hospital throughput metrics.
Challenges we ran into
The most significant hurdle was the opacity of hospital data. Wait times are often outdated or difficult to access. We had to develop logic that could handle noisy data and use behavioral signals from the crowd to "correct" official metrics when they failed to update. We also worked hard to ensure our user interface, including the dark theme and responsive design, remained intuitive and accessible during high-stress emergency situations.
Accomplishments that we're proud of
We are particularly proud of our Dynamic Routing Engine. We successfully built a system that doesn't just treat distance as a static number, but as a moving target. By syncing live Google Maps traffic data with hospital throughput, we created a "Virtual Distance" metric that accurately predicts when a hospital 20 kilometers away is actually a safer, faster choice than one right around the corner. Achieving this level of synchronization while maintaining a smooth, 60-fps interactive map experience was a major technical milestone for our team. We also implemented a global search functionality with ⌘K shortcuts, ensuring that even in a state of panic, a user is never more than two keystrokes away from the information they need.
What we learned
This weekend taught us that great technology must prioritize people over processes. We learned how to move beyond simply reporting metrics to using behavioral data to understand a user's true intent. We gained experience in modeling user journeys and using AI to drive visible, helpful changes in a product's experience based on how a user actually interacts with it.
What's next for STAT
We plan to introduce "Vibe Checks," allowing users to share qualitative feedback like parking availability or staff levels to provide a fuller picture of the ER experience. We also hope to integrate with wearable devices to automatically trigger alerts if a user’s vitals indicate their condition is worsening while they wait. Our ultimate goal is to ensure that finding help is the easiest part of a patient's hardest day.
Built With
- html
- javscript
- python
- react
- sql
- typescript
- vite


Log in or sign up for Devpost to join the conversation.