-
-
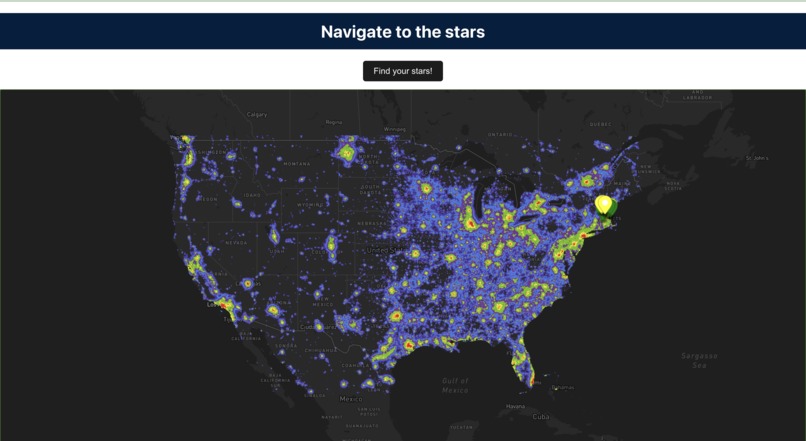
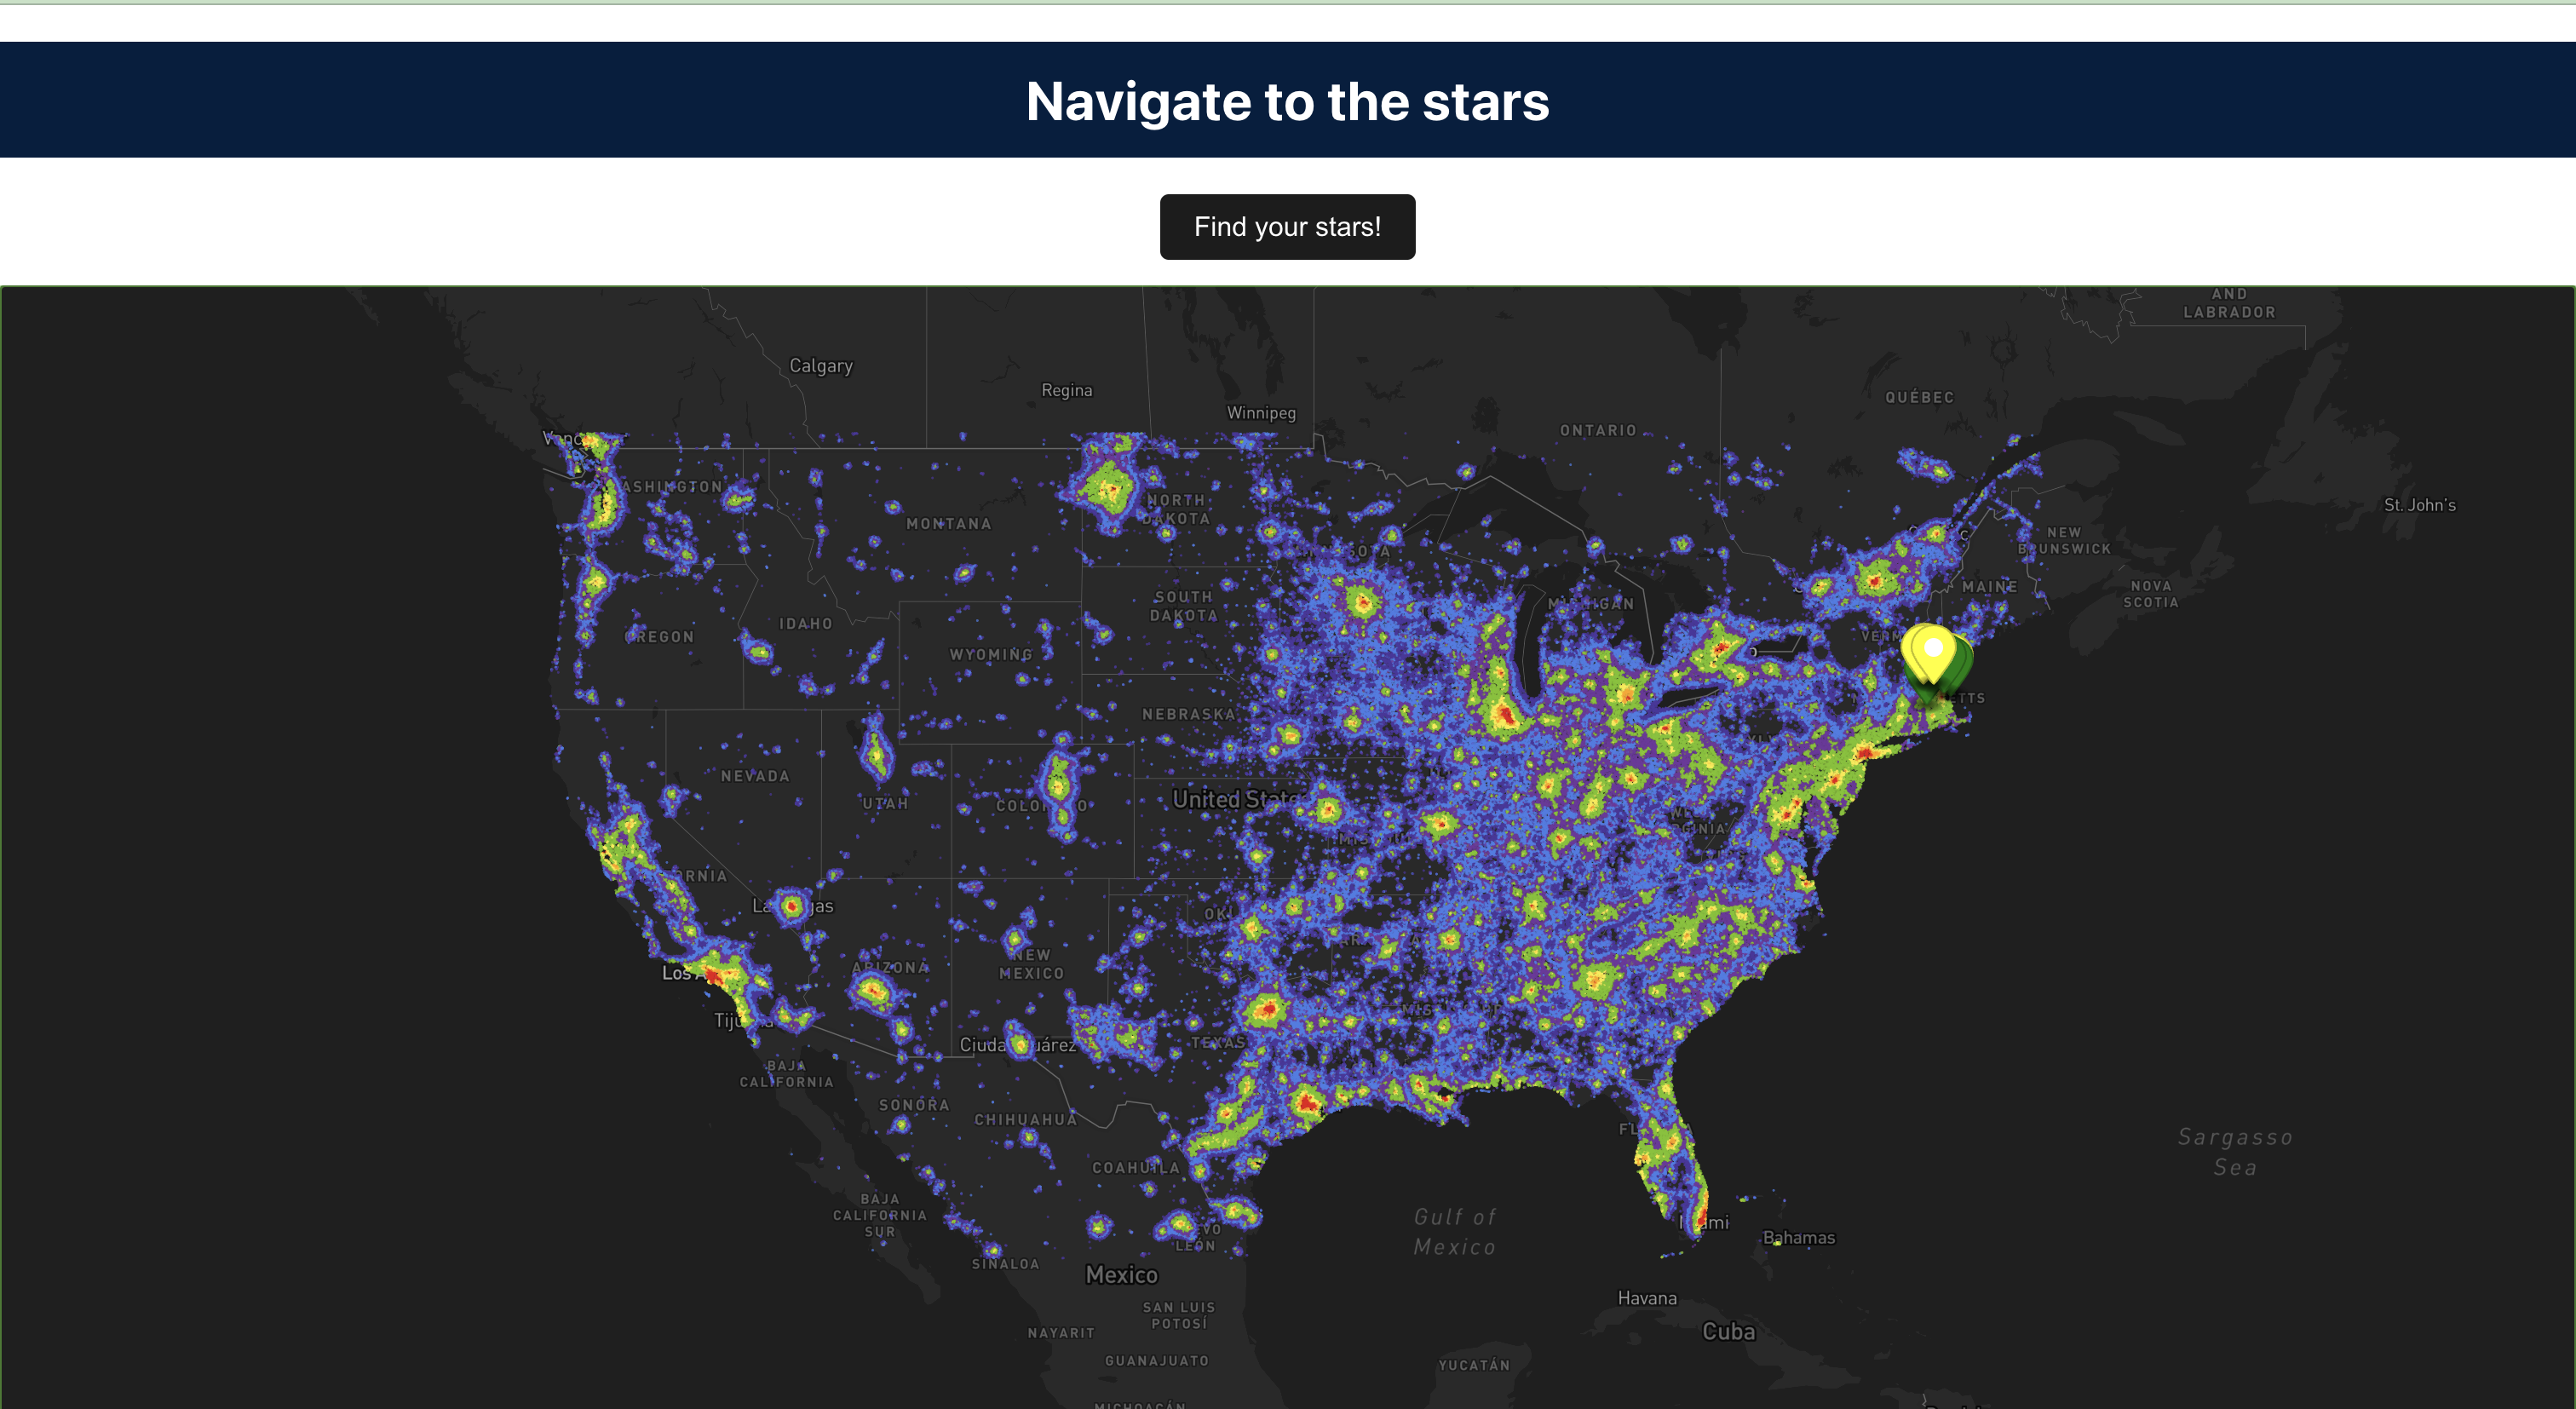
A screenshot of light pollution in the United States
-
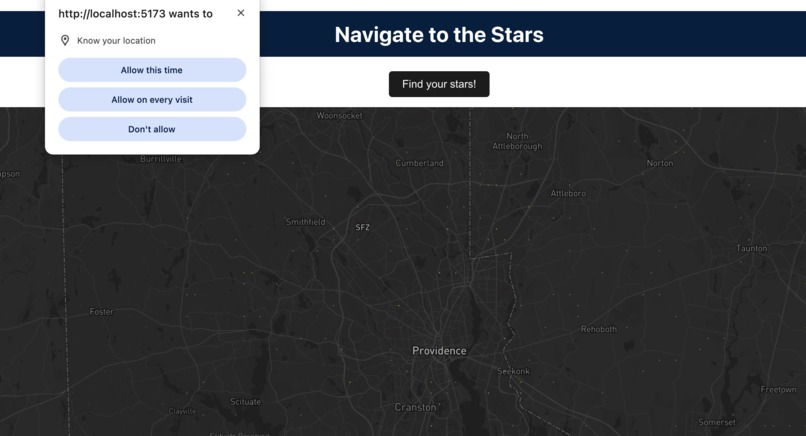
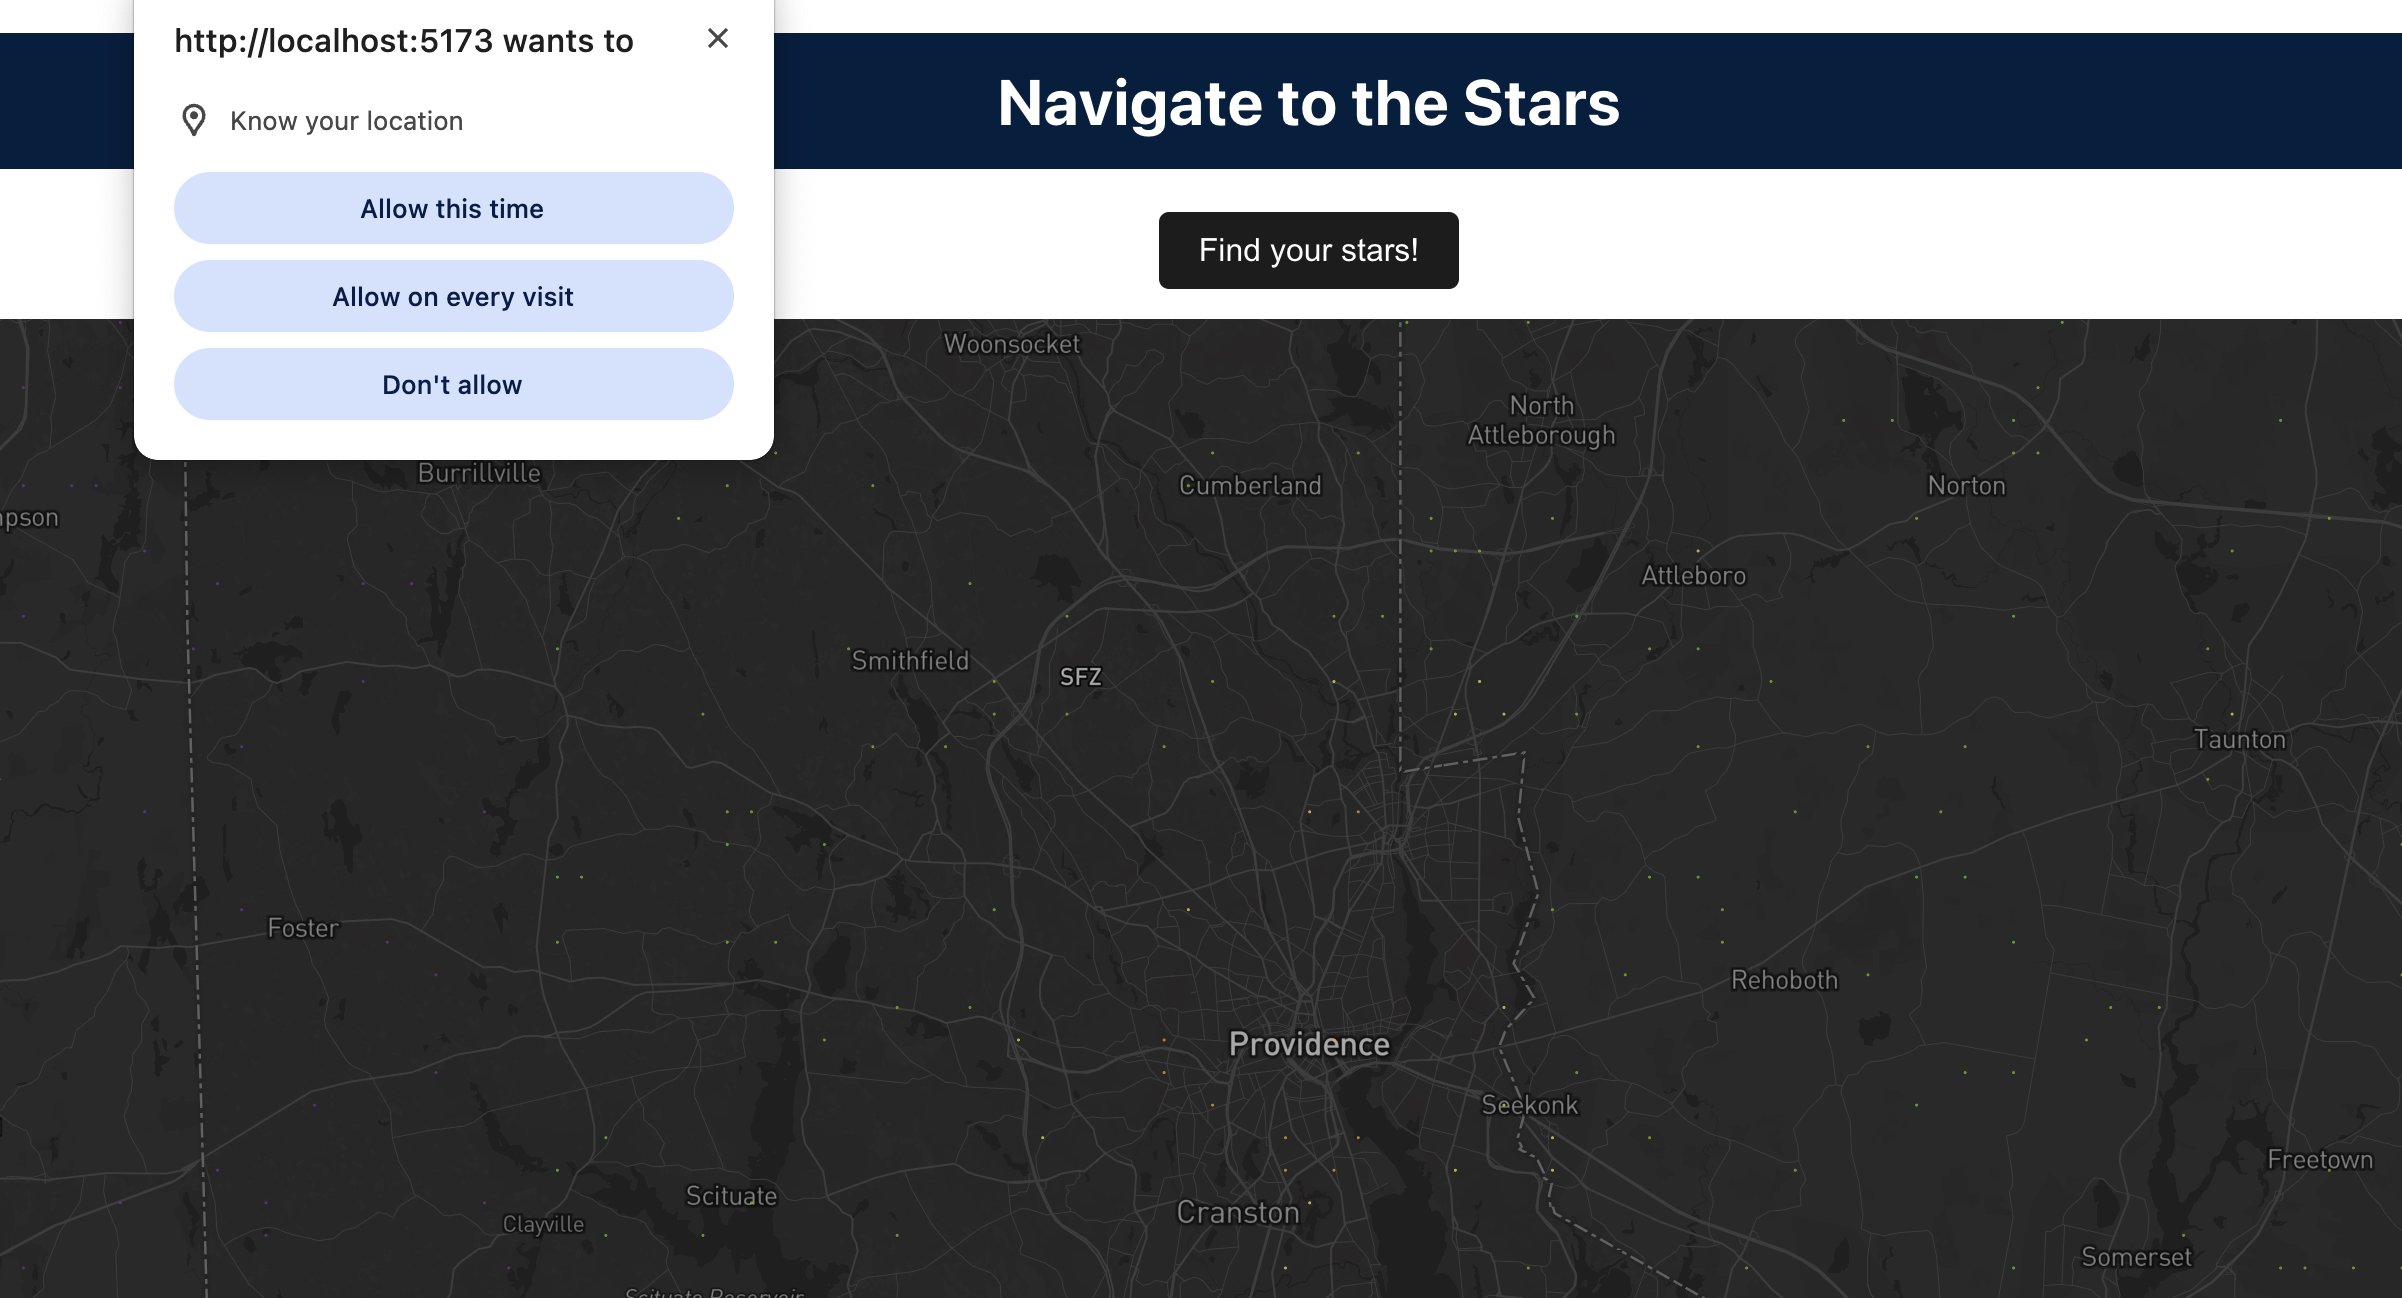
Using user coordinates/location
-
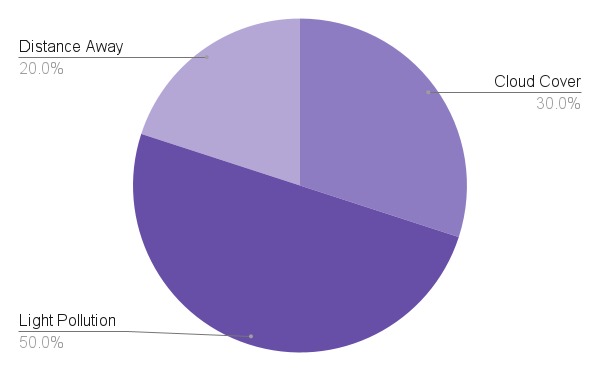
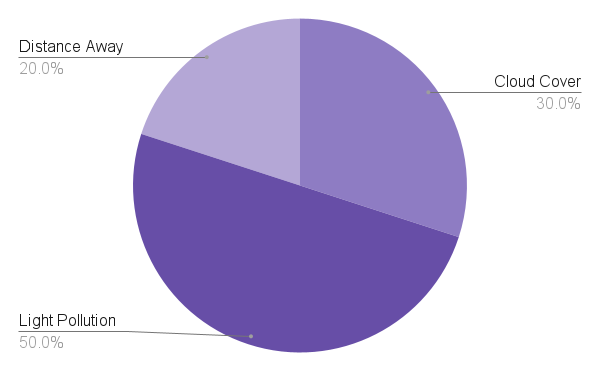
Our custom algorithm for finding you the best stargazing spots!
-
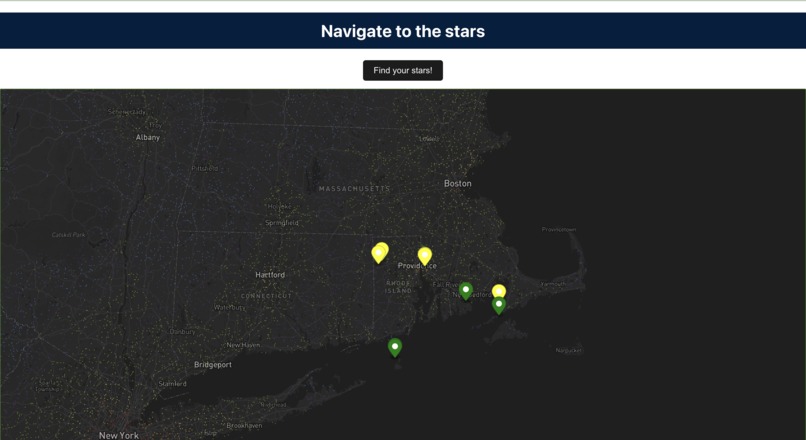
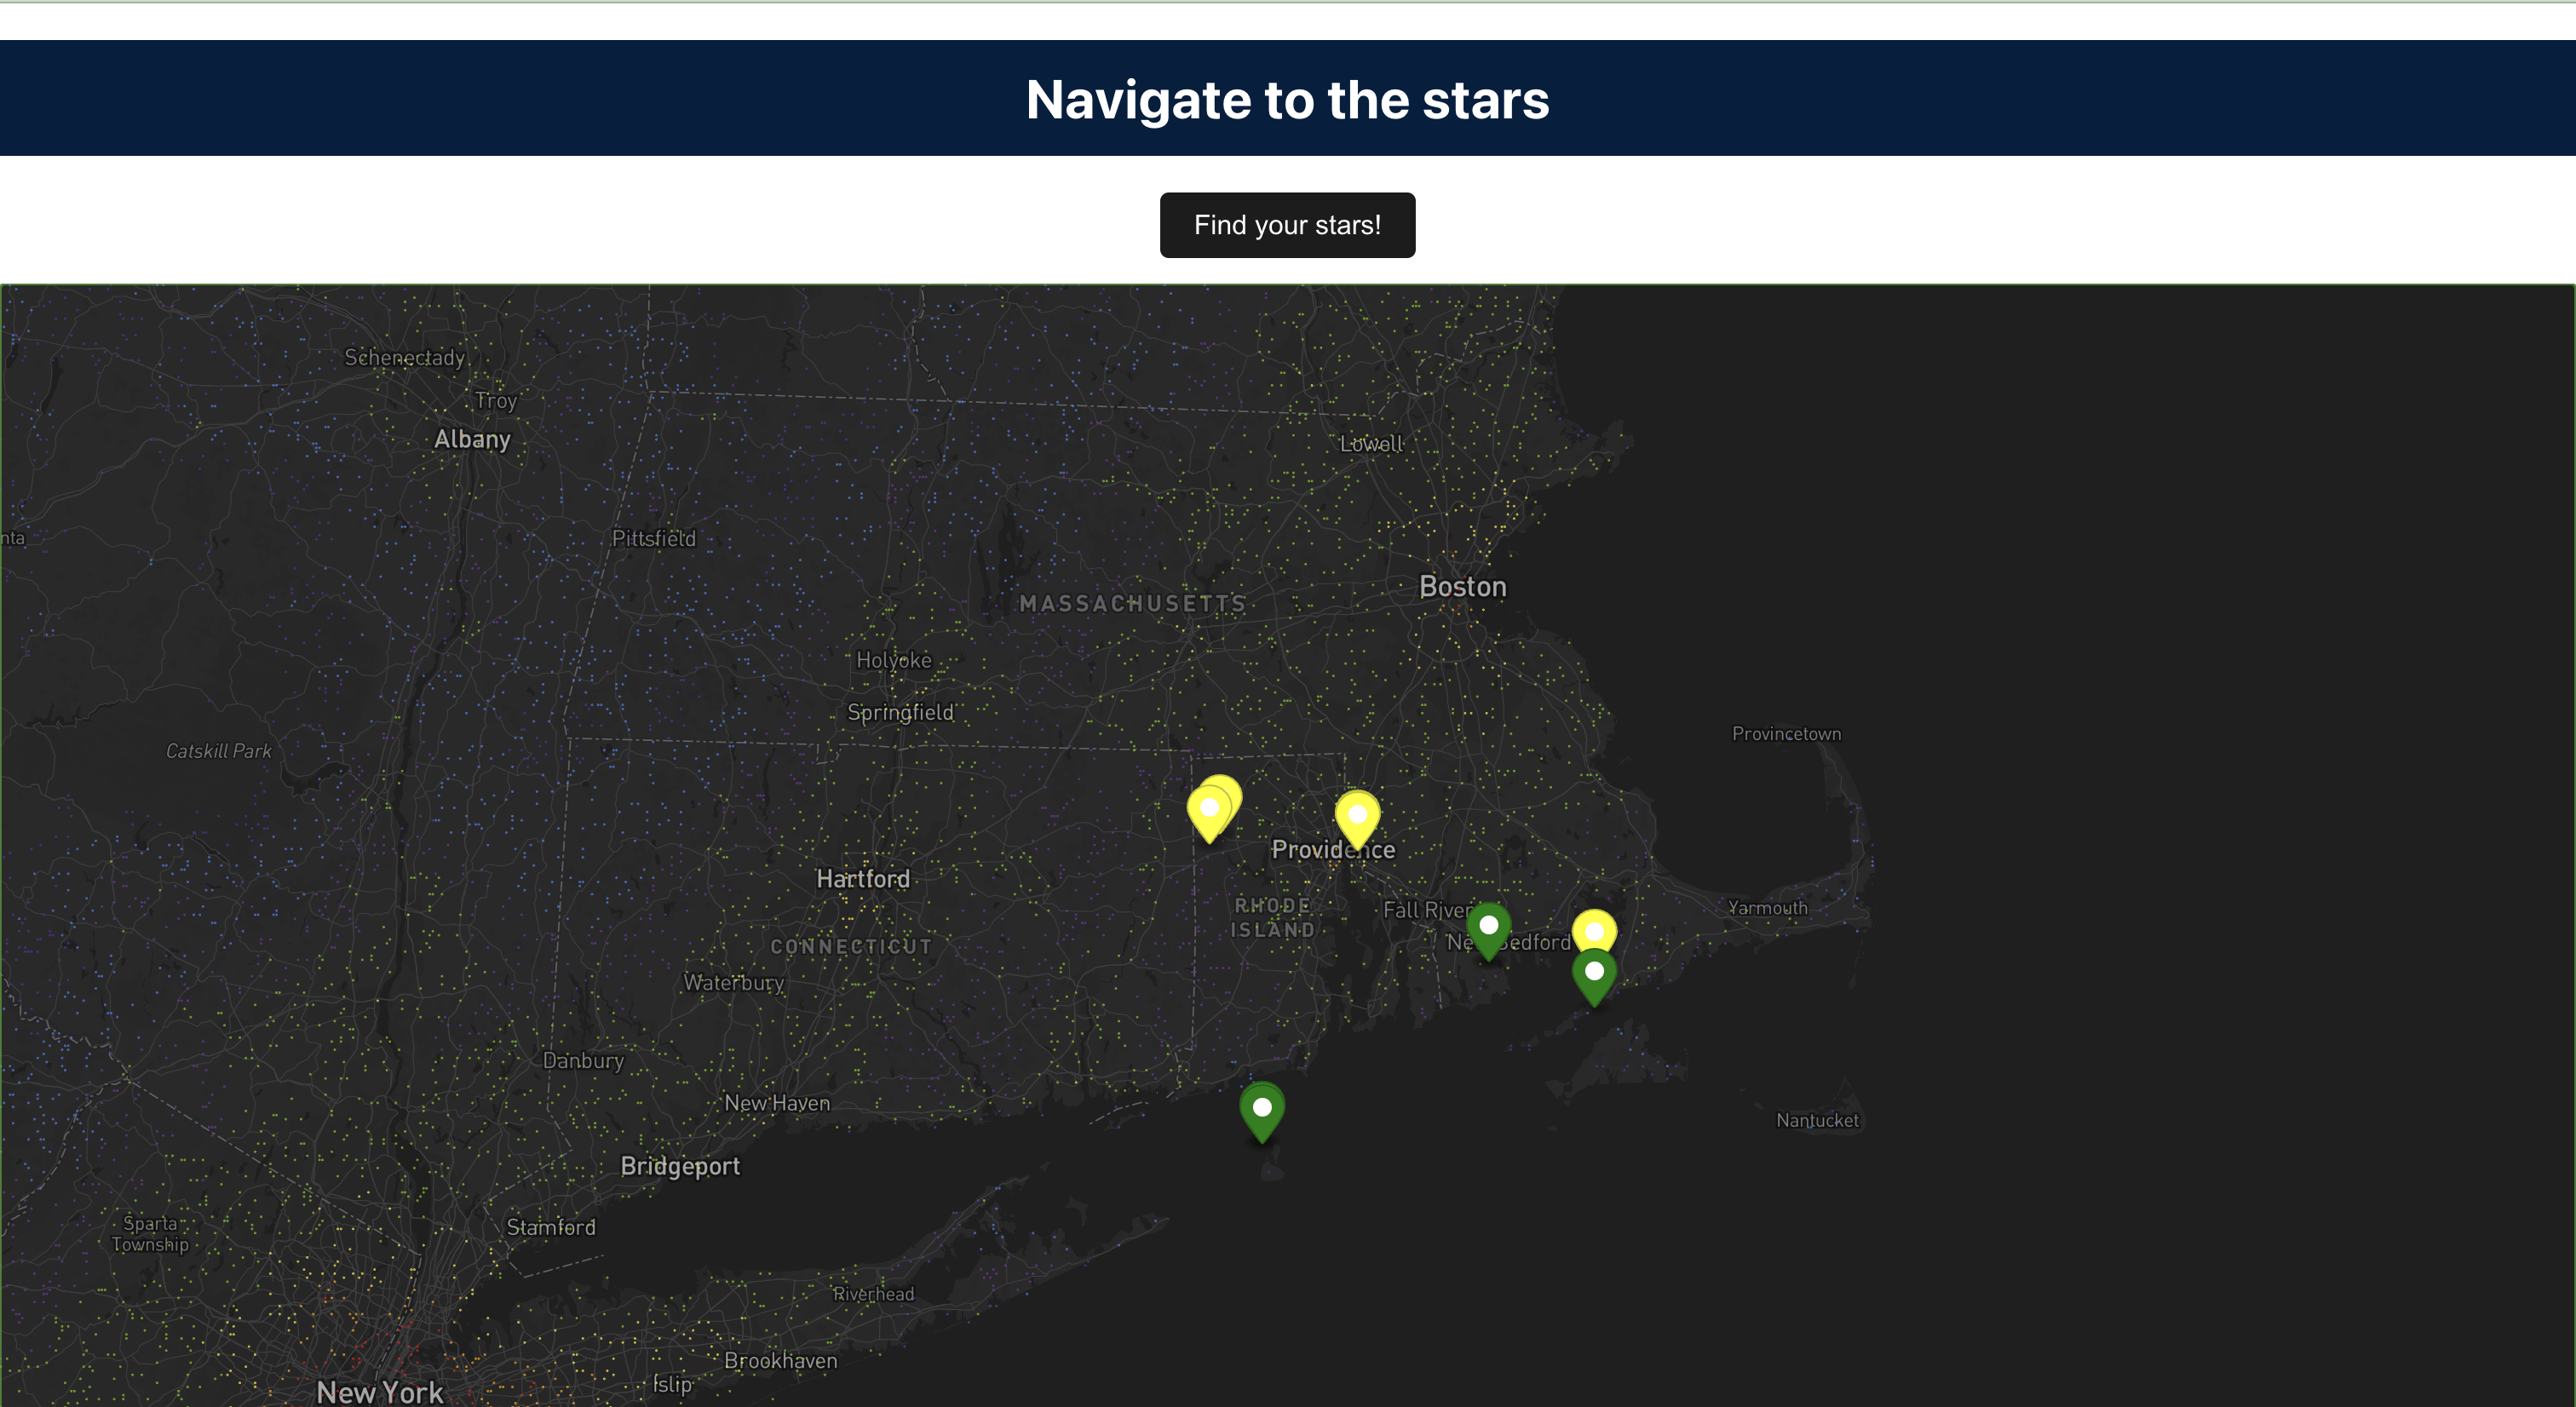
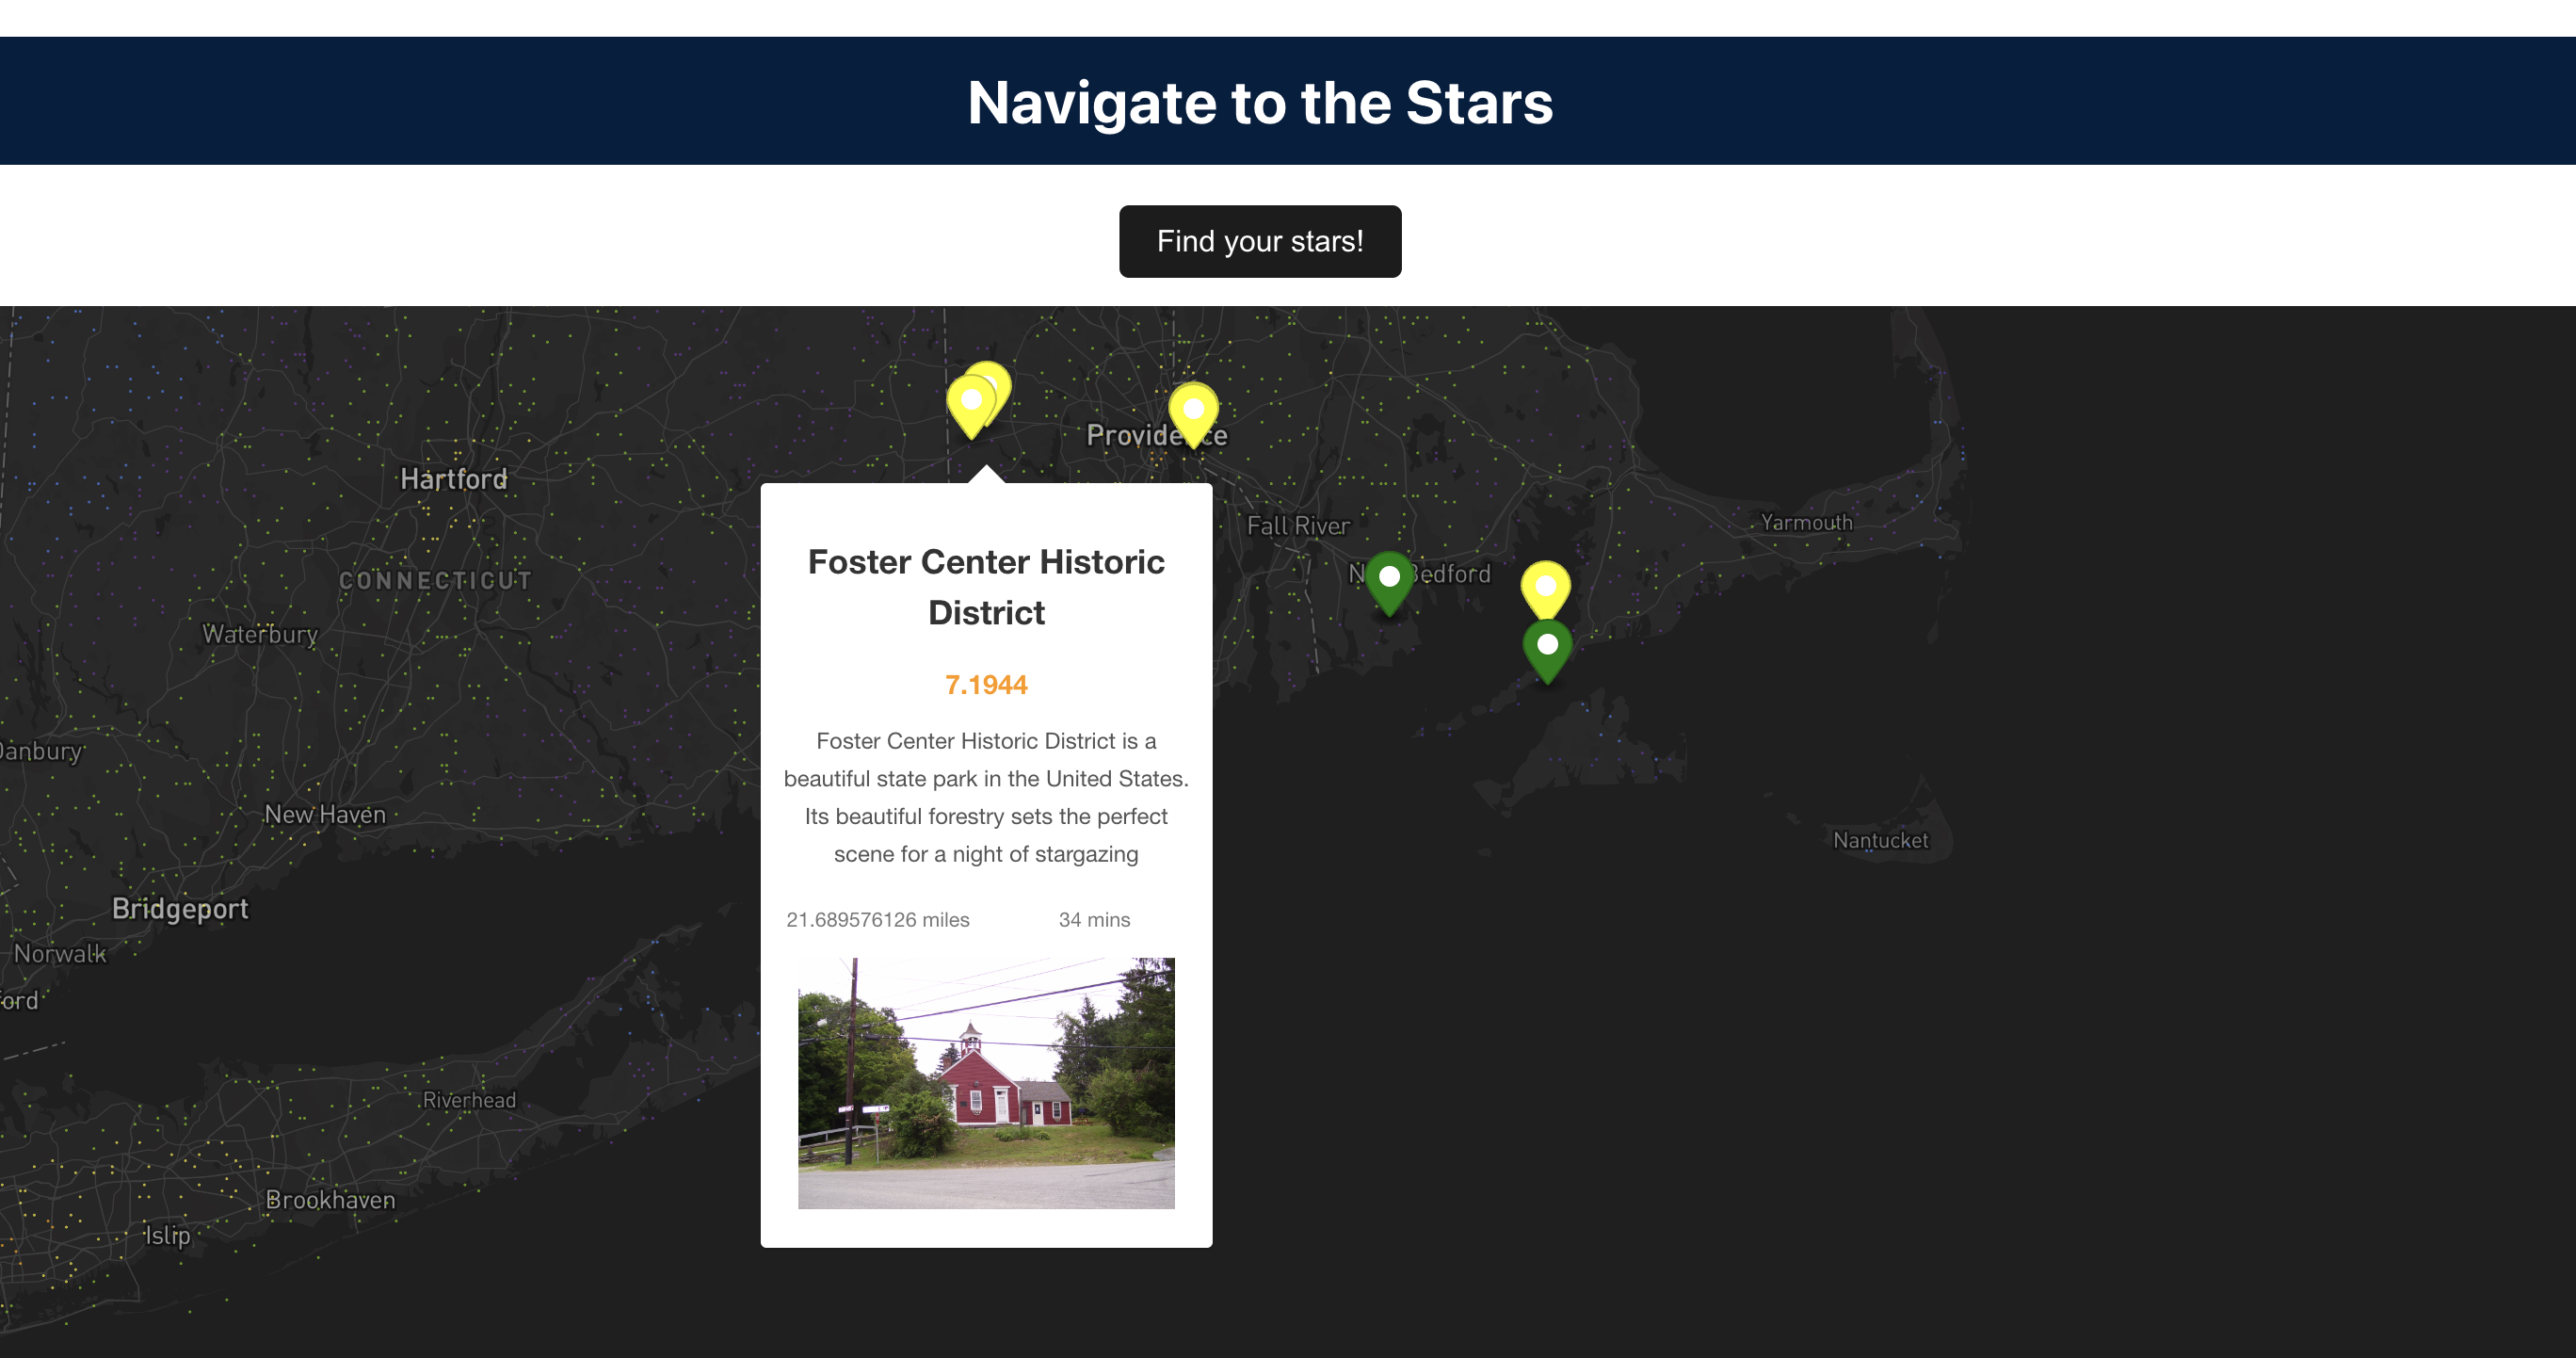
An example search for stargazing locations near Providence
-

An example of one of the many great stargazing parks nearby
We are competing for the following prizes: Best Overall Hack, Best Spacey Hack, Best First-Time Hack
Inspiration
For those of us accustomed to the glow of city lights, the prospect of witnessing the brilliance of the Milky Way (which is visible in a clear rural night sky) can be both captivating and elusive. How often have we dreamed of escaping to a remote location to behold the vastness of the cosmos and feel a closer connection to space–which is becoming more and more prevalent in the mind of popular media and society today–only to be deterred by the daunting and tedious task of discovering an effective stargazing location away from the blinding cacophony of light pollution? While there are light pollution maps out there, their UIs are complex and require users to manually search each coordinate pair to determine how far the nearest dark sky is to them, which deters usage and understanding. StarScout emerged from our collective desire to simplify this journey, to provide a seamless experience for urban dwellers yearning to reconnect with the celestial wonders above, as we wish to do too.
What It Does
ScarScout provides adventurers with the quickest, most direct path to seeing the stars in their complete and unfettered beauty. Beginning with a light pollution map, users can search for a zip code or address, or use their current location, and StarScout searches places nearby to provide them with the easiest path to a low light-pollution park. We’re cognizant that many users do not desire to drive too long of a distance just for a pristine night sky, so StarScout provides multiple options for prospective stargazers so they can still experience as much of the unfiltered night sky as they can depending on their travel desires and limitations. The different levels of light-pollution of a given option are based on the Bortle dark-sky scale, which places each park on a scale from 1 to 8, where 1 is a perfectly clear rural sky, while 8 is an urban sky, with practically no stars in sight.
How We Built It
We began by finding open-source data on light pollution in the United States and the World. We took this data, converted it into latitude/longitude coordinates, and gave every coordinate pair a brightness index based on the Bortle scale. We then removed all points in the ocean and outside North America, randomly selected 1/100 points, and converted the remaining points to a geoJSON file.
We use this data in a variety of important ways, both in the front-end and the back-end. On the front-end, we use mapbox to display an accurate, scrollable map of the United States, which can be rotated in all three dimensions. The data from our JSON file is overlaid onto the mapbox so that it is plotted onto the map in order to represent the light pollution across the country. The color of each data point is determined by its scale, a qualitative measure of light pollution that classifies locations into separate classes based on the darkness of the night sky, which is correlated to its mag/arcsec^2 quantity. The higher the Bortle scale, the hotter the color of the data point, and vice versa.
Beyond the light pollution map lies the travel planner, which advises on the best locations to stargaze and be more connected to the vastness of the universe based on current location. After the back-end receives the coordinates of a location, it scans nearby coordinates for the closest points of each value of the Bortle scale. Next, it uses Google Maps’ API to determine parks close to the list of coordinates found. Finally, information about these parks, including historical cloud cover, distance from the user, and, of course, light-pollution levels are synthesized in a ranking out of ten that gets sent back to the front-end to be displayed!
Challenges We Ran Into
One challenge that we encountered was how difficult it became to collect our geoJSON data. No open-source website had geoJSON data, so we had to decode and convert KMZ data using R so that it became a usable CSV file. The KMZ file we used had around half a billion data points, which made it very difficult to completely run on any of our computers without crashing. To compensate for this, we decided to randomly select one out of every 100 points to get a representative sample of America’s light pollution, while ensuring that our computers could handle the data load. This amount turned out to be more than enough to fill the map with color and provide solid information as to what areas had heavy light pollution as opposed to those who don’t.
Another challenge we encountered was connecting our front-end and back-end. At the start of the integration process, we had a fully functioning front-end and a fully functioning back-end, but we ran into a lot of subtle issues once trying to connect and merge the two, compounded by the fact that each element was coded on a different laptop. After some intense debugging and the development of a solution in hosting our back-end in a virtual environment, we were able to finish up our website!
In addition, we attempted to deploy our website on a standalone server using Vercel, which we were able to do for the front-end successfully. We were also able to connect this with our very own GetTech domain: starscout.tech. However, we encountered issues with integrating the server with flask and core’s permissions on the back-end, causing it to not run successfully and resulting in us sticking with simply submitting our git repo.
Accomplishments That We’re Proud Of
This is all of our first time competing in a hackathon! We’re really proud that we were able to develop a functional site from scratch in just 24 hours, a site that looks attractive, functions successfully, and can have a large impact. Our team combined our unique skills and backgrounds very well–each person had a specific skill set and niche that we exploited to make our website functional, unique, and produced efficiently in a very short amount of time.
We’re also very proud of our work with light pollution data. It was an exciting prospect getting to use a vast data collection that wasn’t heavily utilized by the world, and our use of it greatly used all of our full-stack skills. However, we had no clue how difficult the data would be to work with before we began our project and quickly realized we might have bit off more than we could chew. But through perseverance, ingenuity, and teamwork, we were able to pull it off, converting the large KMZ file–a file type none of us had ever worked with before–into a geoJSON through a complex custom algorithm. This data was used to display a beautiful map of the country colored by light pollution through the front-end, along with useful guidance about nearby stargazing locations through the back-end.
What We Learned
Another benefit of having each team member bring their unique skills to the table was being able to learn from each other! Our project integrated back-end, front-end, and data analysis into one complete project, and after walking through each other’s code or helping here or there with debugging, each of us gained experience in any aspects of full-stack we hadn’t encountered before. And, of course, we learned that there are some great parks for stargazing not that far away from us!
What's Next for StarScout
Ideally, we want to make it a real travel planner! There's a lot more to stargazing than just "finding a park", and oftentimes adventurers find it easiest to camp while gazing. In the future, we'd like StarScout to incorporate campground availability and possibly links to reserve a campsight or lodge to make it as easy as possible for users to go from thinking about the stars to seeing them with their own eyes.


Log in or sign up for Devpost to join the conversation.