-
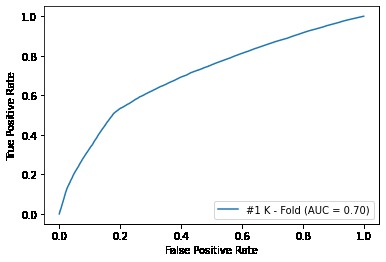
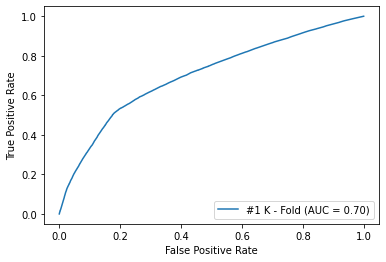
Figure 2: ROC Curves for Random Forest Classifier
-
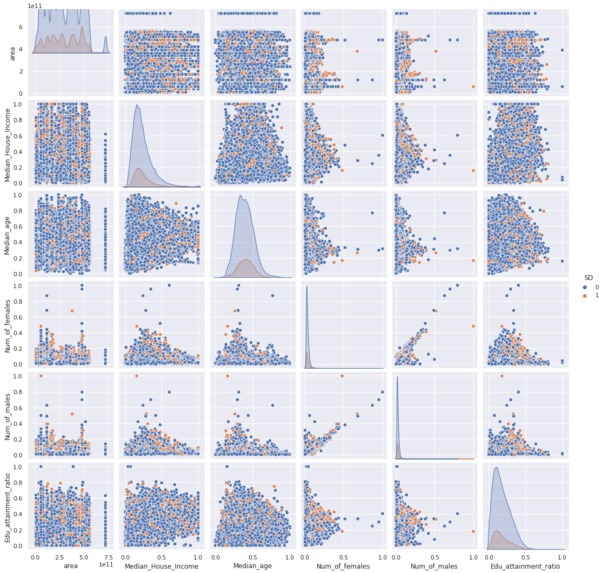
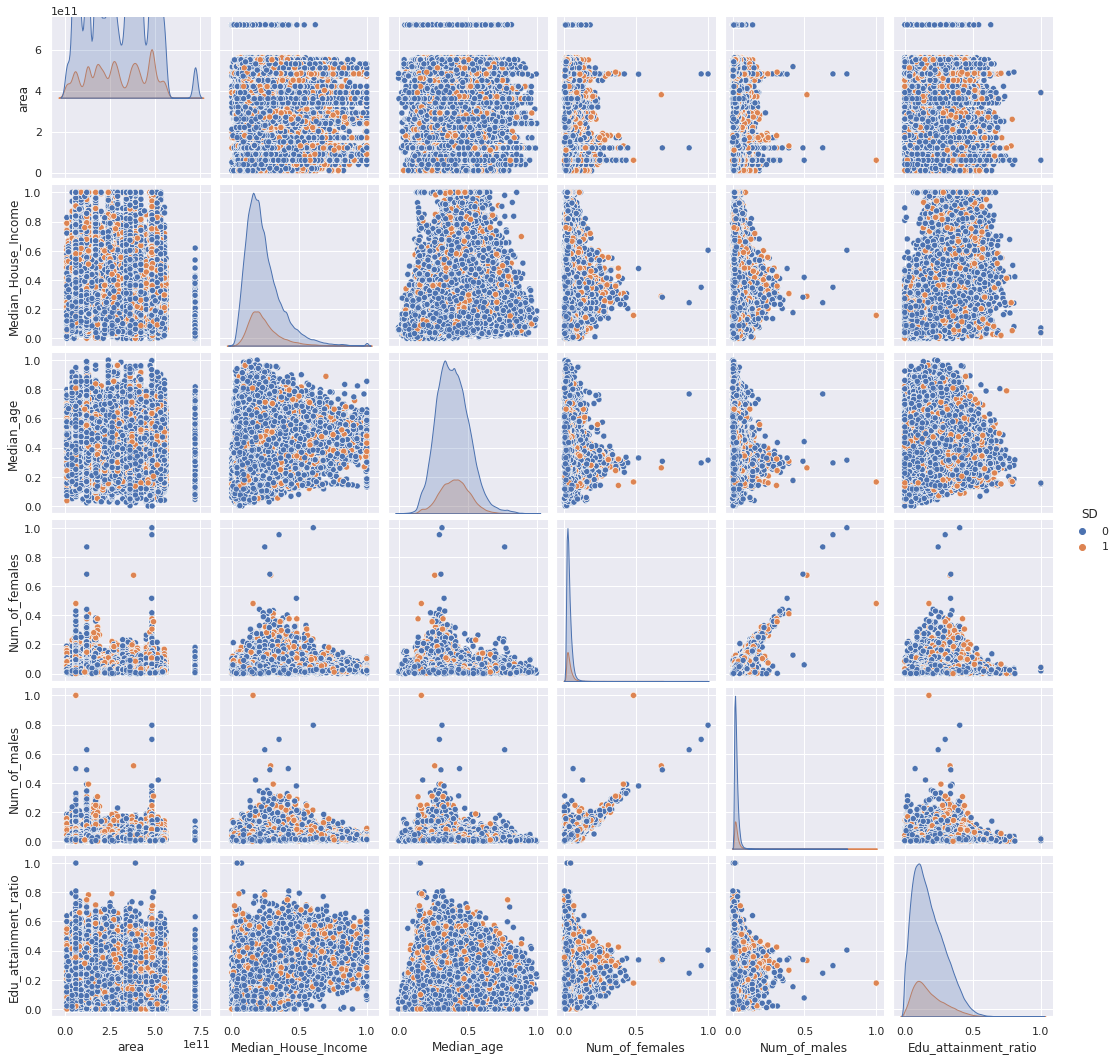
Figure 1: Pairplot of Census Demographic Factors Versus Social Distancing
Abstract
The Covid-19 outbreak is the largest outbreak of the modern century and continues to progress daily. With no immediate vaccine date set insight, data scientists are trying to create models to understand how the virus progresses as a function of a variety of factors. In a similar manner policymakers and government officials are trying to find the balance between precautionary policy and economic harm. At this junction, there is one key factor that if often overlooked and hard to quantify, which is social patterns. In this study, we aim to create a predictive model using census demographic features to how these clusters are social distancing. By using cellphone GPS ping data we can use a combination of average time spent away from home as well average distance away from home to create a metric for how well census groups are social distancing. Using a random forest classifier with 5 K-folds, we were able to successfully predict how well different census block groups are able to social distance based on factors such as: percent of educated (bachelors or above), median household income, percentage of male/female, and age of census groups. Using this random forest we are able to create a classifier with an AUC mean of 0.7. This study demonstrates how big data can be used to identify insightful trends to help policymakers create policies that have a meaningful impact.
Introduction
In efforts to contain the Covid-19 outbreak, governments around the world have enacted various policies such as stay-at home orders and mandated mask orders. The effectiveness of these policies in the United States were questioned when compared to different countries and their ability to control the spread of the virus. [1] Generally, policies are evidence-based meaning that they “use data and evidence to inform policy decisions.” [2] In terms of Covid-19, epidemiologic data can be utilized to understand how a disease is spreading in a community, and it can serve as a way to design effective policies to stop the spread. In an attempt to create successful policies in the future and further understand the epidemiology of covid-19, we sought out to determine the correlation between time spent at home by individuals in the various census block groups across the united states during the month of June and the demographics within that specific census group.
Methods
The datasets used in this study are the OpenCensus Safegraph dataset [3] and the Safegraph Social Distancing Metrics dataset [4]. Information about the datasets, how the data was sampled, and descriptions of the variables are listed on their respective websites. From the OpenCensus dataset, we chose to consider Median Household income, Median Age, Educational Attainment of the population 25 years and over (total), Sex by age (male total population), and sex by age (female: total population). In the Social distancing metrics dataset, we considered mean non_home_dwell time and mean_distance_traveled_from_home as indicators of not following social distance protocols. We merged these datasets based on the census block group creating a sample size of n=656,528.
To create a social distancing metric, we transformed both mean non_home_dwell time and mean_distance_traveled_from_home to a binary format where a 1 represents that the census block group had an above value average for these values while a 0 represented an average or below value. Afterward, the two values were combined into a single representation using a binary and method. This created feature was used as a representation as to whether a census block group performed adequate social distancing action compared to the national average. In a similar matter, the population of Educational Attainment was divided by the total population of its respective block group in order to eliminate bias from sparsely populated block groups. a After this, the data was preprocessed by removing any missing values as well standardizing all demographic data using a standard z-transformation. To visualize the data, we plotted a pair plot of the selected demographics against the newly created social distancing metric.
After preprocessing, the data was then split into K-Folds (n=5). These K-folds were then passed into several classification algorithms such as KNN, Adaboost, decision trees, and random forests. From these it was found that a random forest classifier using n-number of estimators=125, entropy has the gain index had the best results. The accuracy was calculated for each fold and an ROC curve as well to demonstrate the results of the classifier.
Results:
Based on the above figures, the Edu_Attainment_Ratio ( People over 25 years who obtained their bachelors out of the total population in that census group block) seem to have a slight correlation due to the visible distinction between the 0 or 1 social distancing metric. From this it can be inferred that the lower the educational attainment ratio of a corresponds to a lesser likelihood of following social distancing protocols. To observe the interactions between different variables, we plotted a pairplot containing various scatter plots between two variables (Figure 1). We denoted our social distancing metric with the color of the point. The orange points correspond to areas that were less likely to follow social distancing measures.
Figure 1: Pairplot of Census Demographic Factors Versus Social Distancing
Using the random forest algorithm, we obtained an AUC of 0.70 for classifying social distancing measures based on the input features. [insert ROC figure]
Figure 2: ROC Curves for Random Forest Classifier (K-Fold=5)
Discussion: During the time of this challenge, our major problem consisted of making assumptions about the dataset as demographics within the OpenCensus data as we were. Since a correlation between education rates and likelihood to social distance exists, it can be inferred that there is a gap between the policymakers and the understanding of a population of what those laws are supposed to represent. One proposed solution to improve the effectiveness of social distancing is to educate census group blocks with lower educational attainment ratios about the importance of social distancing measures and offer them resources to continue their daily lives within their homes. Additionally, more demographic factors could be implemented into our for future use as more potential patterns could be observed. One limitation of our model is considering the mean non home dwell time and mean distance traveled from home as indicators of not following social distance protocols could misrepresent those who are going to work as not following social distancing protocol. However, we strictly saw those going out regardless of their motive as a risk factor of spreading the virus. In the future, we hope to utilize data that has a more comprehensive view on what social distancing entails to. For example, the part time and full time work behavior devices could be another factor considered in order to fully judge a group’s effectiveness to social distance.
Conclusion
While the importance of social distancing is increasing, social distancing protocols continue to be less effective over time worldwide. Our intention with this study was to use insights from our analysis in order to make recommendations and models for policymakers and other stakeholders which highlights the goal of this competition. We believe that our model upon expansion can turn attention to the needs of certain groups and how to effectively address a group’s concern.
References
[1] Robbins, R., Garde, D. and Feurstein, A., 2020. What The U.S. Did Wrong On Covid-19 — And What Others Did Right. [online] STAT. Available at: https://www.statnews.com/2020/09/18/an-experts-take-on-what-the-u-s-u-k-did-wrong-in-covid-19-communications-and-what-others-did-right/ [Accessed 25 October 2020]. [2] Stuart, E., 2020. Evaluating The Effectiveness Of COVID-19 Policies: A Q&A With Dr. Elizabeth Stuart - Johns Hopkins Coronavirus Resource Center. [online] Johns Hopkins Coronavirus Resource Center. Available at: https://coronavirus.jhu.edu/from-our-experts/evaluating-the-effectiveness-of-covid-19-policies-a-q-and-a-with-dr-elizabeth-stuart [Accessed 25 October 2020]. [3] https://docs.safegraph.com/docs/open-census-data?utm_source=data_download&utm_medium=email&utm_campaign=product_hunt_launch&mkt_tok=eyJpIjoiTmpJM016QXhNamN4TldZdyIsInQiOiI2OW1ydEtmR0RFZVZoc0dmUWdndDREcTRSWjU3VVdrcmVhbkN2aDhteTB6YmRFME9ma3k3Ums5RGdLaEdlTHIrckZGY2RxV0dFSDdSeEUzRDEwZDF4NEoyWjJWZXk1ZWRtZVZDQ3RKZ01CXC9kXC9QeXprZFwvMnpIZVlNNkRPYmFcL1IifQ%3D%3D [4] https://docs.safegraph.com/docs/social-distancing-metrics

Log in or sign up for Devpost to join the conversation.