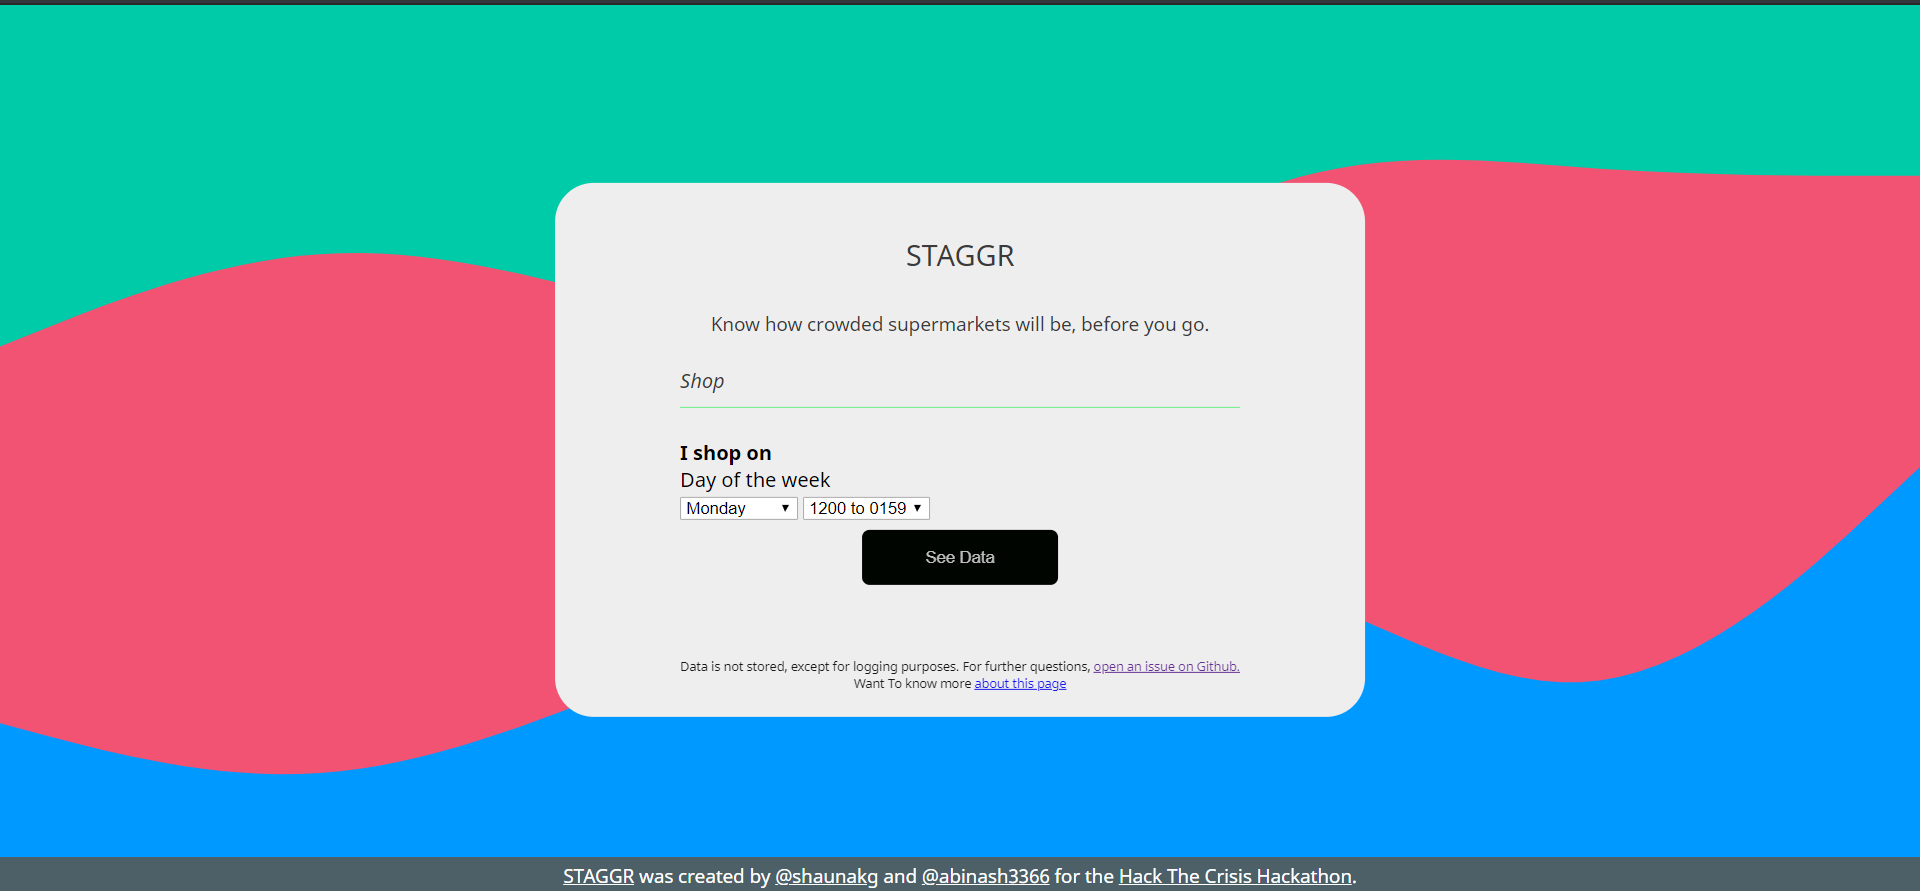
What it does
Gets users' data and displays it in a graphical format.
How we built it
We used NodeJs, chartify and CSS to design the project.
Challenges we ran into
We were going to use a sqlite3 database but it would be too big.
Accomplishments that we're proud of
This entire project
What we learned
We learned advanced nodejs programming
What's next for STAGGR
Better features.

Log in or sign up for Devpost to join the conversation.