Inspiration
During the COVID-19 Pandemic, many of our families were left wondering what areas are safe and more prone to risk to the spread of the virus. Public health data was often mess and no one knew what areas were safe outside of there own home. Thats when my teammates and I came with our idea for HealthScope. A new way to see and visualize health data from across the United States and on dozens of different factors so that no family has to ever be left wondering if the place they live in or visit are safe and healthy.
What it does
HealthScope is a geospatial data visualization platform for Public Health Data. HealthScope takes hundreds of thousands of rows health data from the past 8-years and seamlessly combines it into one all-access comprehensive website. Users can see a detailed assessment of various metropolitan areas health risk and trends over the past couple of years. Additionally, users can get a glimpse into the future with advanced machine learning to see how communities and areas might progress or degress in terms of health in the next 5 years.
How we built it
HealthScope leveraged a wide variety of the latest technologies to provide a powerful data visualization tool and create a engaging user experience.
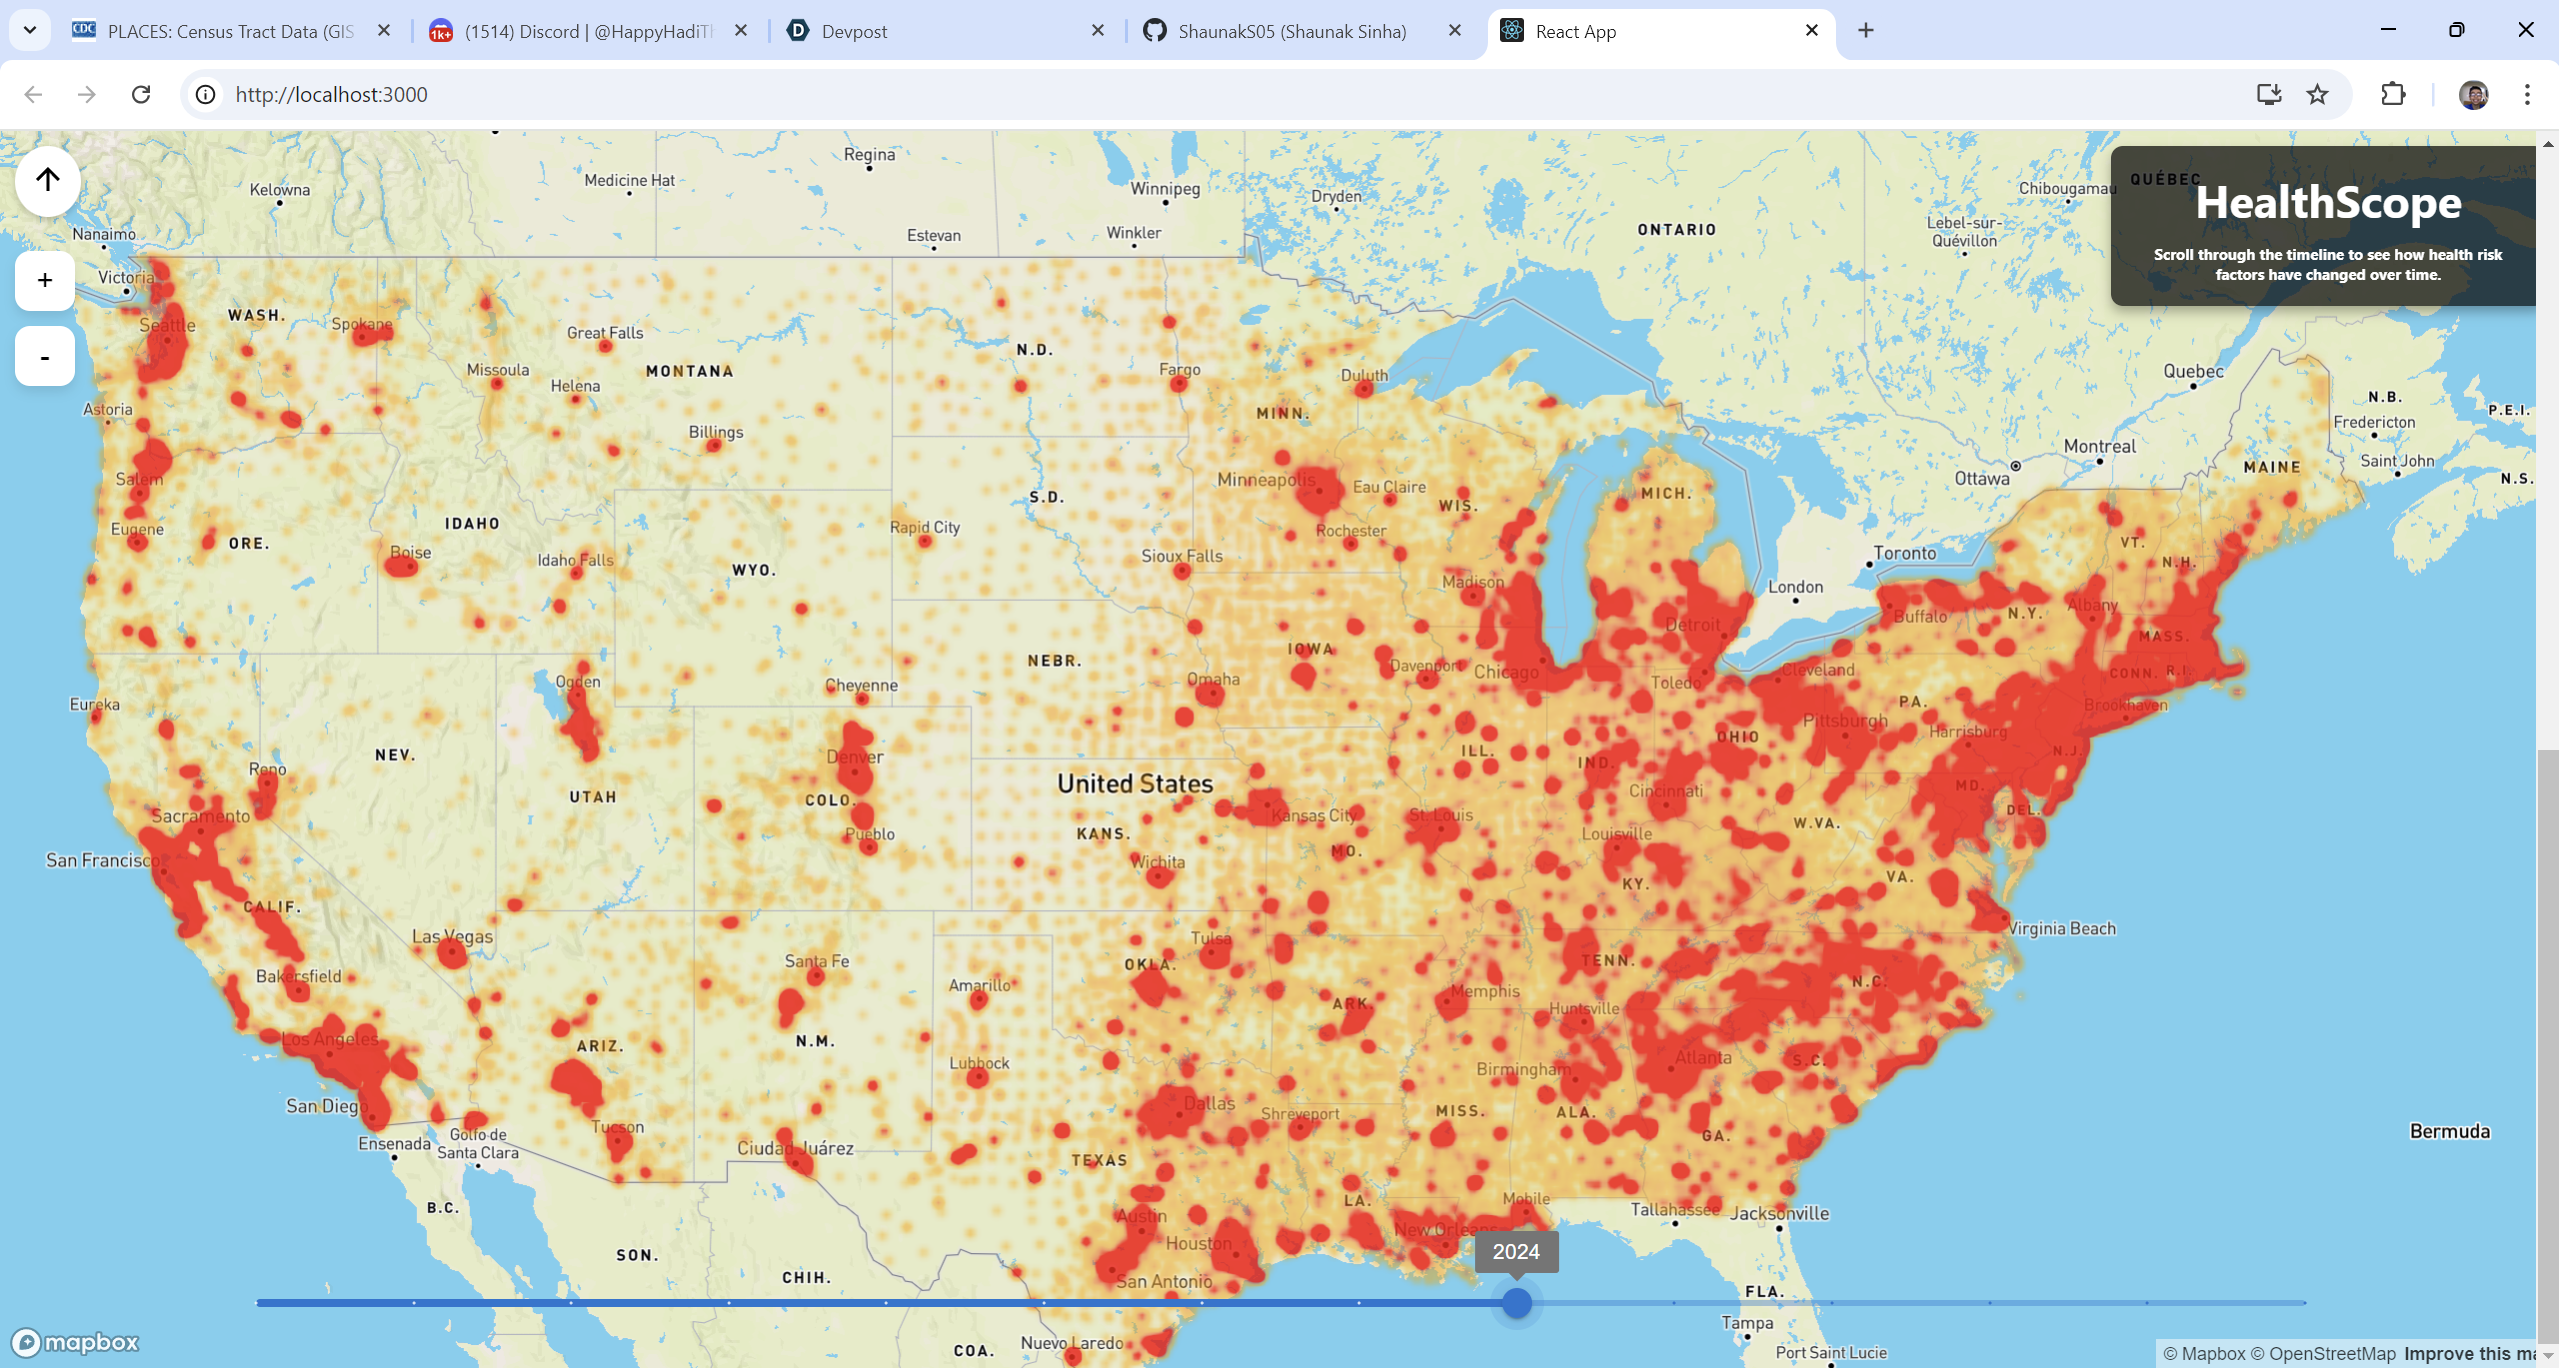
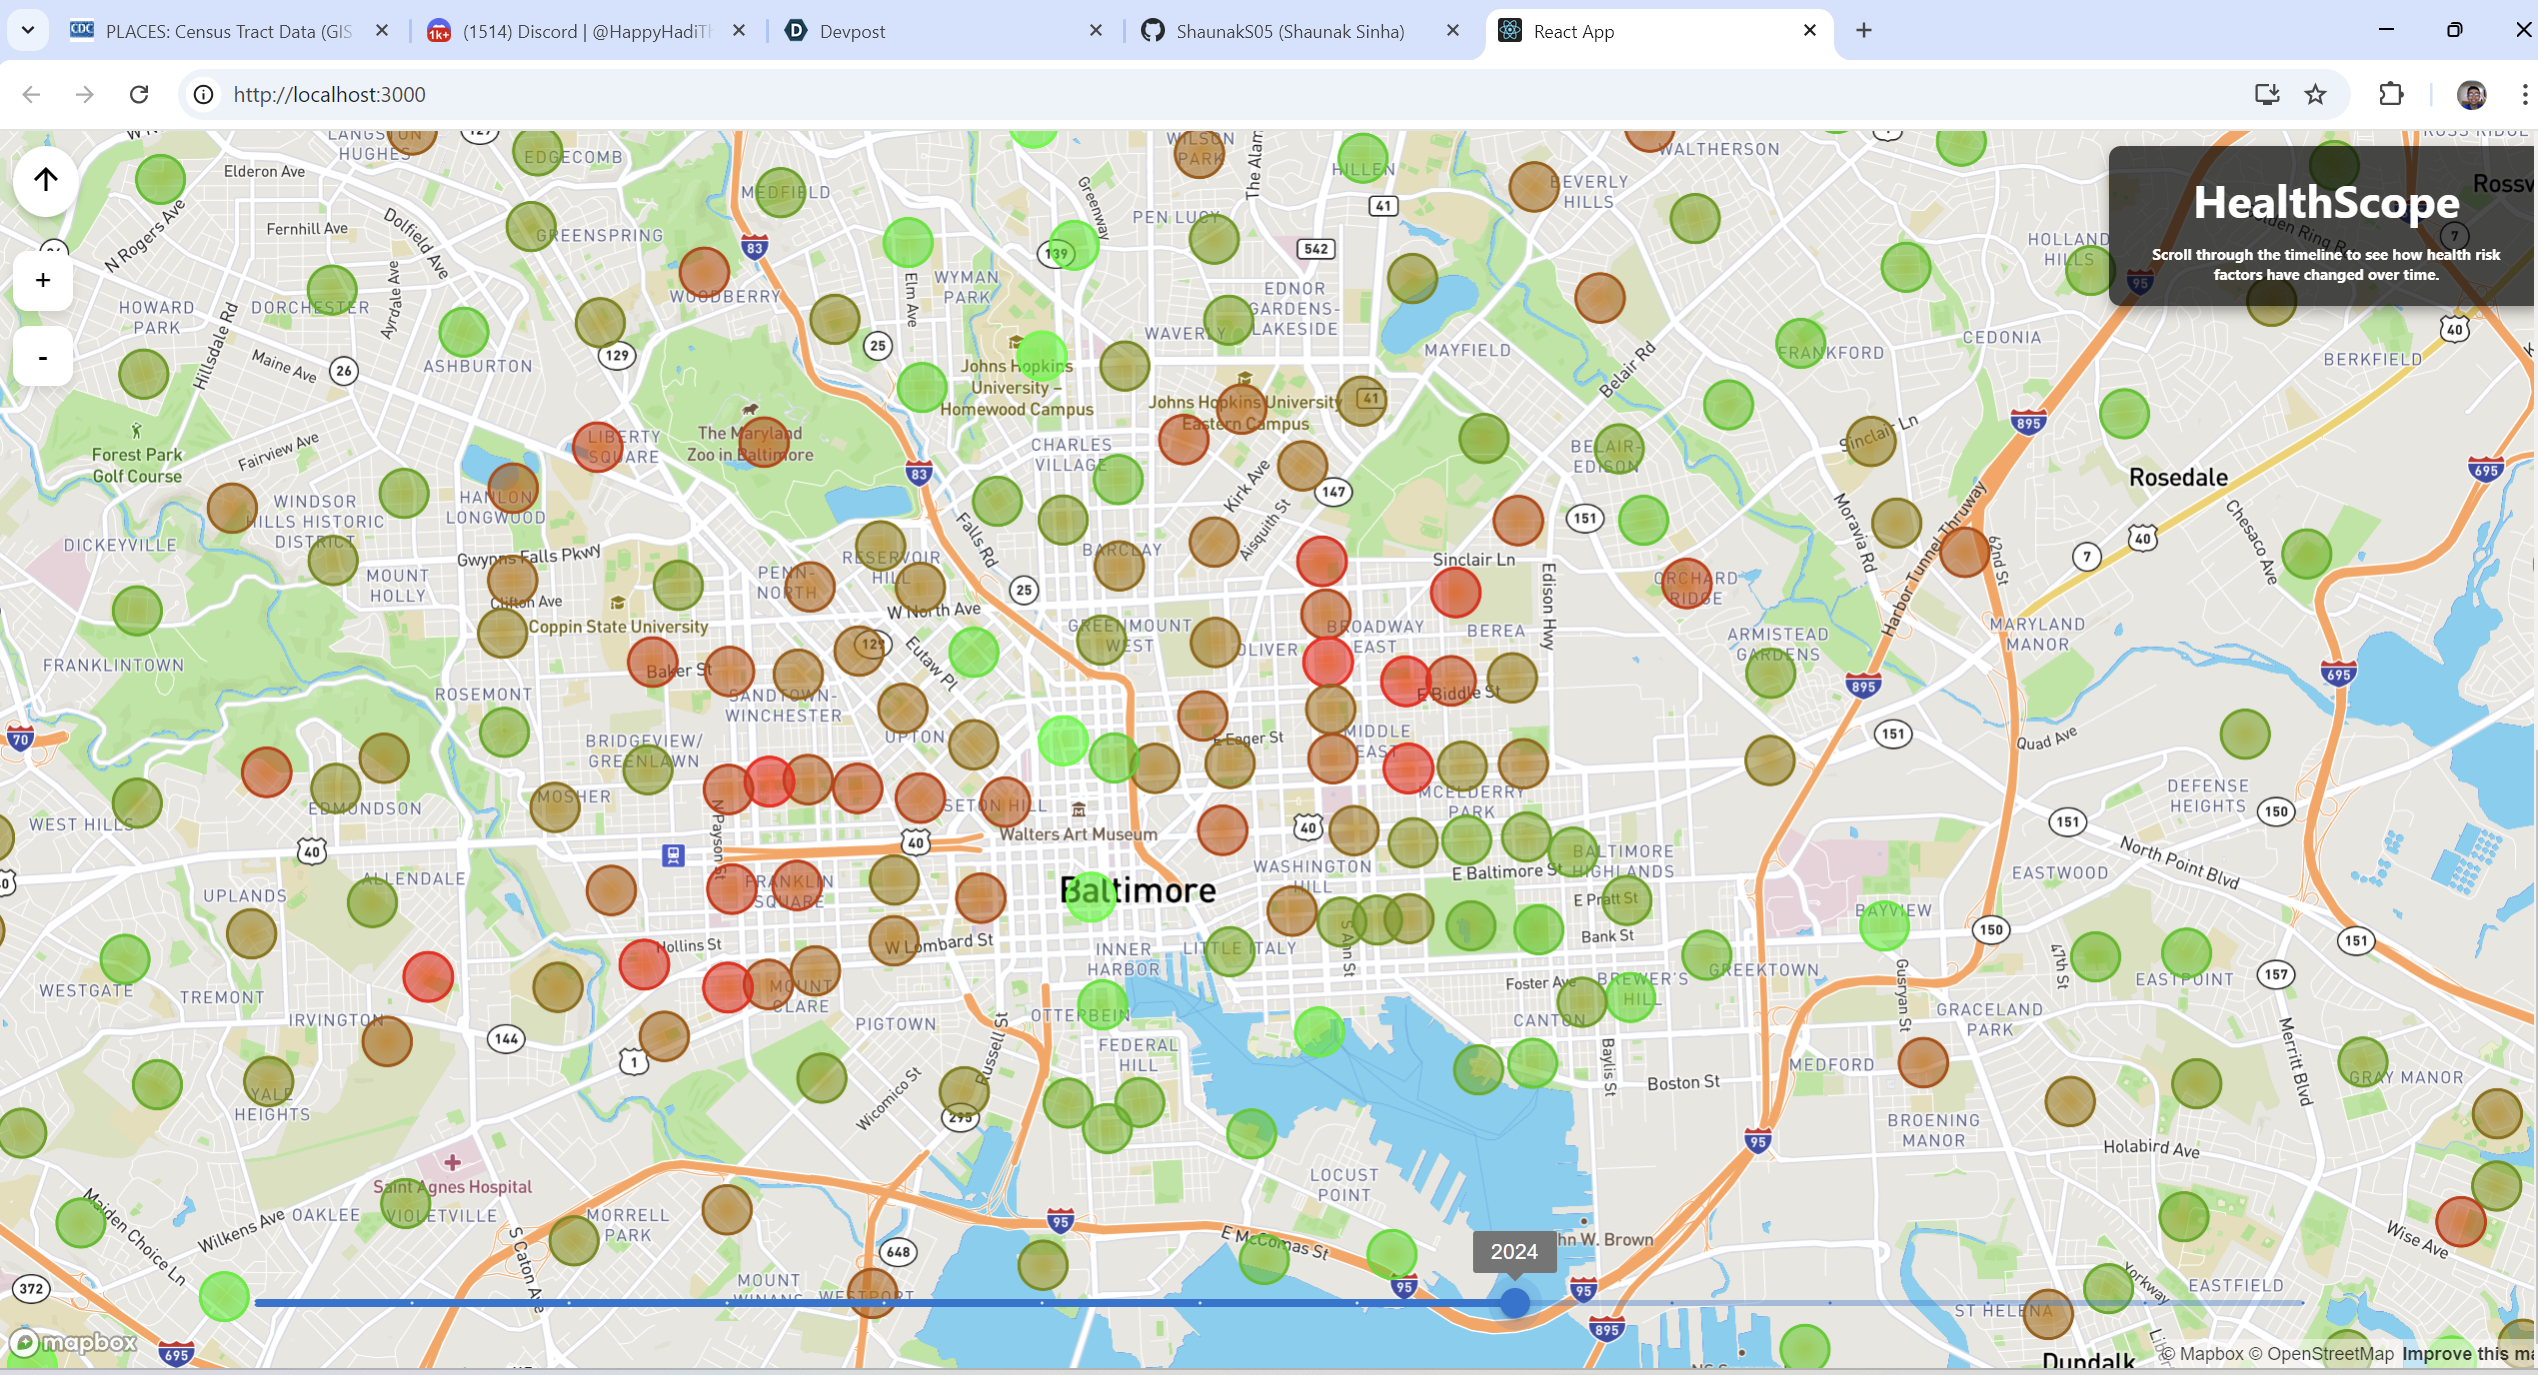
User Interface: Healthscope is a full-stack web app that clusters and aggregates Health Data from the past 8 years and plots it on over 70,000 US metropolitan cities and areas. HealthScope contains a unique geospatial heatmap that plots the different metropolitan cities and colors them according to there average HealthScore. Designed entirely using React.js, users can interact with the various points and gain an insight into some of the factors that determined the healthscore as well as the health score over the past several years. Users also hold the option to change the year in which they can view the data spanning any year from 2016-2024. Finally users can choose to forecast future health scores of various sites via a Geospatial Neural Network that has been extensively trained to forecast future health risks. Users can see the forecast for the next 5 years and for various locations across the United States
Data Caching: Data was extensively used throughout this project. To acquire this data, our team scanned over 40 different health website databases to see which ones contained various health statistics and spanned the loggest time intervals. Our team narrowed it down to Places: Census Tract Datasets which spanned over 8 years and contained health information for over 20 different risk factors and 70,000 different sites. These spreadsheets were combined to form one massive 500,000 cell csv that fed the data for our website and was used at forecasting future health risks.
Prediction Models: Our prediction model is a Geospatial Neural Network, with an input layer, 4 hidden layers following a 256-128-64-32 node pattern. The output layer is only one node, representing the Health Score that corresponds to the inputted data. The inputted data comes from the data we cleaned earlier. The model takes in year, latitude, and longitude all translated into geospatial coordinates. These values come from a .csv file and are converted to radians for lat and long and cycle for time in order to fit within our model. We trained this model with 400 epochs and obtained an MAE value of around 5. MAE stands for “Mean Average Error”, which represents the difference between the output and test data. We use MAE since our model is not a classification model; the closer MAE is to zero, the more accurate it is.
We created a CSV file that contains all years and latitudes/longitudes from 2016 to 2024 that match our constraints. Our model then predicts a Health Score value based on the future date input. We store these updated health indices in a json file which is then pushed to the front end and displayed. This model is a competitive product considering how variable the health indices are for different places, factors and years. By taking in numerous inputs, we enhance our results while adding to the complexity of training this model, overall having a novel take on the way we can classify, display, and predict health rates.
Challenges we ran into
Mutating large dataset requires lots of time and computing power, which are 2 things we lack at hackathons. So managing the long wait time were tough especially during only 36 hours.
What we learned
This project was very heavily centered around the usage of data. So we learned a lot about data analytics and data visualization. We also learned how to conduct statistic operations on large dataset.
What's next for HealthScope
We believe that there is a real future for HealthScope. In the future we will improve the neural network to more accurately predict future health data. This could be done by increasing the numbers nodes and layers, choosing a better activation function, and getting more training data. Along with those improvements we hope to increase the reach of HealthScope by creating prediction data for international users. Aswell finding more datasets from different sources will make the predictions and more adaptable. We hope to bring HealthScope to the world!


Log in or sign up for Devpost to join the conversation.