-
-
pagination!
-
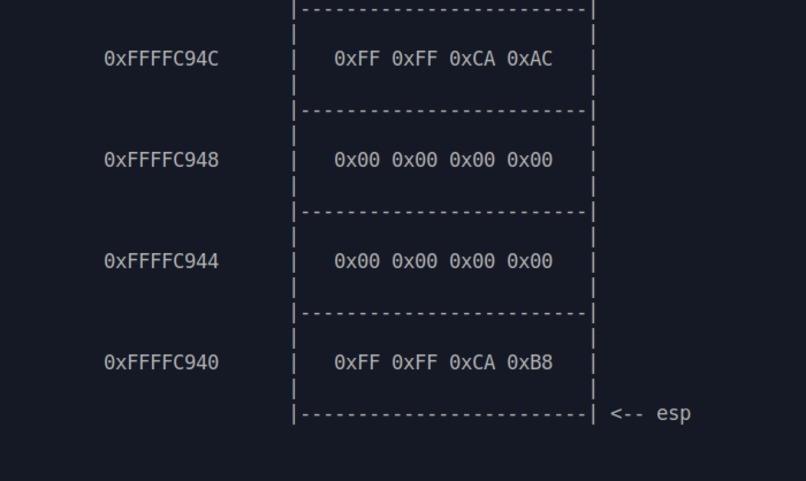
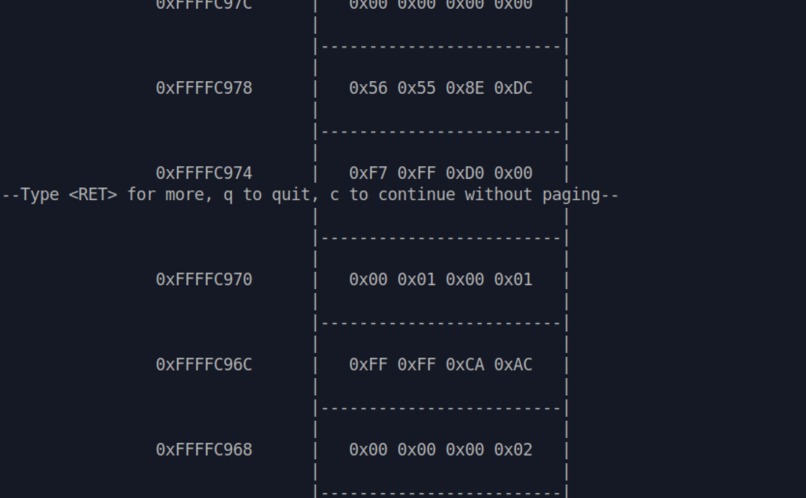
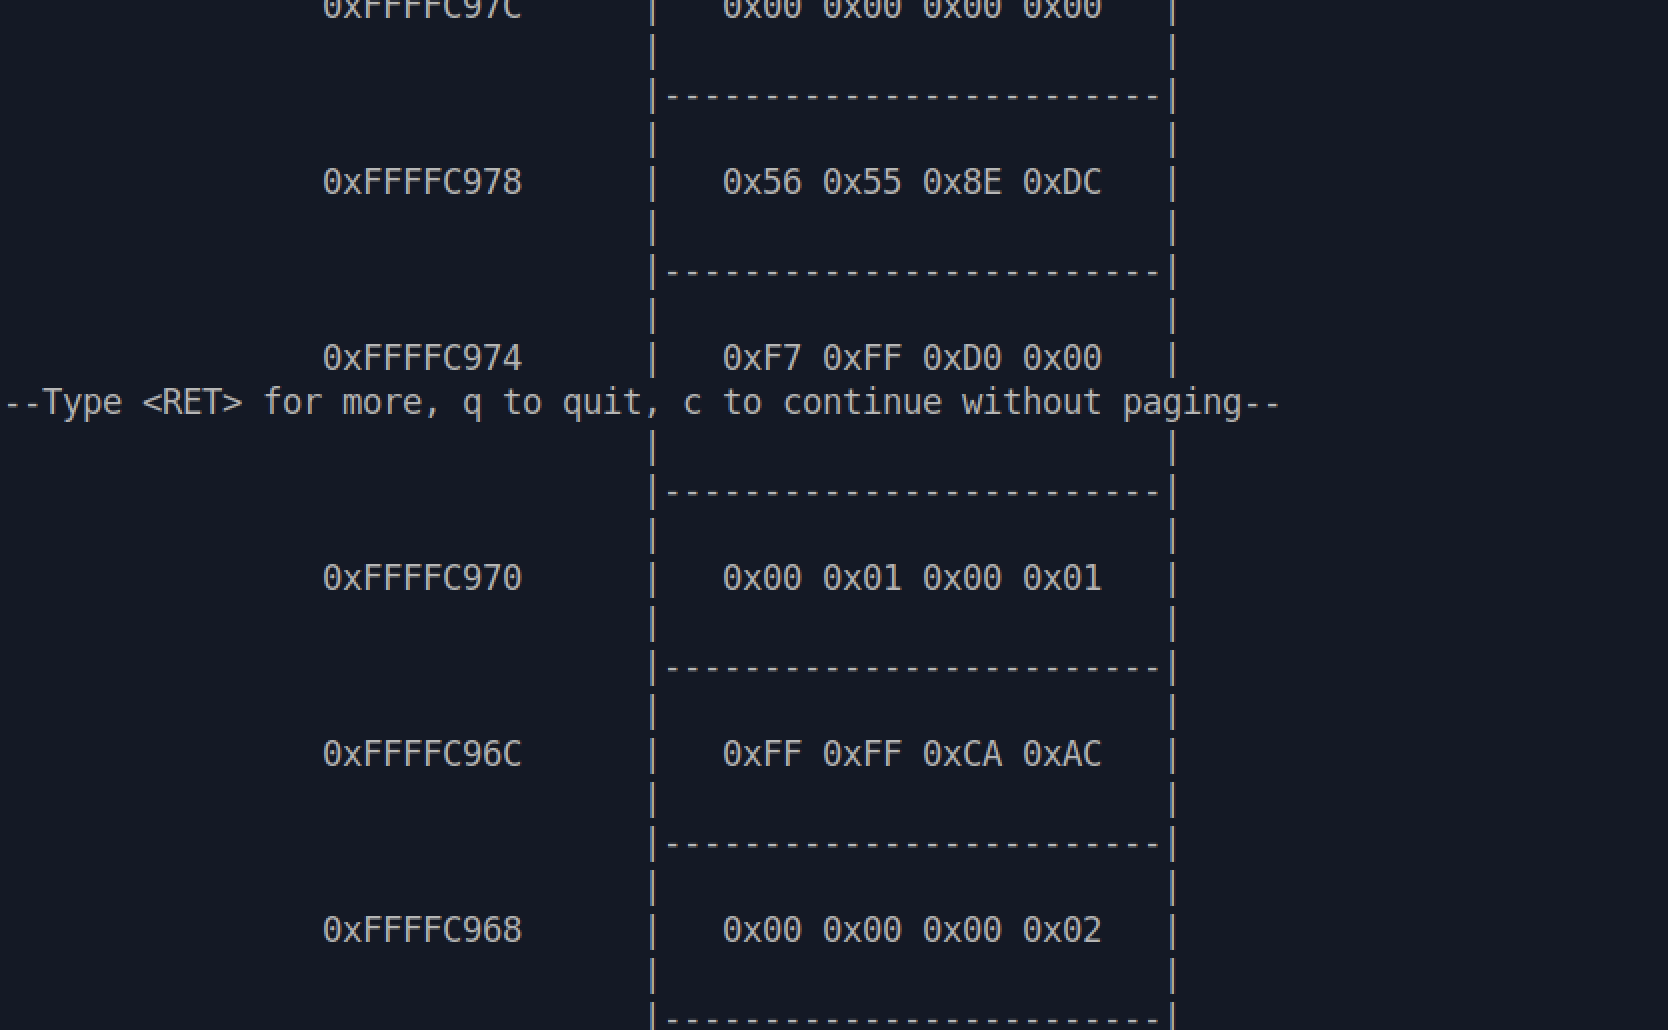
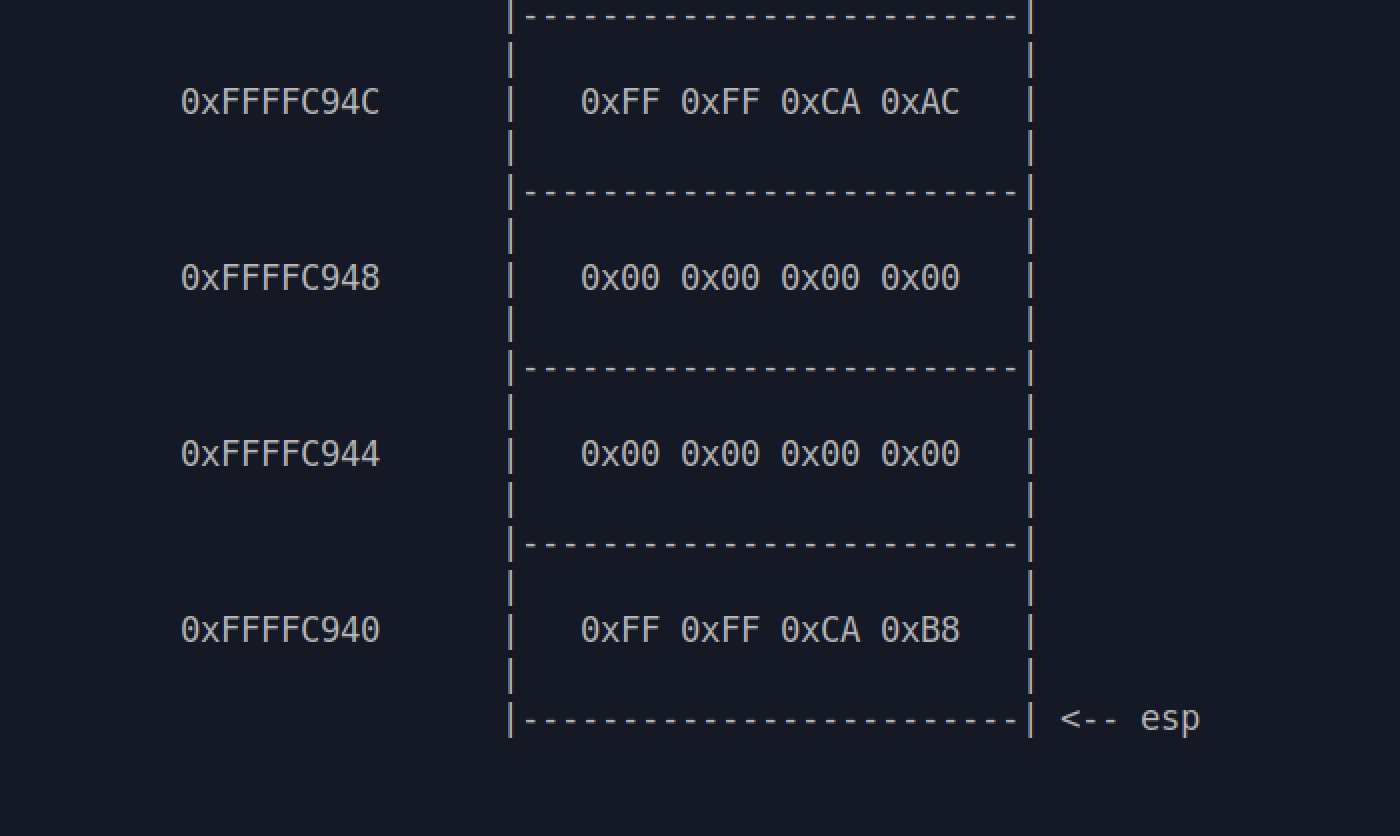
stack visualization :)
Inspiration
Exposing buffer overflow vulnerabilities often requires a good understanding of the values placed on the stack. I was inspired to build this program to help with this debugging in my software security class.
What it does
stackviz examines all the memory between the base pointer (%ebp) and the stack pointer (%esp) within your current program, and prints out an accurate stack visualization
How we built it
We used the gdb python API to read registers during program execution, and performed a few calculations to move through 4 bytes of the stack at a time, and print them to the terminal.
Challenges we ran into
Debugging code was challenging, because we couldn't directly run gdb on our plugin execution code
Accomplishments that we're proud of
We completed the implementation we planned to complete by the end of the day, and the stack visualizer works well
What we learned
Moving forward with a smaller project and expanding on it during the hackathon was the best way to get the most done
What's next for stackviz
We want to add support for flags that view certain parts of memory as a predefined type (ex: string), and stack diffs (like stack version control)
Built With
- bash-script
- gdb
- python


Log in or sign up for Devpost to join the conversation.