-
-
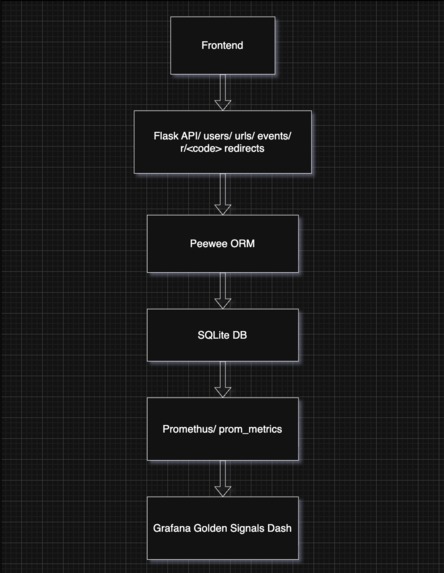
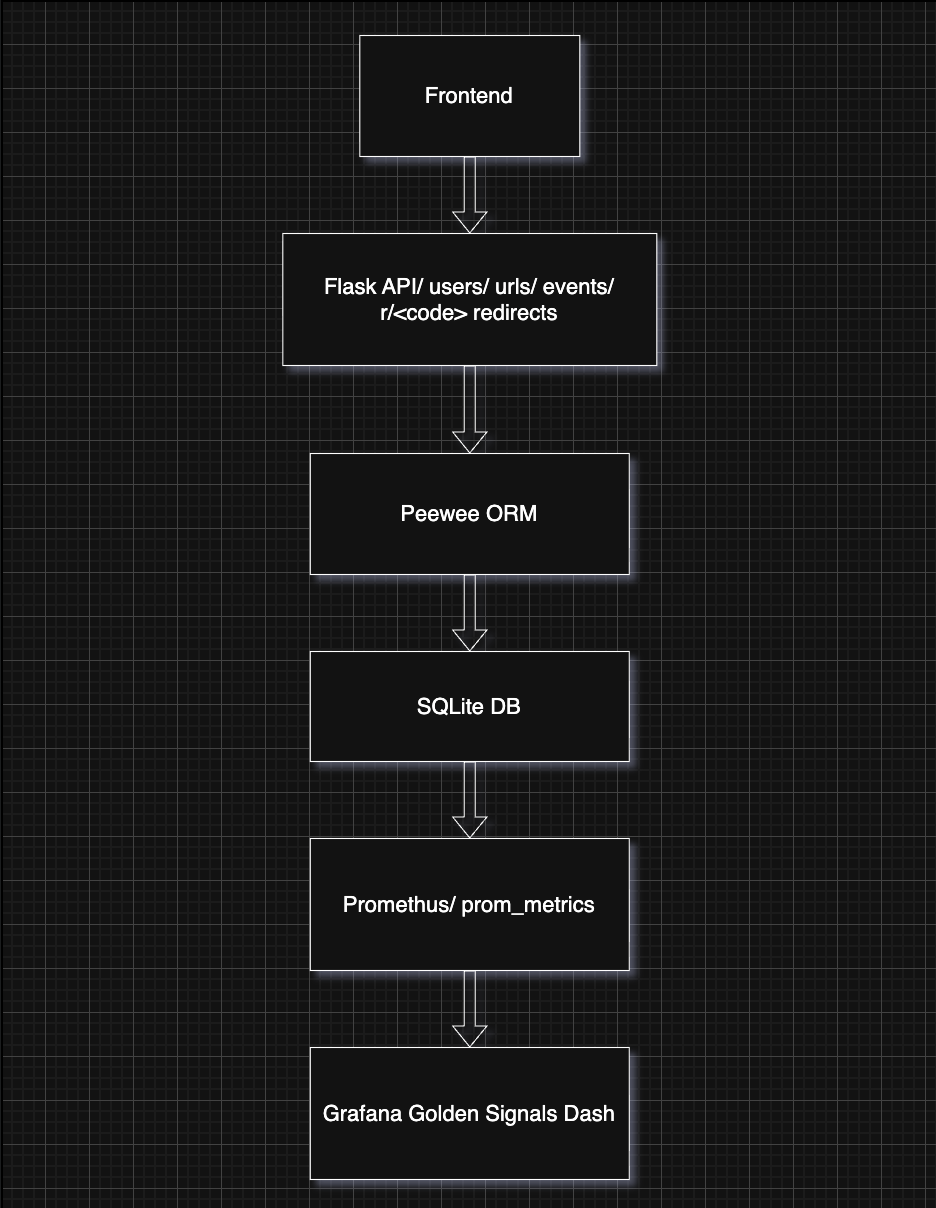
Architecture diagram showing how the API, database, metrics pipeline, and dashboard components interact.
-
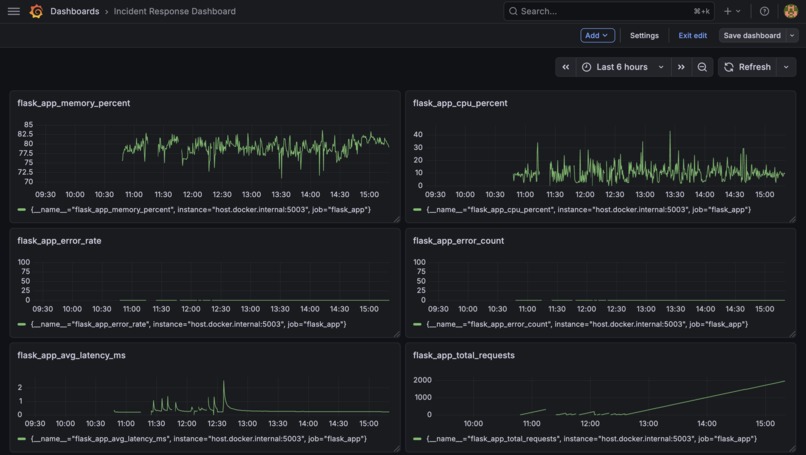
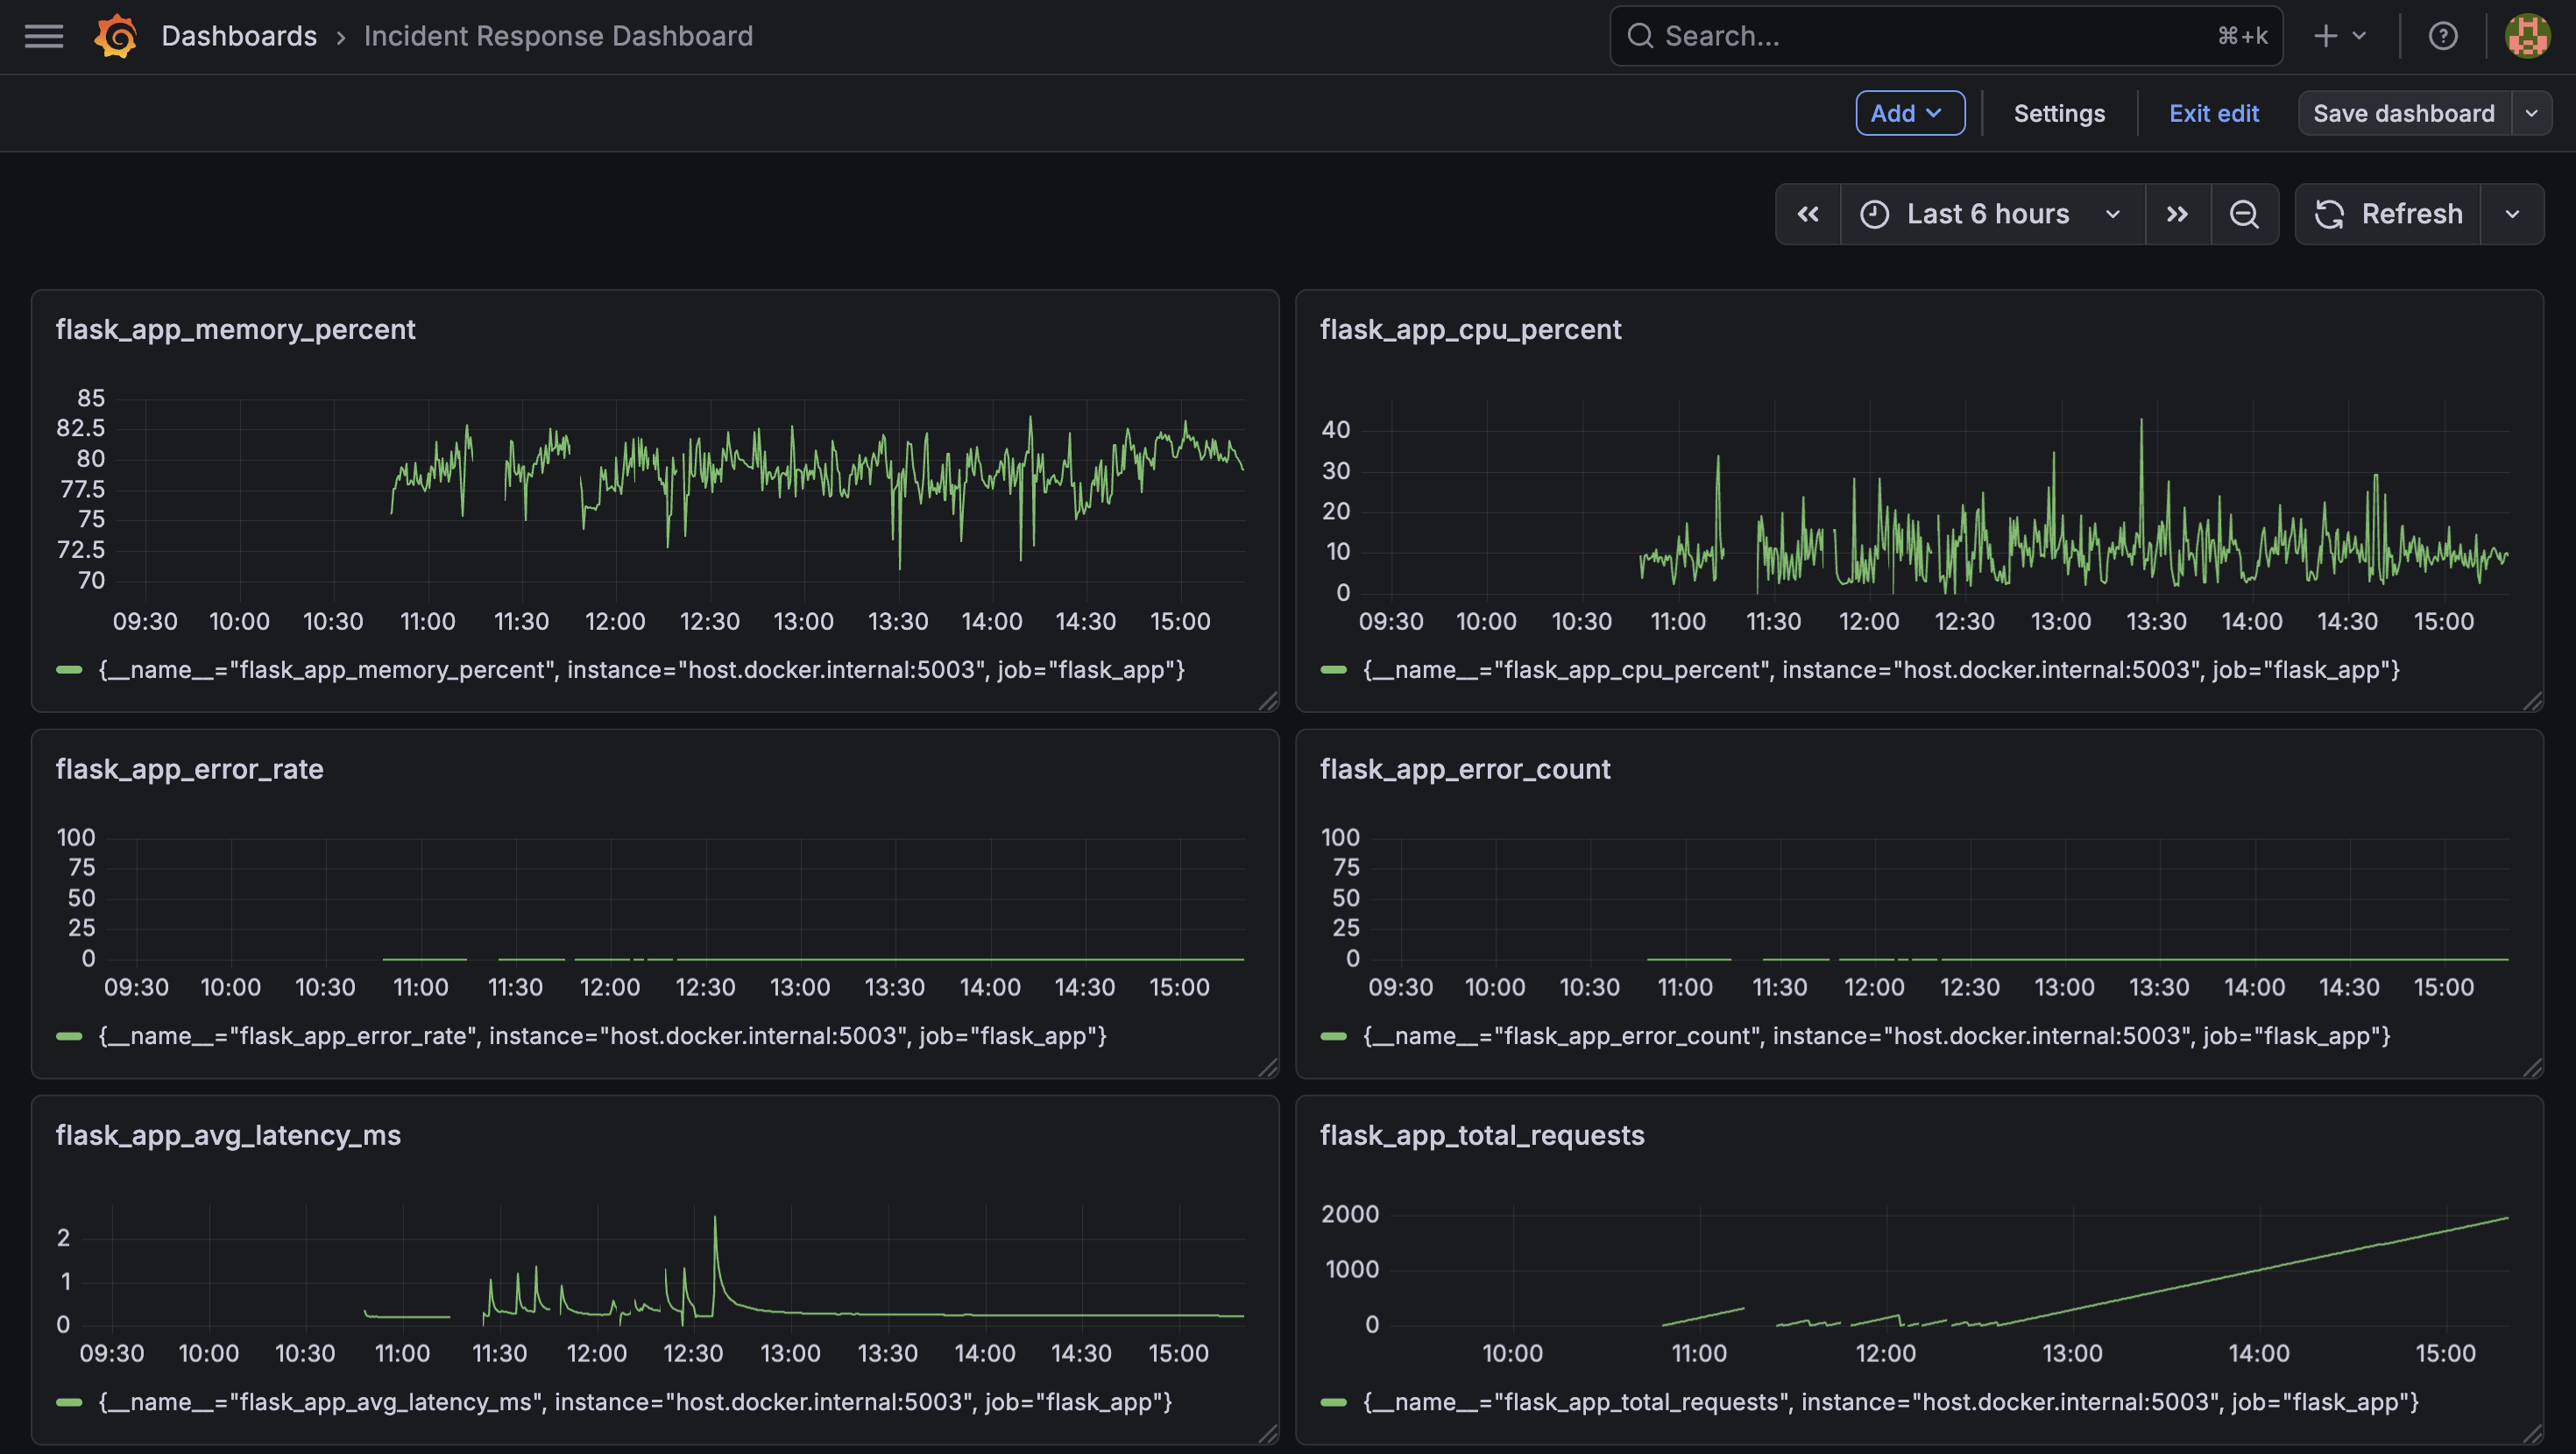
Grafana dashboard showing the Golden Signals: latency, traffic, errors, CPU usage, and memory usage.
-
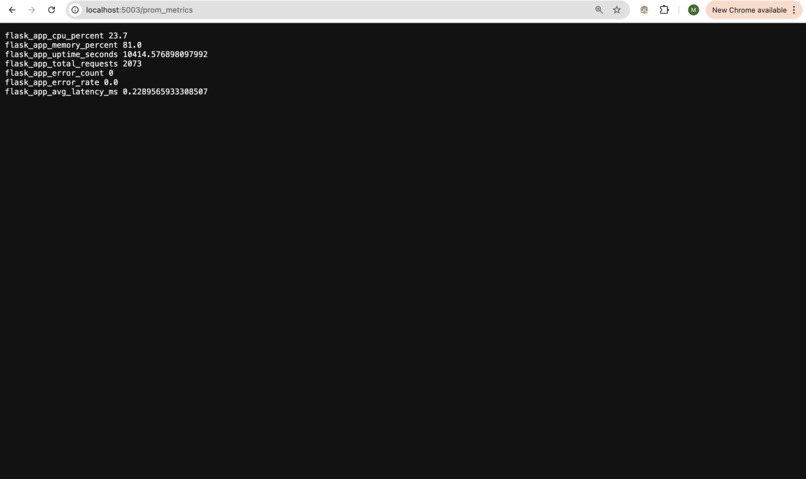
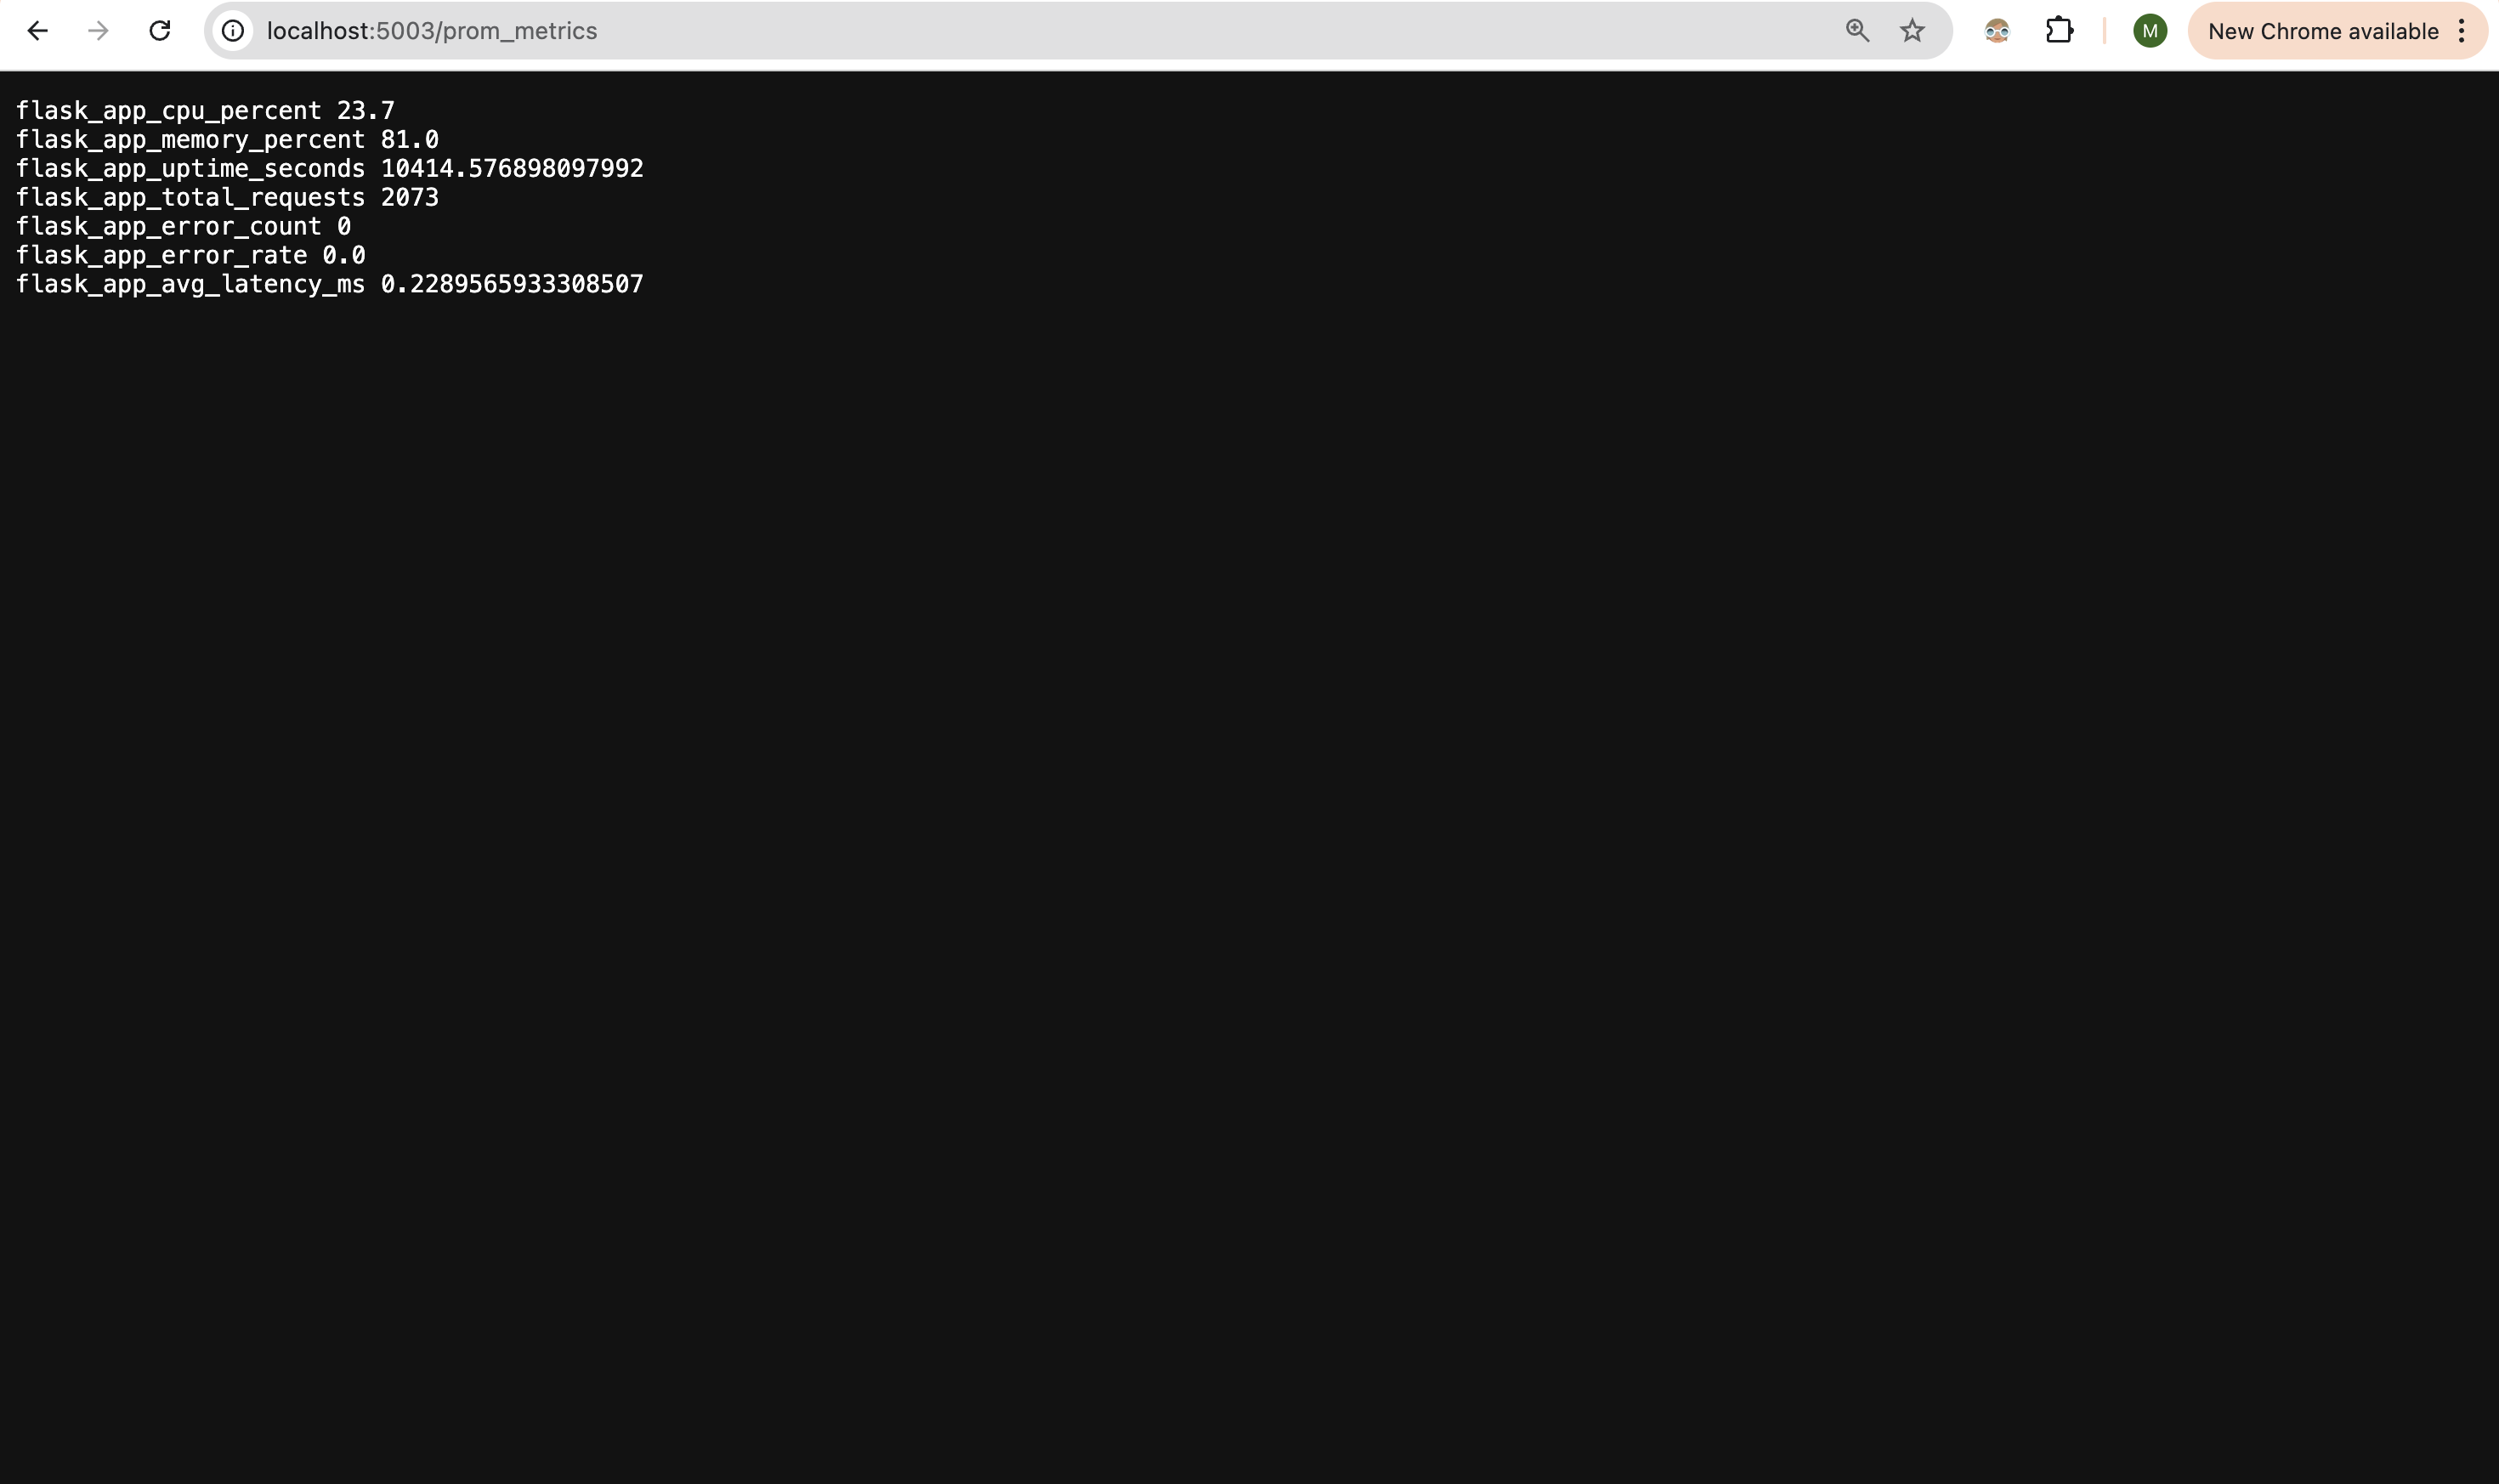
Raw Prometheus metrics exported from the service through the /prom_metrics endpoint.
-
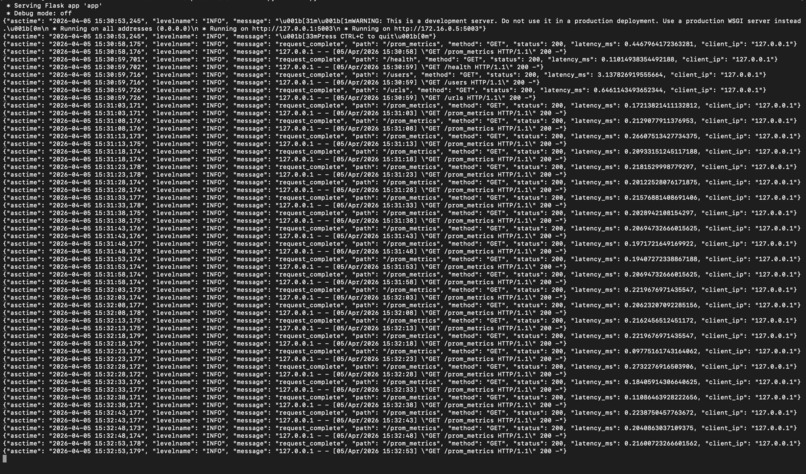
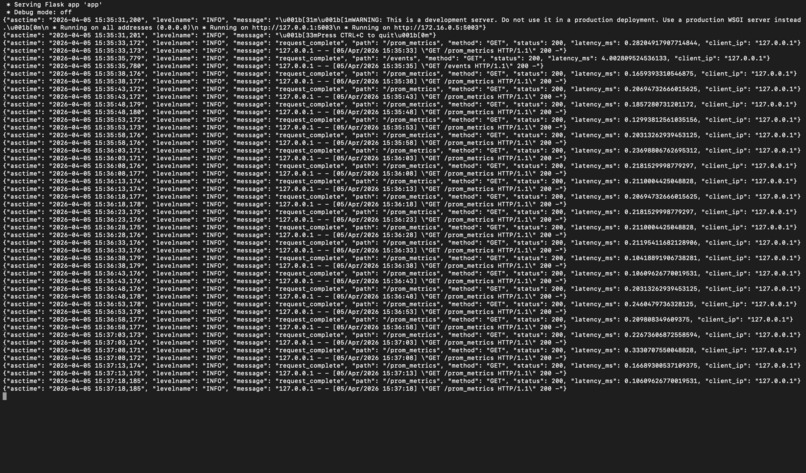
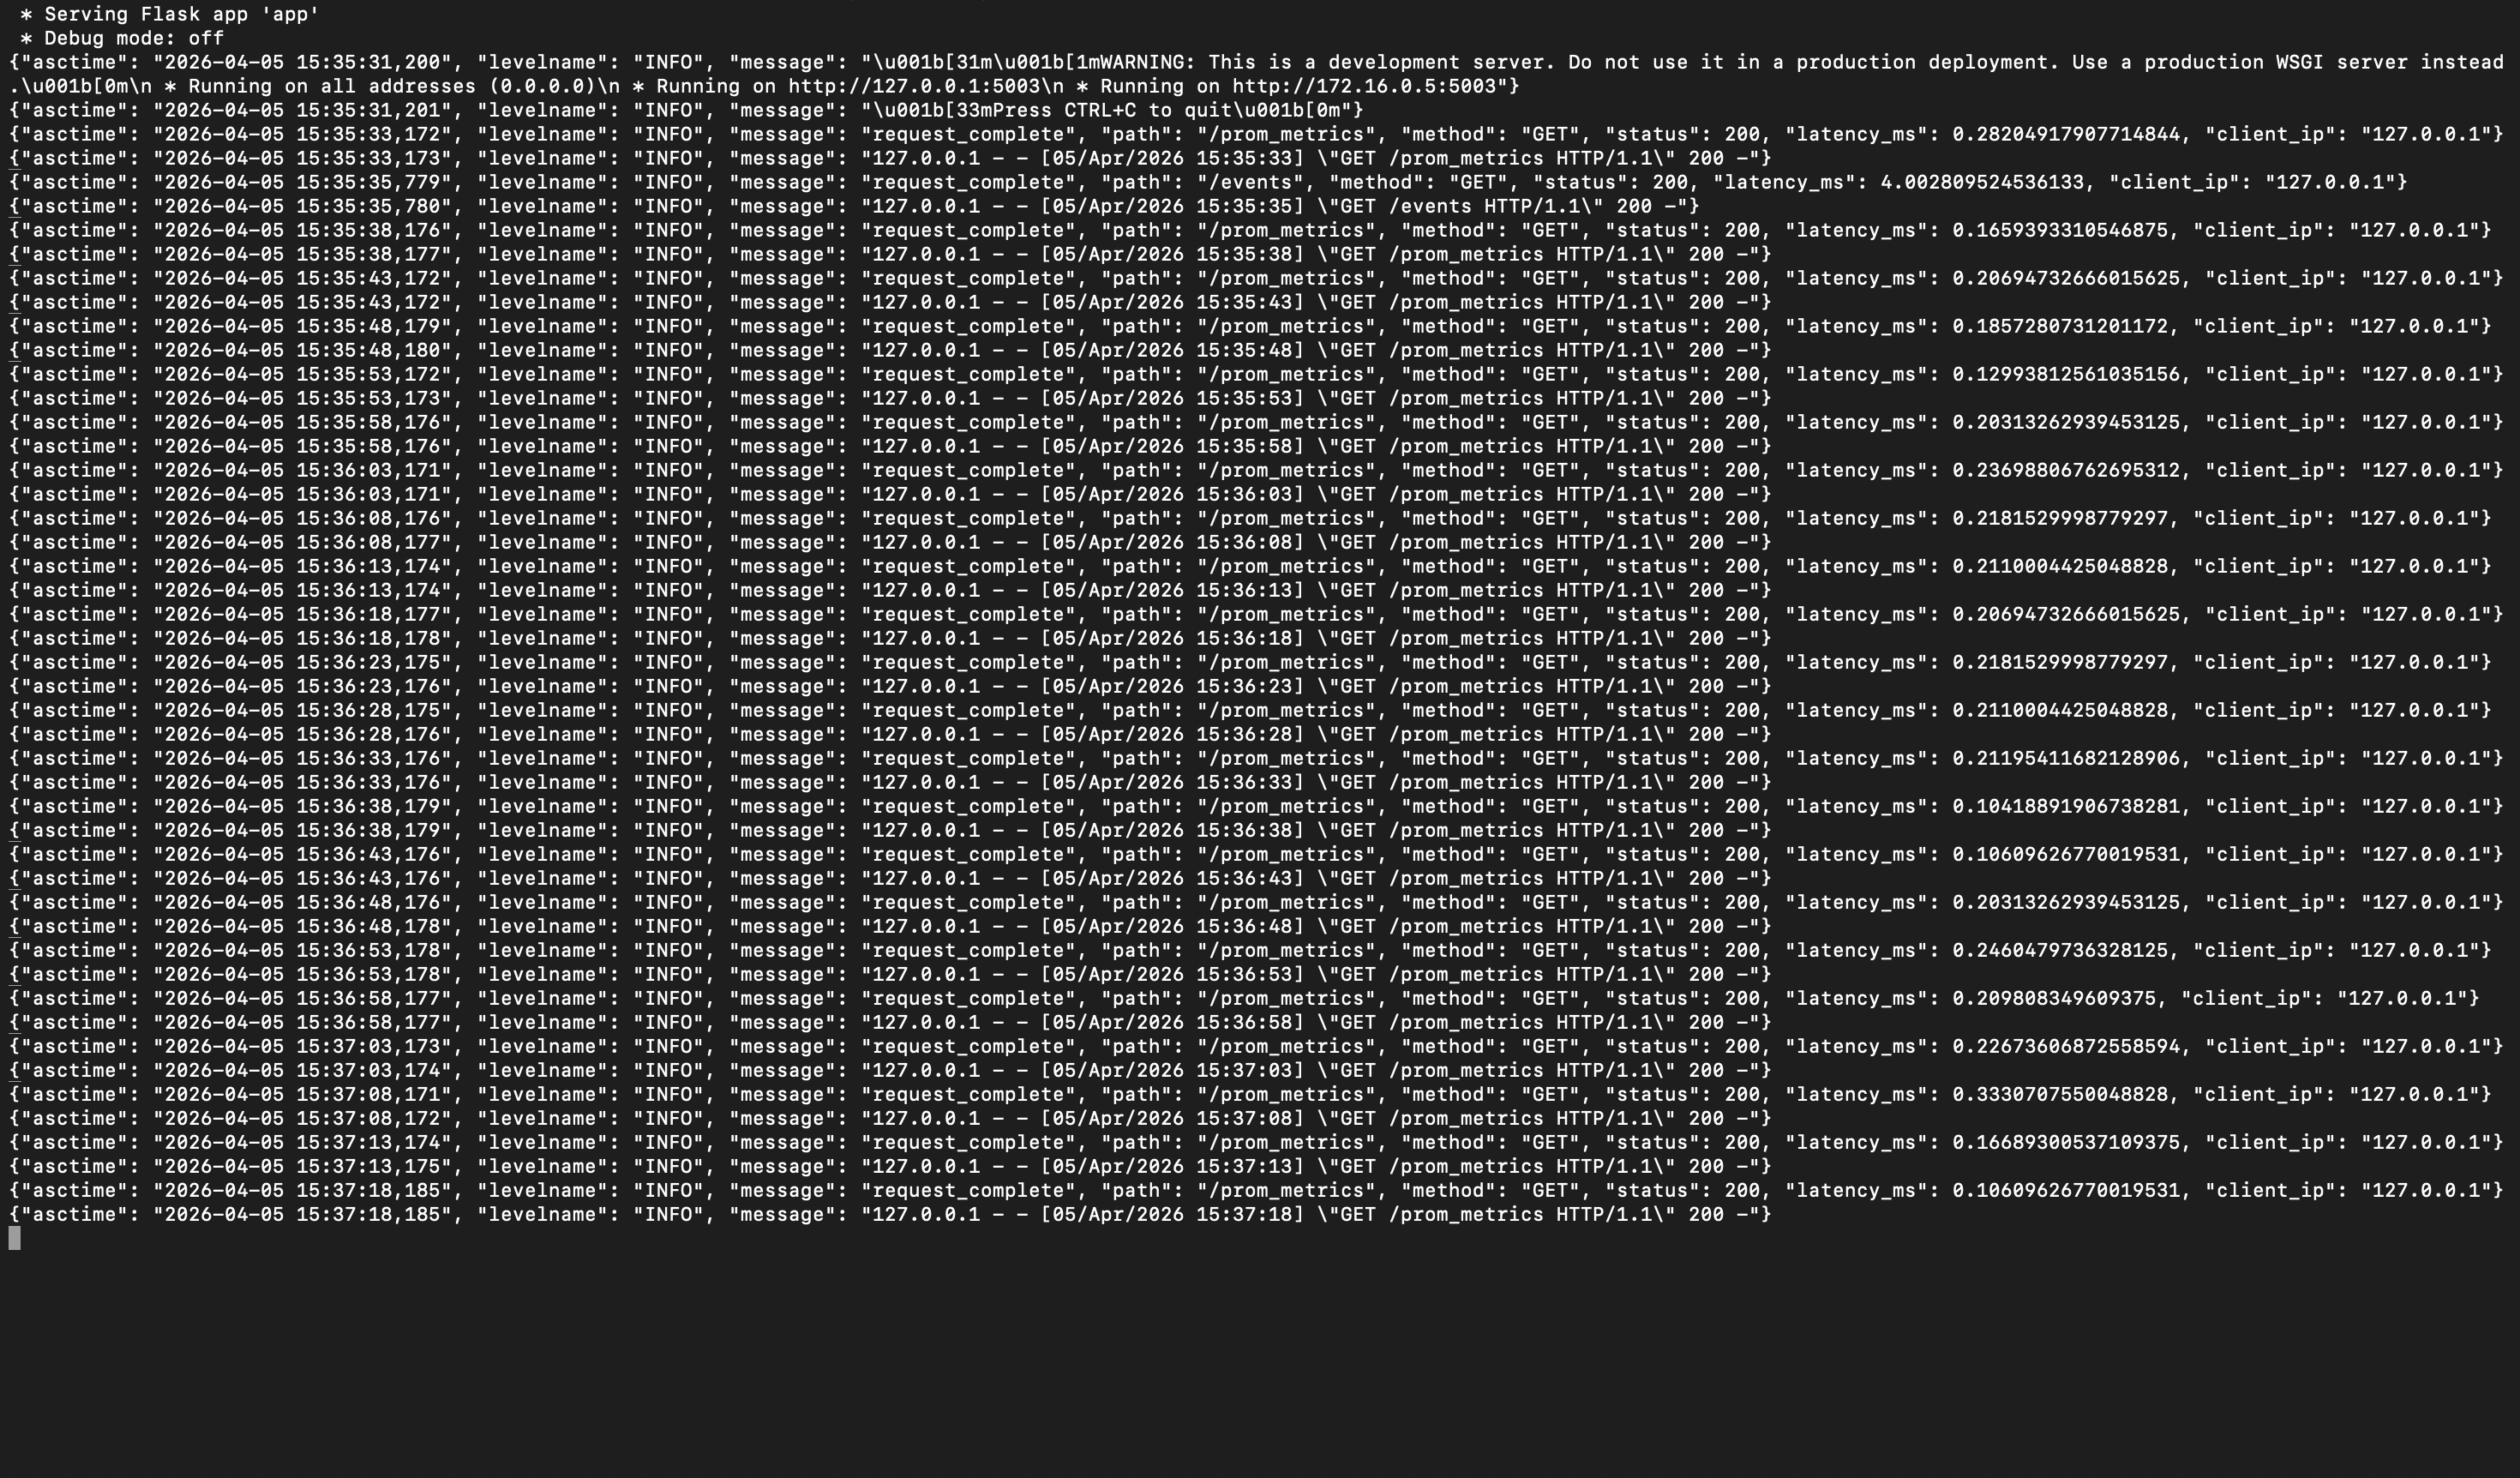
Structured JSON logs capturing request paths, status codes, timestamps, methods, and response times.
-
Events recorded by the system showing URL activity and event details retrieved via the /events endpoint.
-

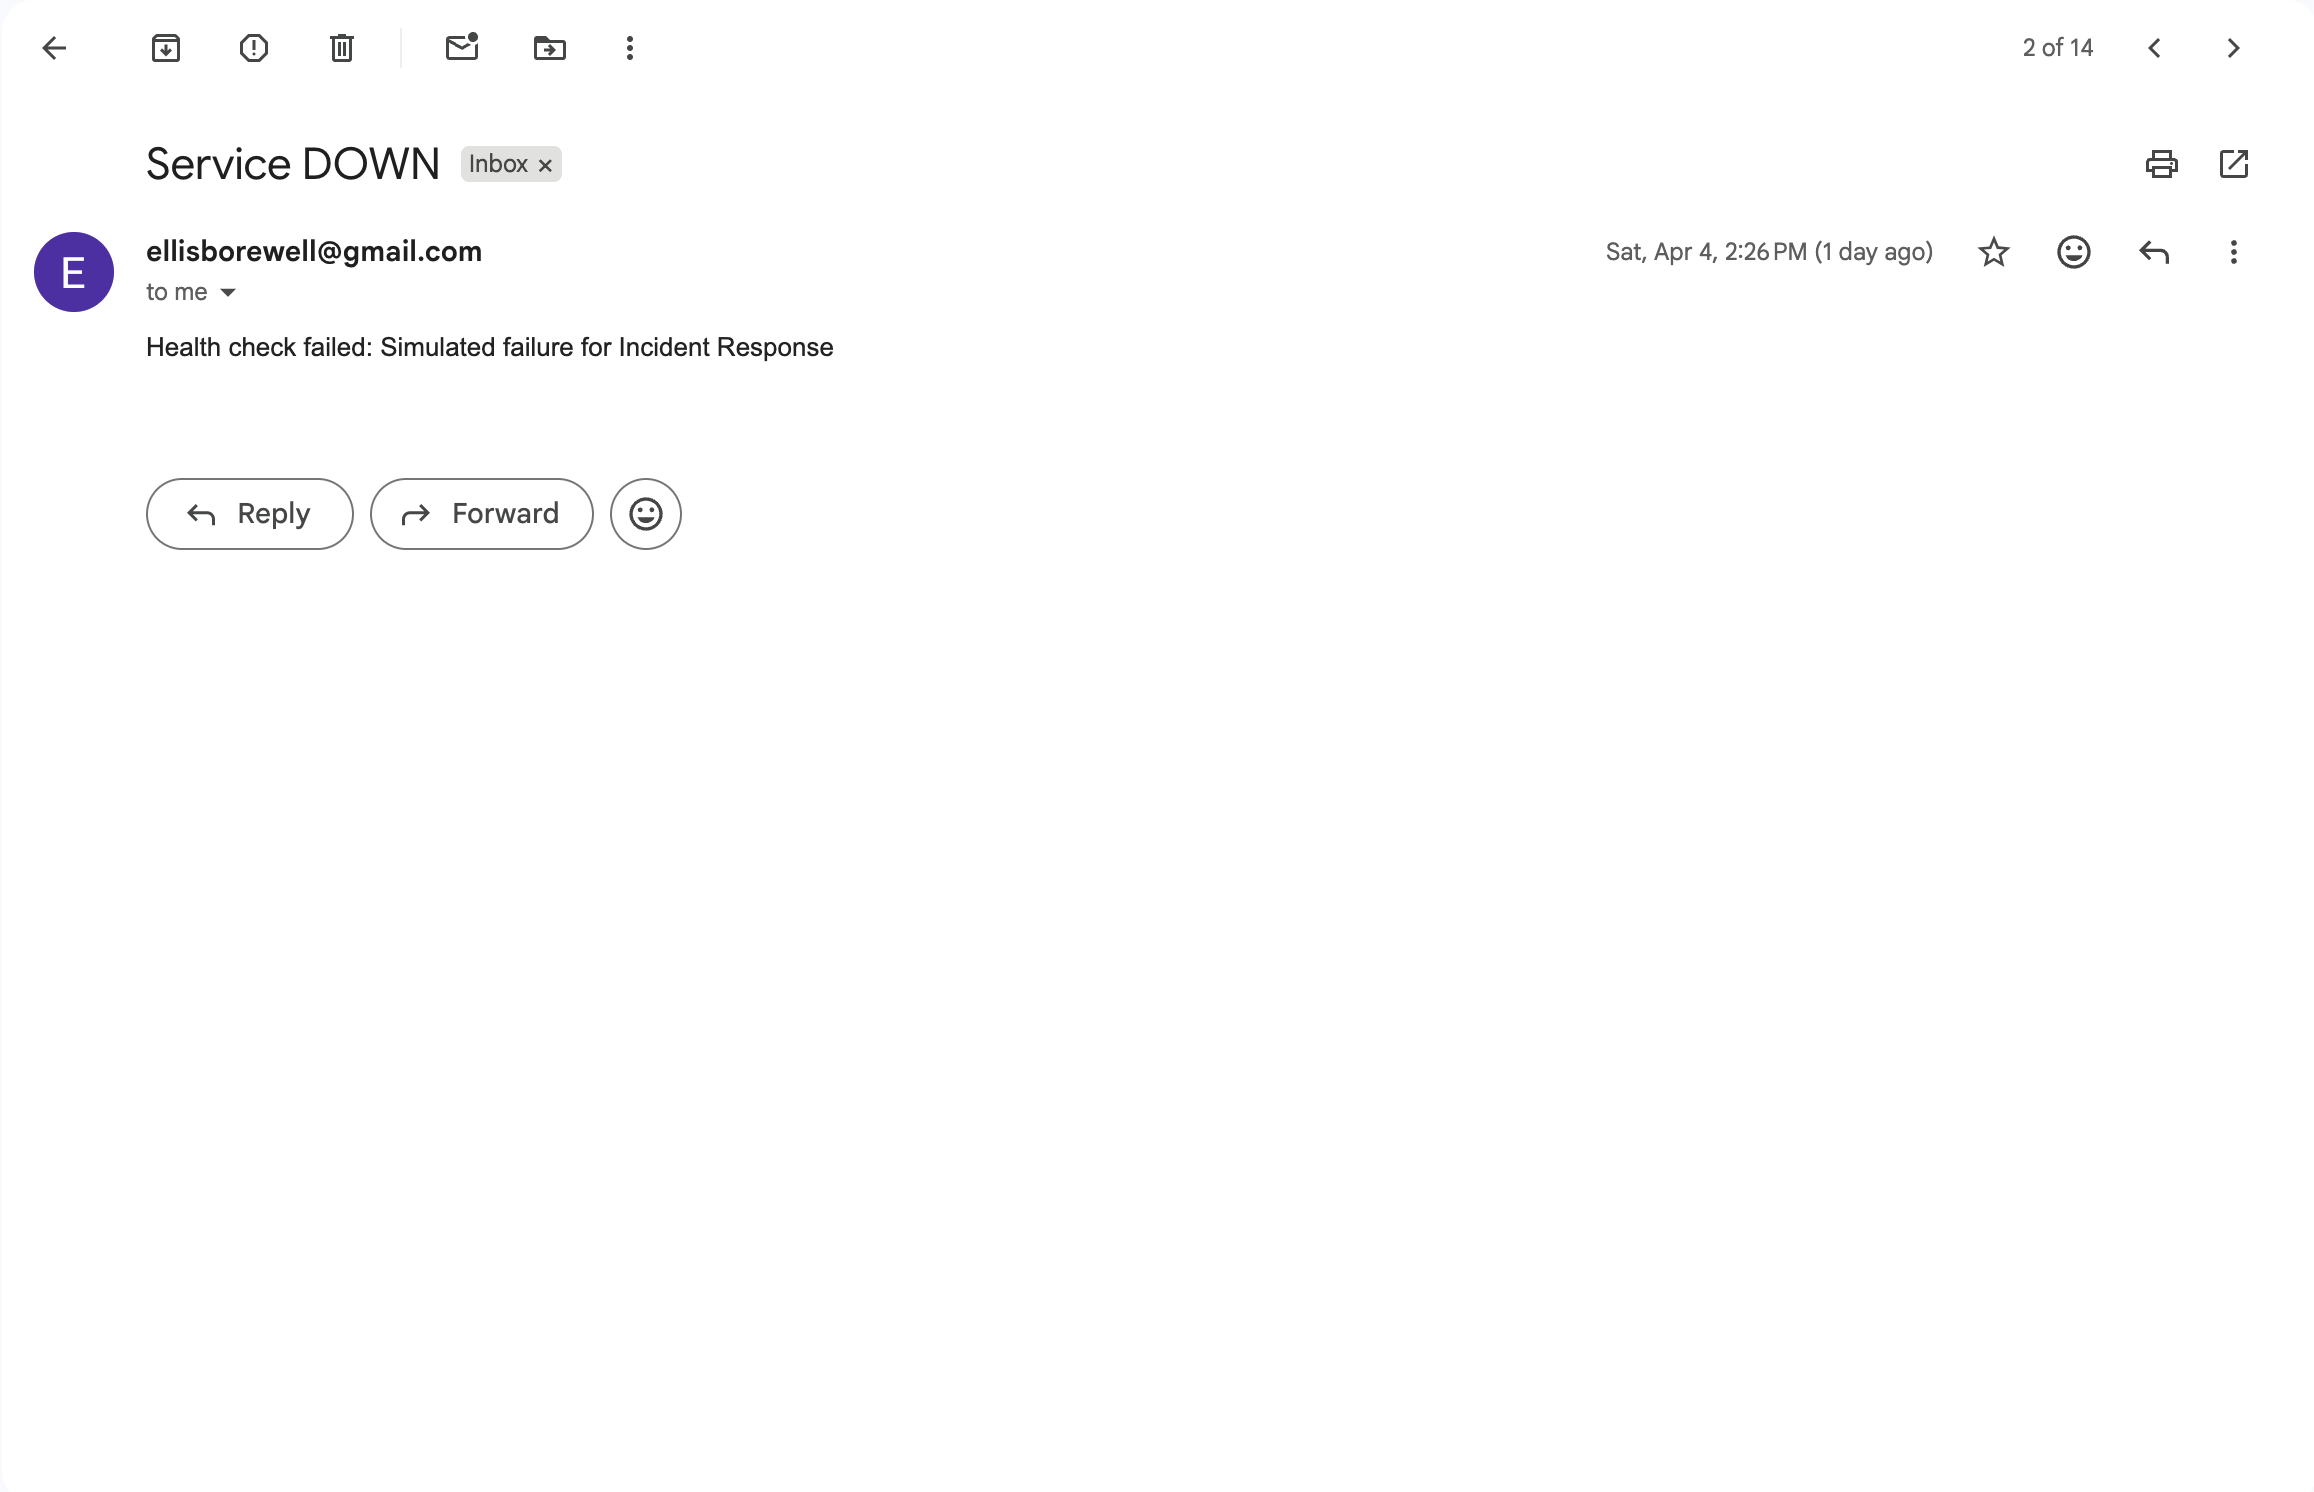
Alert email triggered by the monitoring system in response to a service failure condition.

Inspiration
We wanted to build something that behaves like a real production service rather than a simple web app. Modern systems need strong logging, monitoring, alerting, and recovery workflows. A URL shortener is simple enough to understand, but powerful enough to demonstrate real Site Reliability Engineering concepts. This project grew from the idea of learning what happens after code is deployed and how engineers detect, respond to, and solve incidents in live systems.
What it does
This project is a fully instrumented URL shortener with deep observability features. It provides a complete REST API that allows users, URLs, and events to be created, updated, deleted, and tracked. The service exports Prometheus metrics, displays the Golden Signals through a Grafana dashboard, and emits structured JSON logs for every request. It sends alert emails whenever the service goes down or whenever error rates increase. It also includes a detailed runbook and a complete root cause analysis example that explains how to investigate and recover from production issues.
How we built it
The backend is implemented in Python using Flask for routing and Peewee ORM for database modeling. SQLite is used as the datastore because it is fast, simple to manage, and well suited for a service of this size. Metrics are collected through a custom Prometheus endpoint, and these metrics feed into a Grafana dashboard that visualizes latency, error rates, traffic volume, CPU usage, and memory pressure. Structured JSON logging was added to make logs easy to parse and search. Alerts are generated using Prometheus alert rules and routed through Alertmanager to email. Docker Compose is used to run Prometheus and Grafana together in a clean and repeatable way. The documentation, runbook, and RCA were written by analyzing realistic failure scenarios and describing clear, actionable steps that any engineer could follow during an incident.
Challenges we ran into
Building a reliable service requires more than just writing working endpoints. A few challenges included: making sure logs were consistent and readable, designing metrics that were meaningful and not just noise, tuning alert rules so they respond to real problems and not normal fluctuations, organizing Grafana in a way that presents the Golden Signals clearly, ensuring shortcodes never collide and that URL deduplication works consistently, and writing documentation that is easy to follow during a stressful incident. These challenges helped us understand real production concerns that usually do not appear in smaller projects.
Accomplishments that we're proud of
We are proud that the project feels like a real production system rather than a simple backend. The observability stack works end to end, including structured logging, Prometheus metrics, Grafana panels, and real alert emails. The API is stable and passed almost all automated tests. The documentation, runbook, and RCA are clear and useful, which was an important goal for us. Seeing the dashboard update in real time while the system handled requests was a great moment for both of us.
What we learned
We learned how important good observability is for any backend service. Metrics and logs tell different parts of the same story, and both are necessary for diagnosing issues quickly. We learned how alerting works and why alerts have to be carefully tuned. We also learned how to think like an on‑call engineer by writing runbooks and analyzing issues through an RCA. We gained experience with Prometheus, Grafana, Alertmanager, structured logging, Docker Compose, Flask, Peewee ORM, and proper API documentation. All of these tools helped create a service that behaves like something you would actually deploy in production.
What's next for SREnity Squad - URL Shortener + Incident Response Dashboard
We want to continue improving the reliability and usability of the system. One of our goals is to add rate limiting so the service can handle heavier traffic more safely. We also want to introduce caching to speed up responses and reduce database work. Longer term, we hope to add a simple front end and experiment with container orchestration to see how the service behaves under higher load.


Log in or sign up for Devpost to join the conversation.