Inspiration
Growing up in the Triangle, we’ve seen Chapel Hill pioneer innovative policies, from early fare-free public transit to ambitious carbon-reduction goals. Yet, as these policies emerged, their future far-reaching effects on local communities were often difficult for residents to visualize. Decisions about housing, public spending, transportation, and environmental protection involve complex trade-offs, and their consequences for residents’ everyday lives are not always immediately clear.
Inspired to make these connections more tangible, we created Prosperia.
What it does
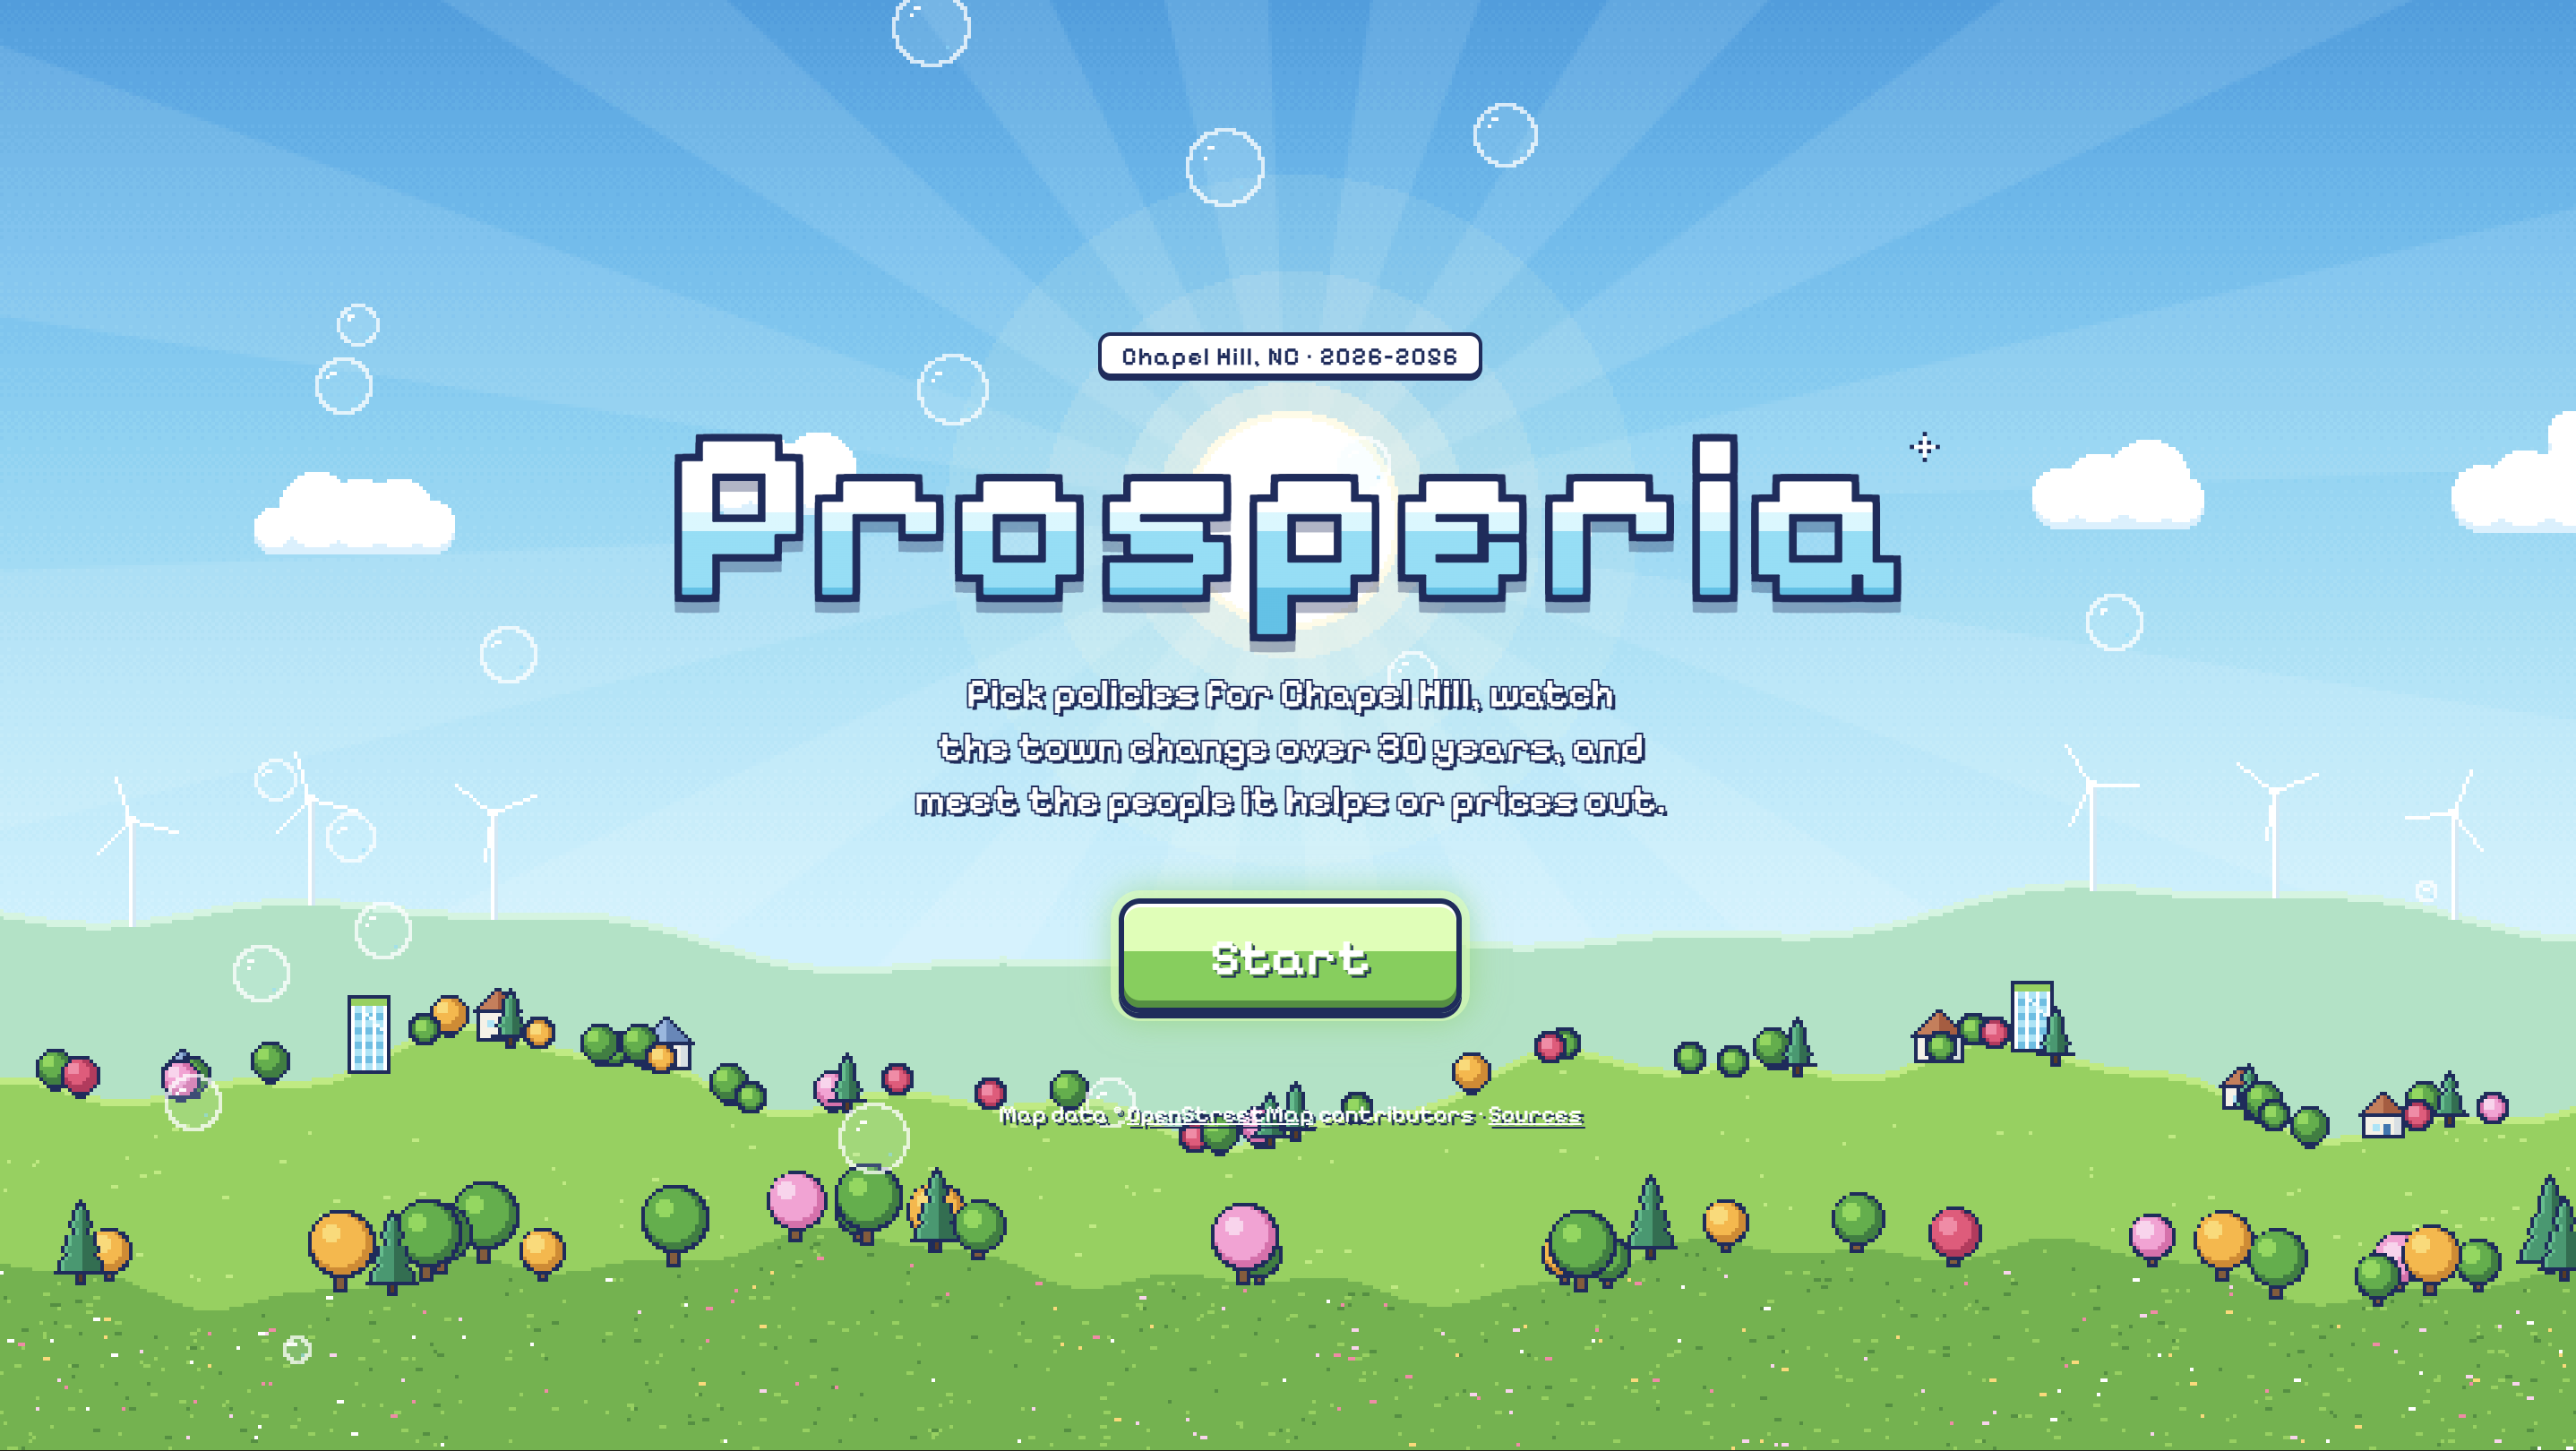
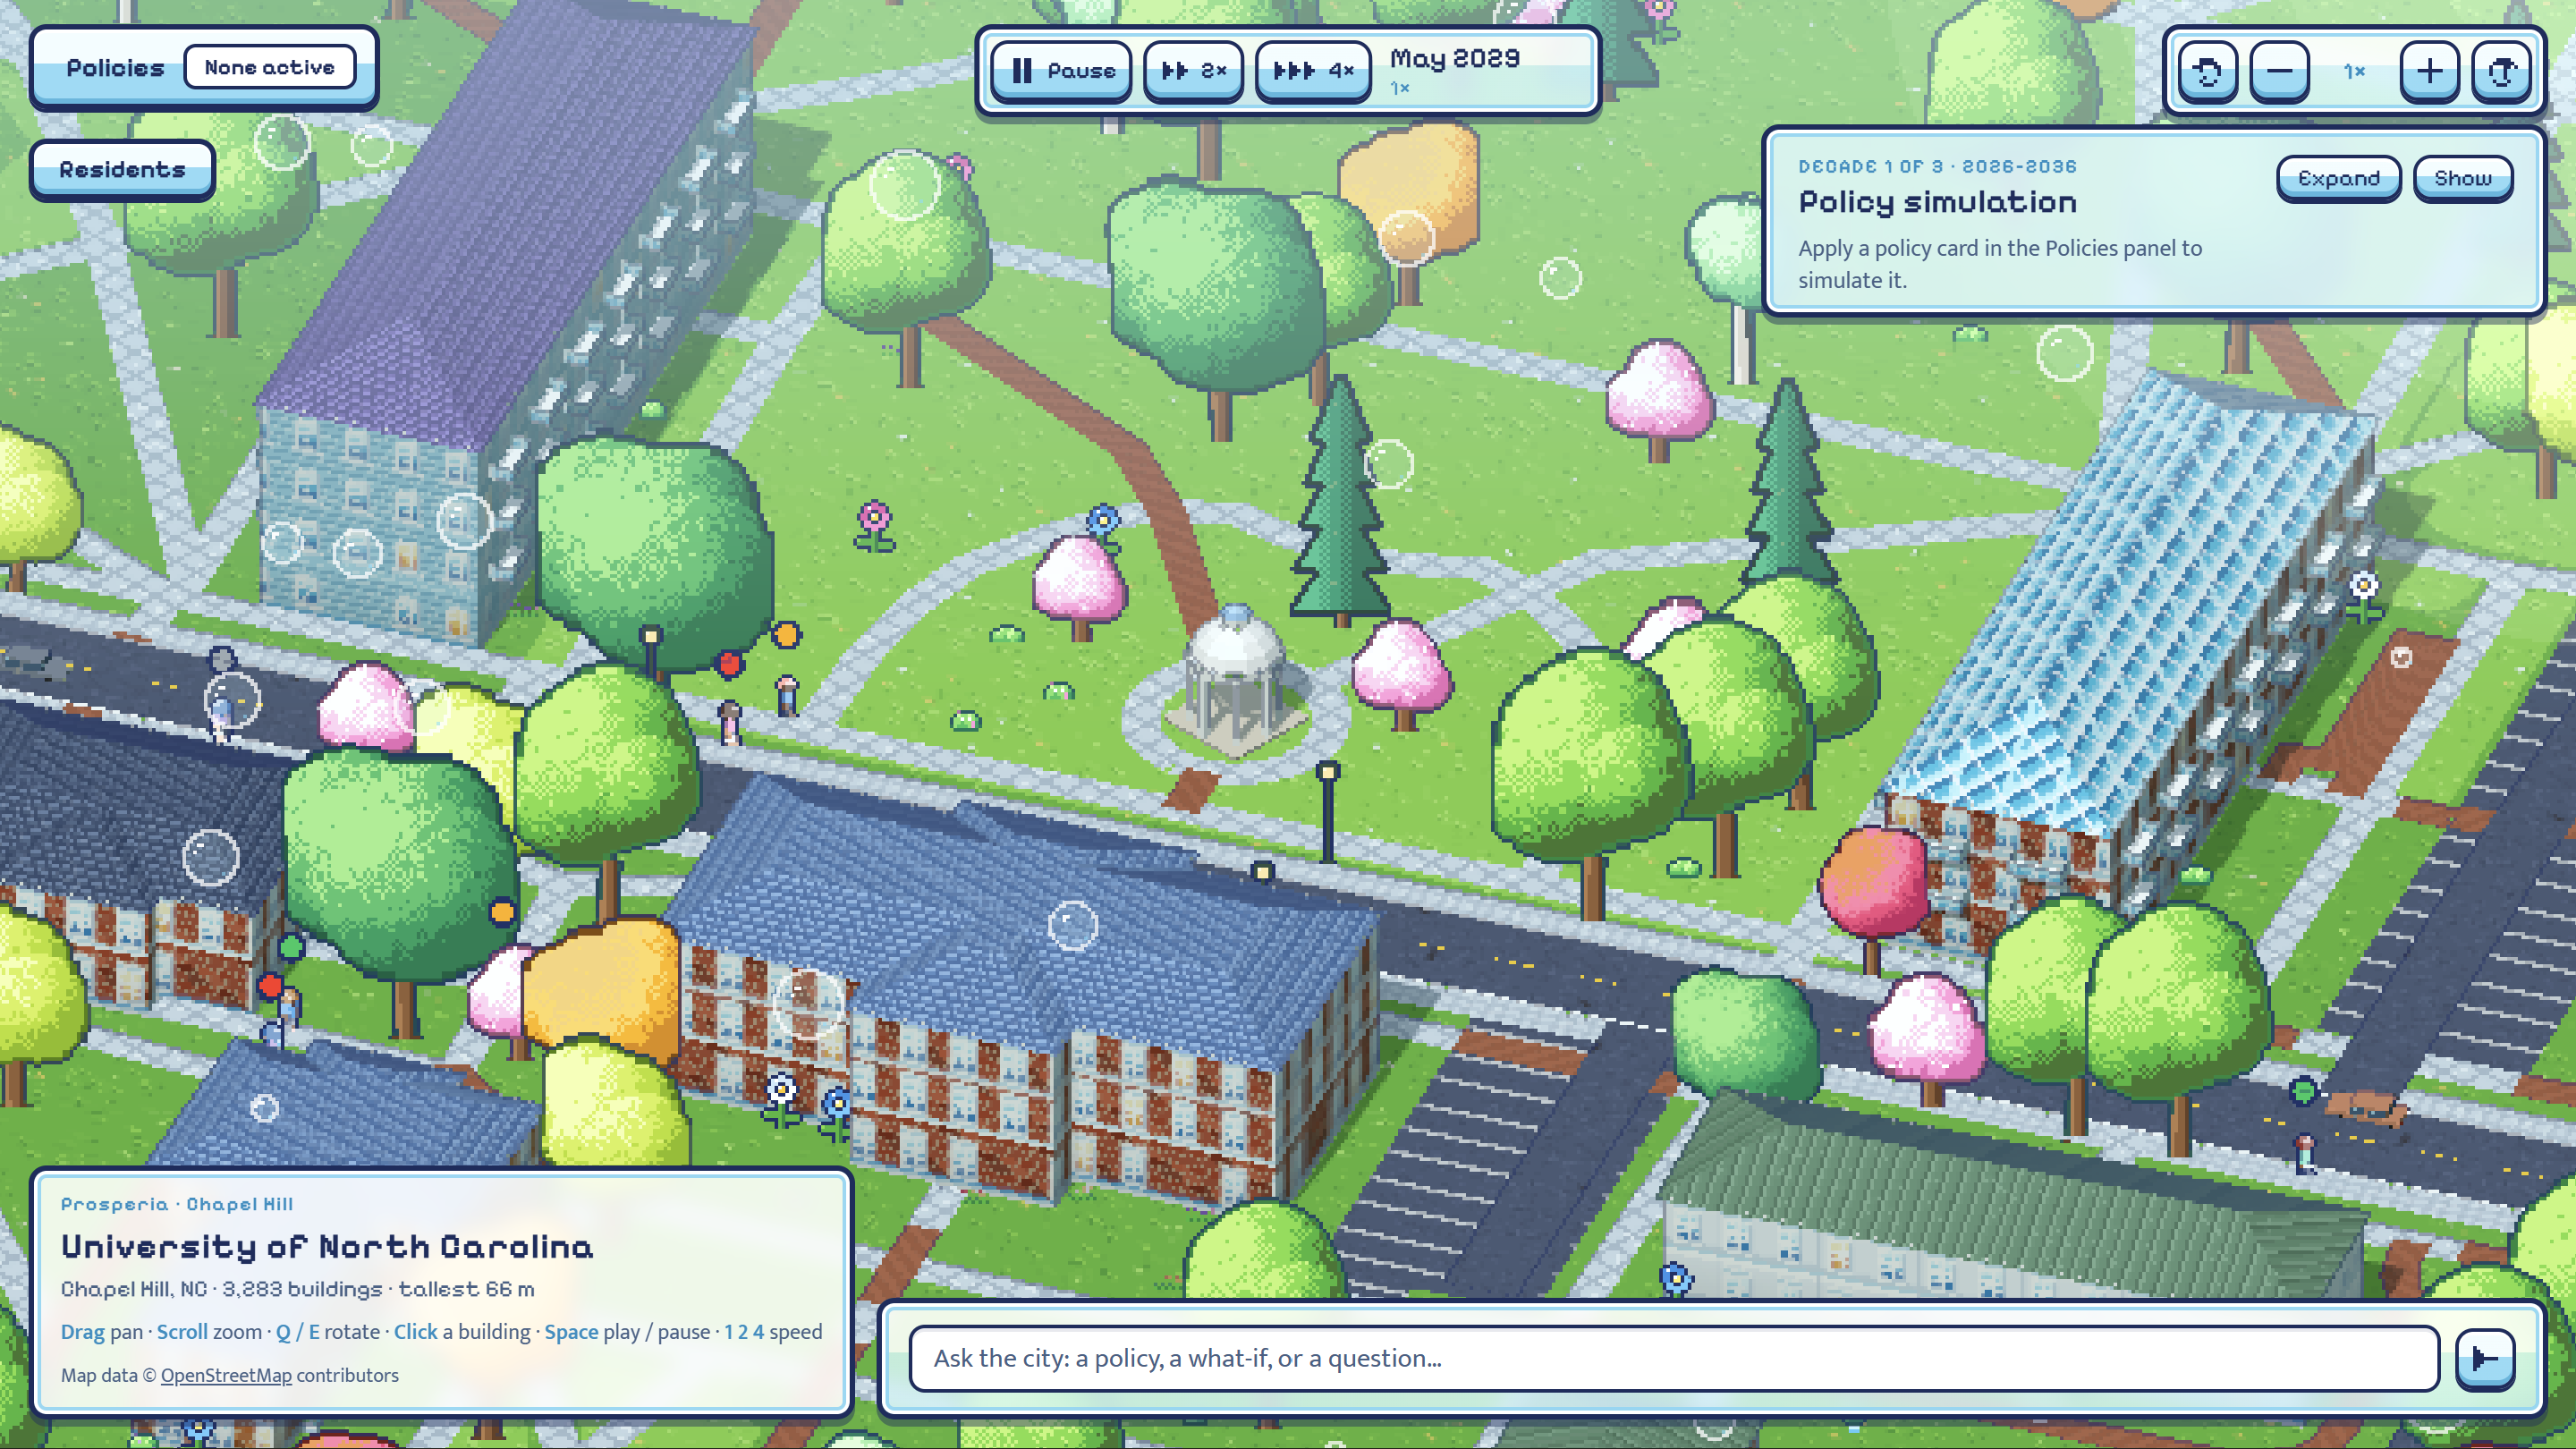
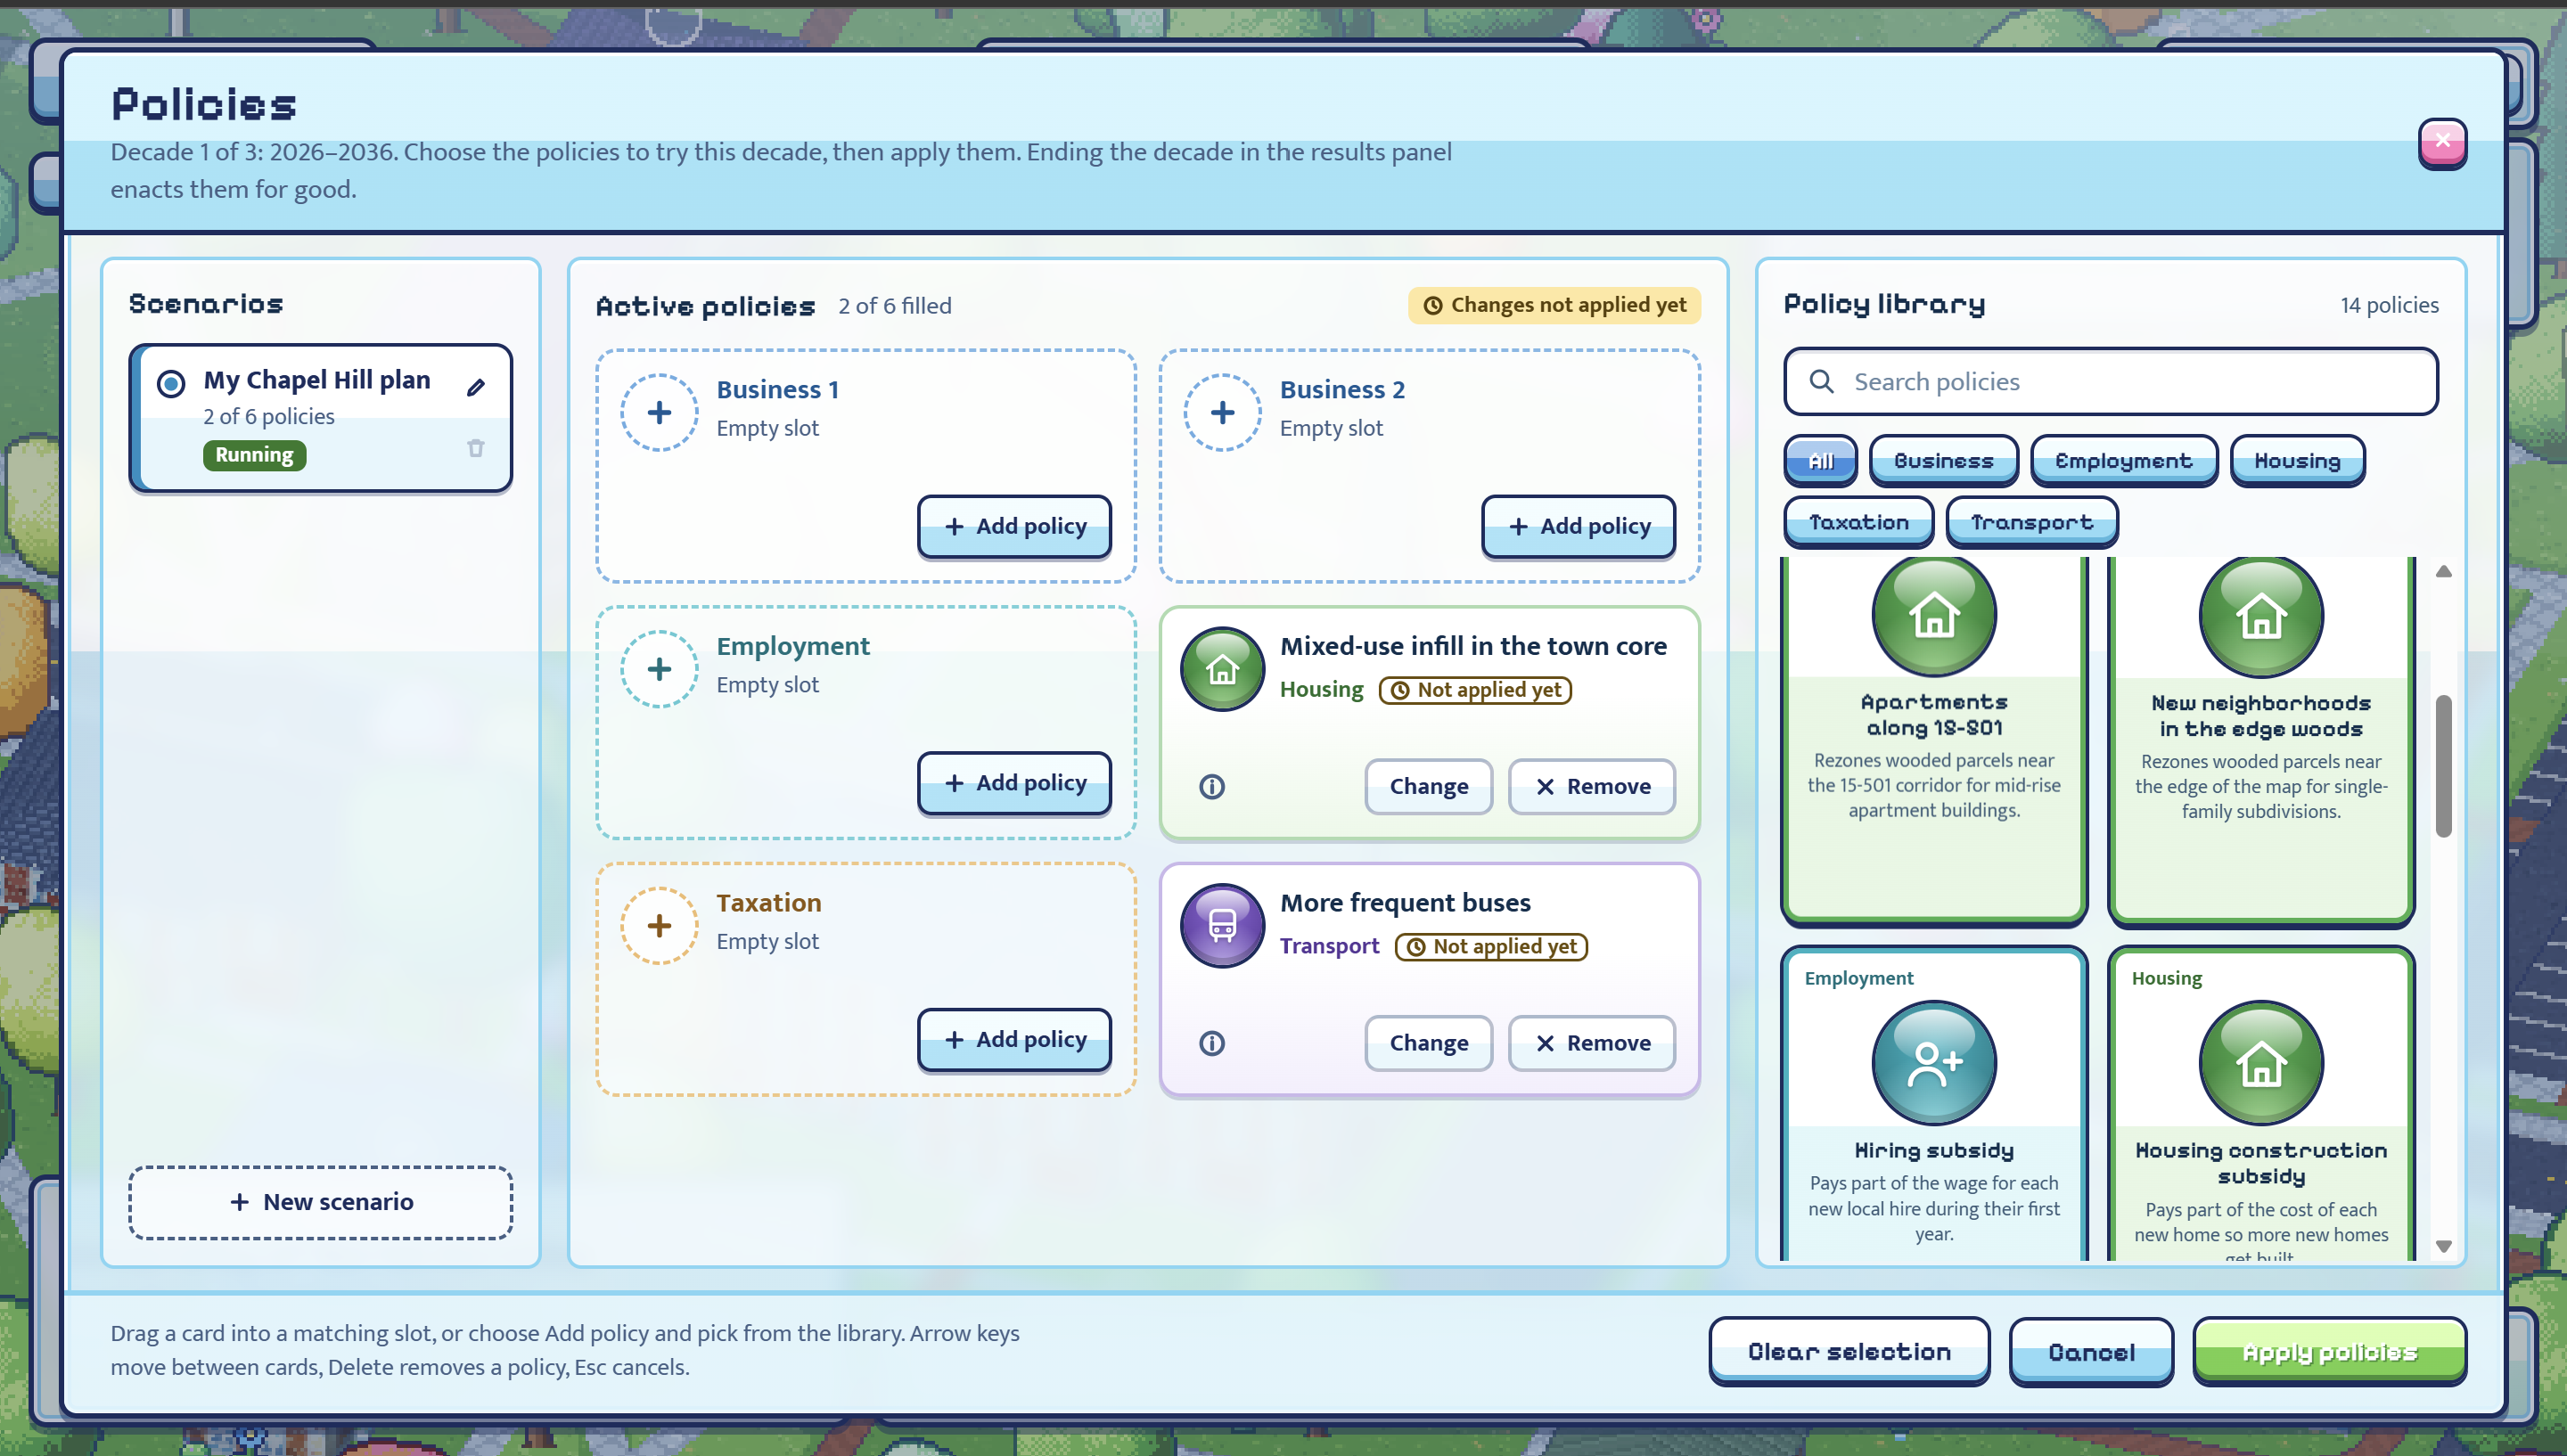
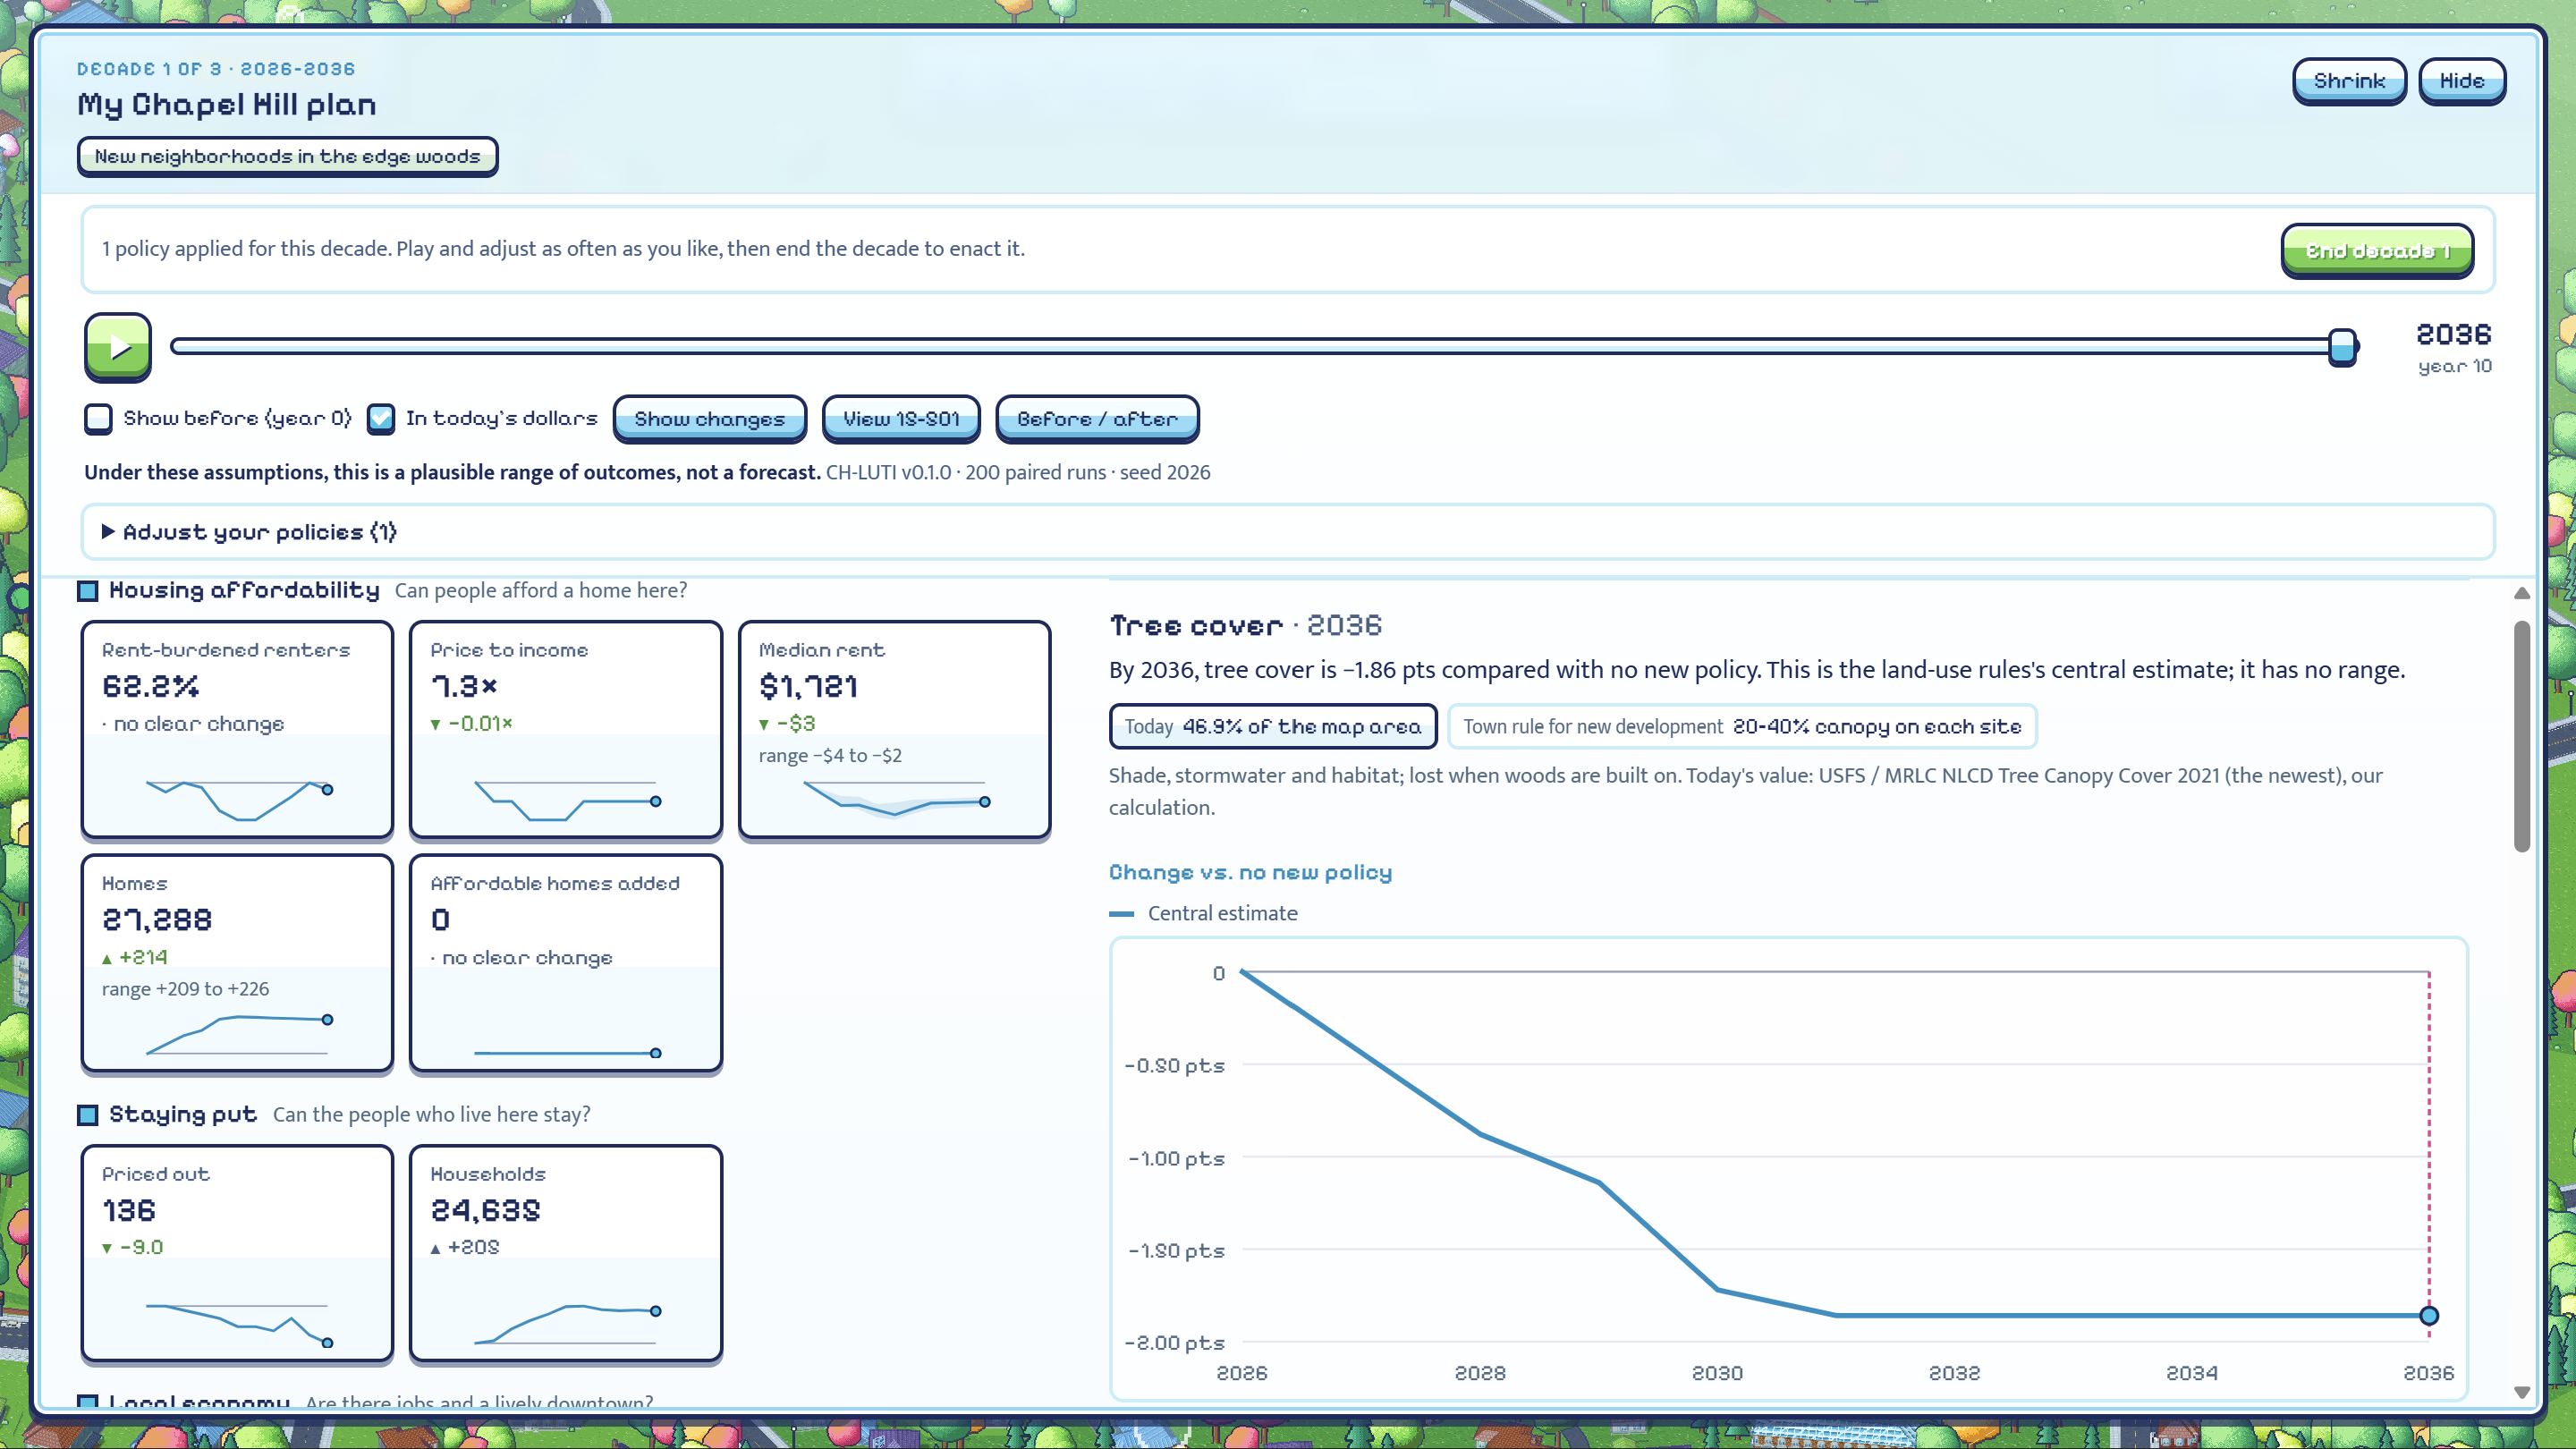
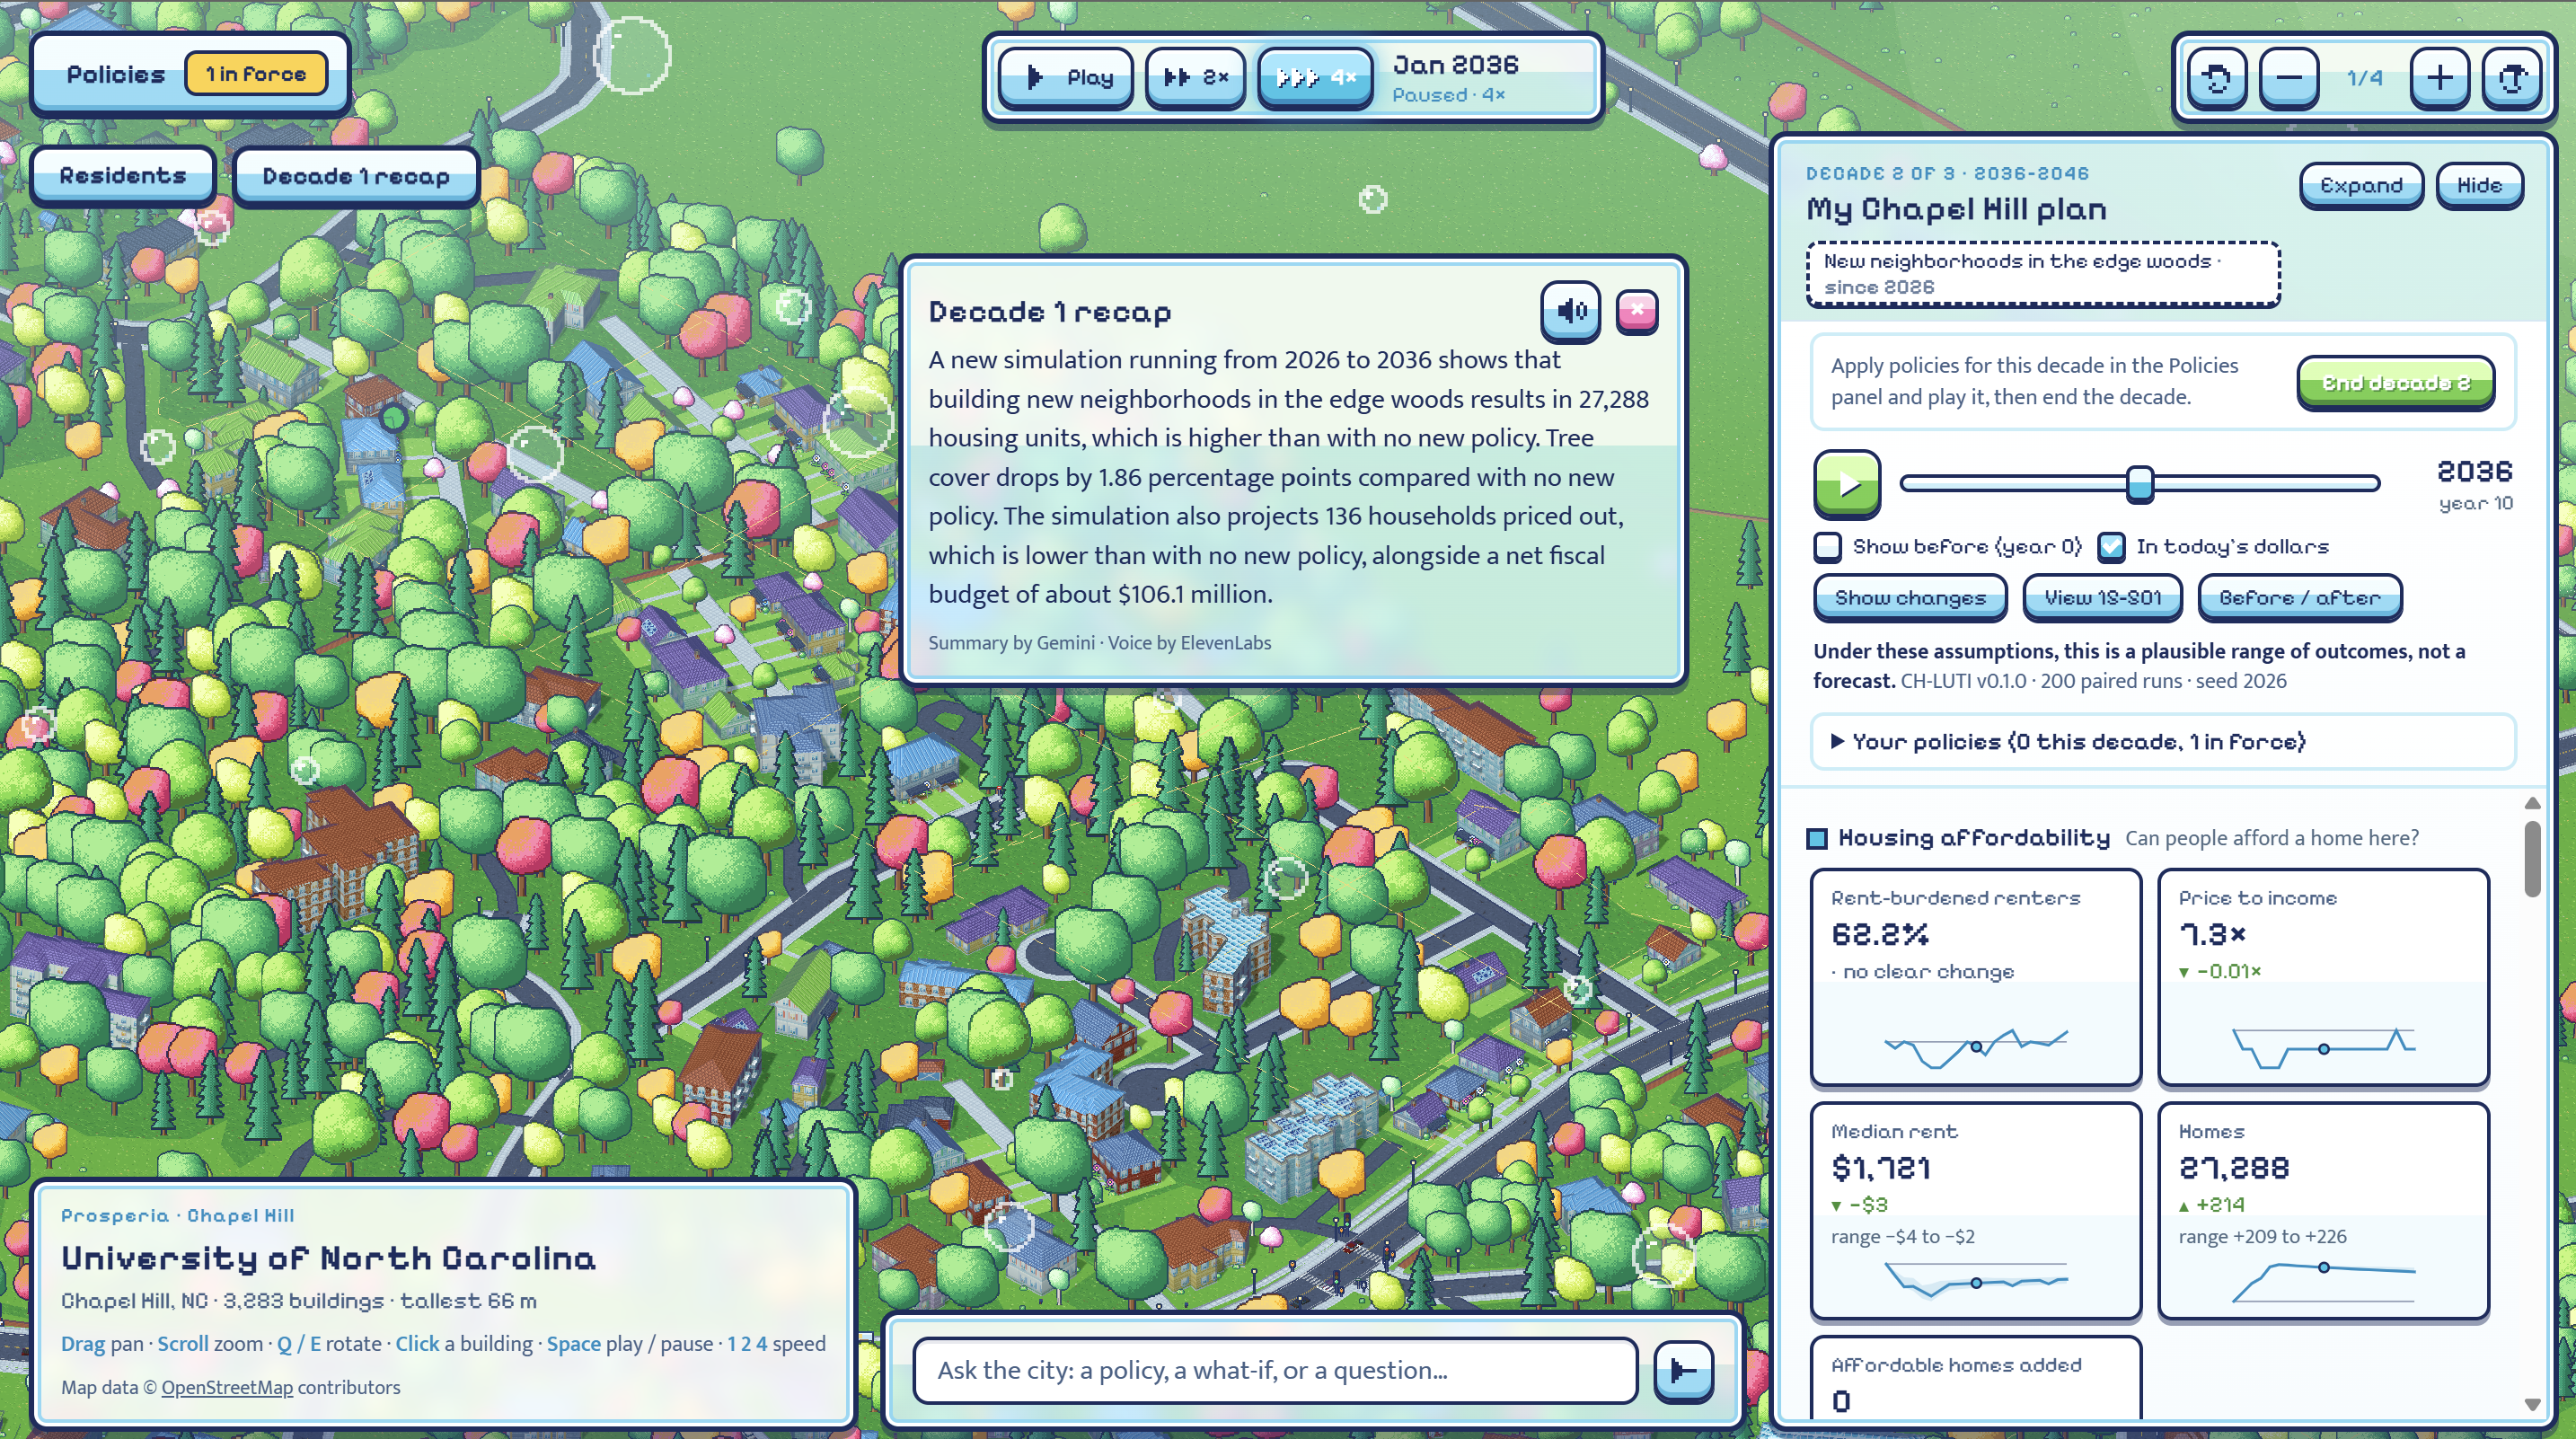
Prosperia transforms economic, environmental, and social policy into an interactive and engaging city simulation. Users can select existing policies currently being implemented in Chapel Hill or propose new policies of their own for the city. They can then implement them and advance time to see how their decisions shape the city. From median rent and job growth to traffic congestion and tree cover, the simulation uses historical, economic, and social data to track key indicators across different aspects of suburban and urban life, making the effects of policy choices more tangible, accessible, and understandable. For an in-depth look at how it affects individuals, players can highlight and chat to residents to discover how new policies are impacting their livelihoods.
By comparing outcomes against the town’s baseline conditions, users can see how individual policies (as well as combinations of policies) change the city's trajectory over three decades. They can explore unintended consequences, weigh competing priorities, and discover how decisions that benefit one area may create challenges in another. Over the course of three simulated decades of experimentation and feedback, Prosperia helps users build an intuitive understanding of policy trade-offs and explore ways to promote sustainable, equitable, and long-term growth.
How we built it
Prosperia is a browser-first JavaScript app deployed on Vercel. It pairs a Three.js pixel-art city with a deterministic simulation engine running in a Web Worker, plus serverless functions for the AI features. A Python data pipeline feeds it real Chapel Hill data.
The City (Three.js + OpenStreetMap)
- Rendered an isometric pixel-art Chapel Hill in Three.js from baked OpenStreetMap data
- Simulated street life (cars, pedestrians, cyclists and traffic signals) on our own lane and walkway graphs.
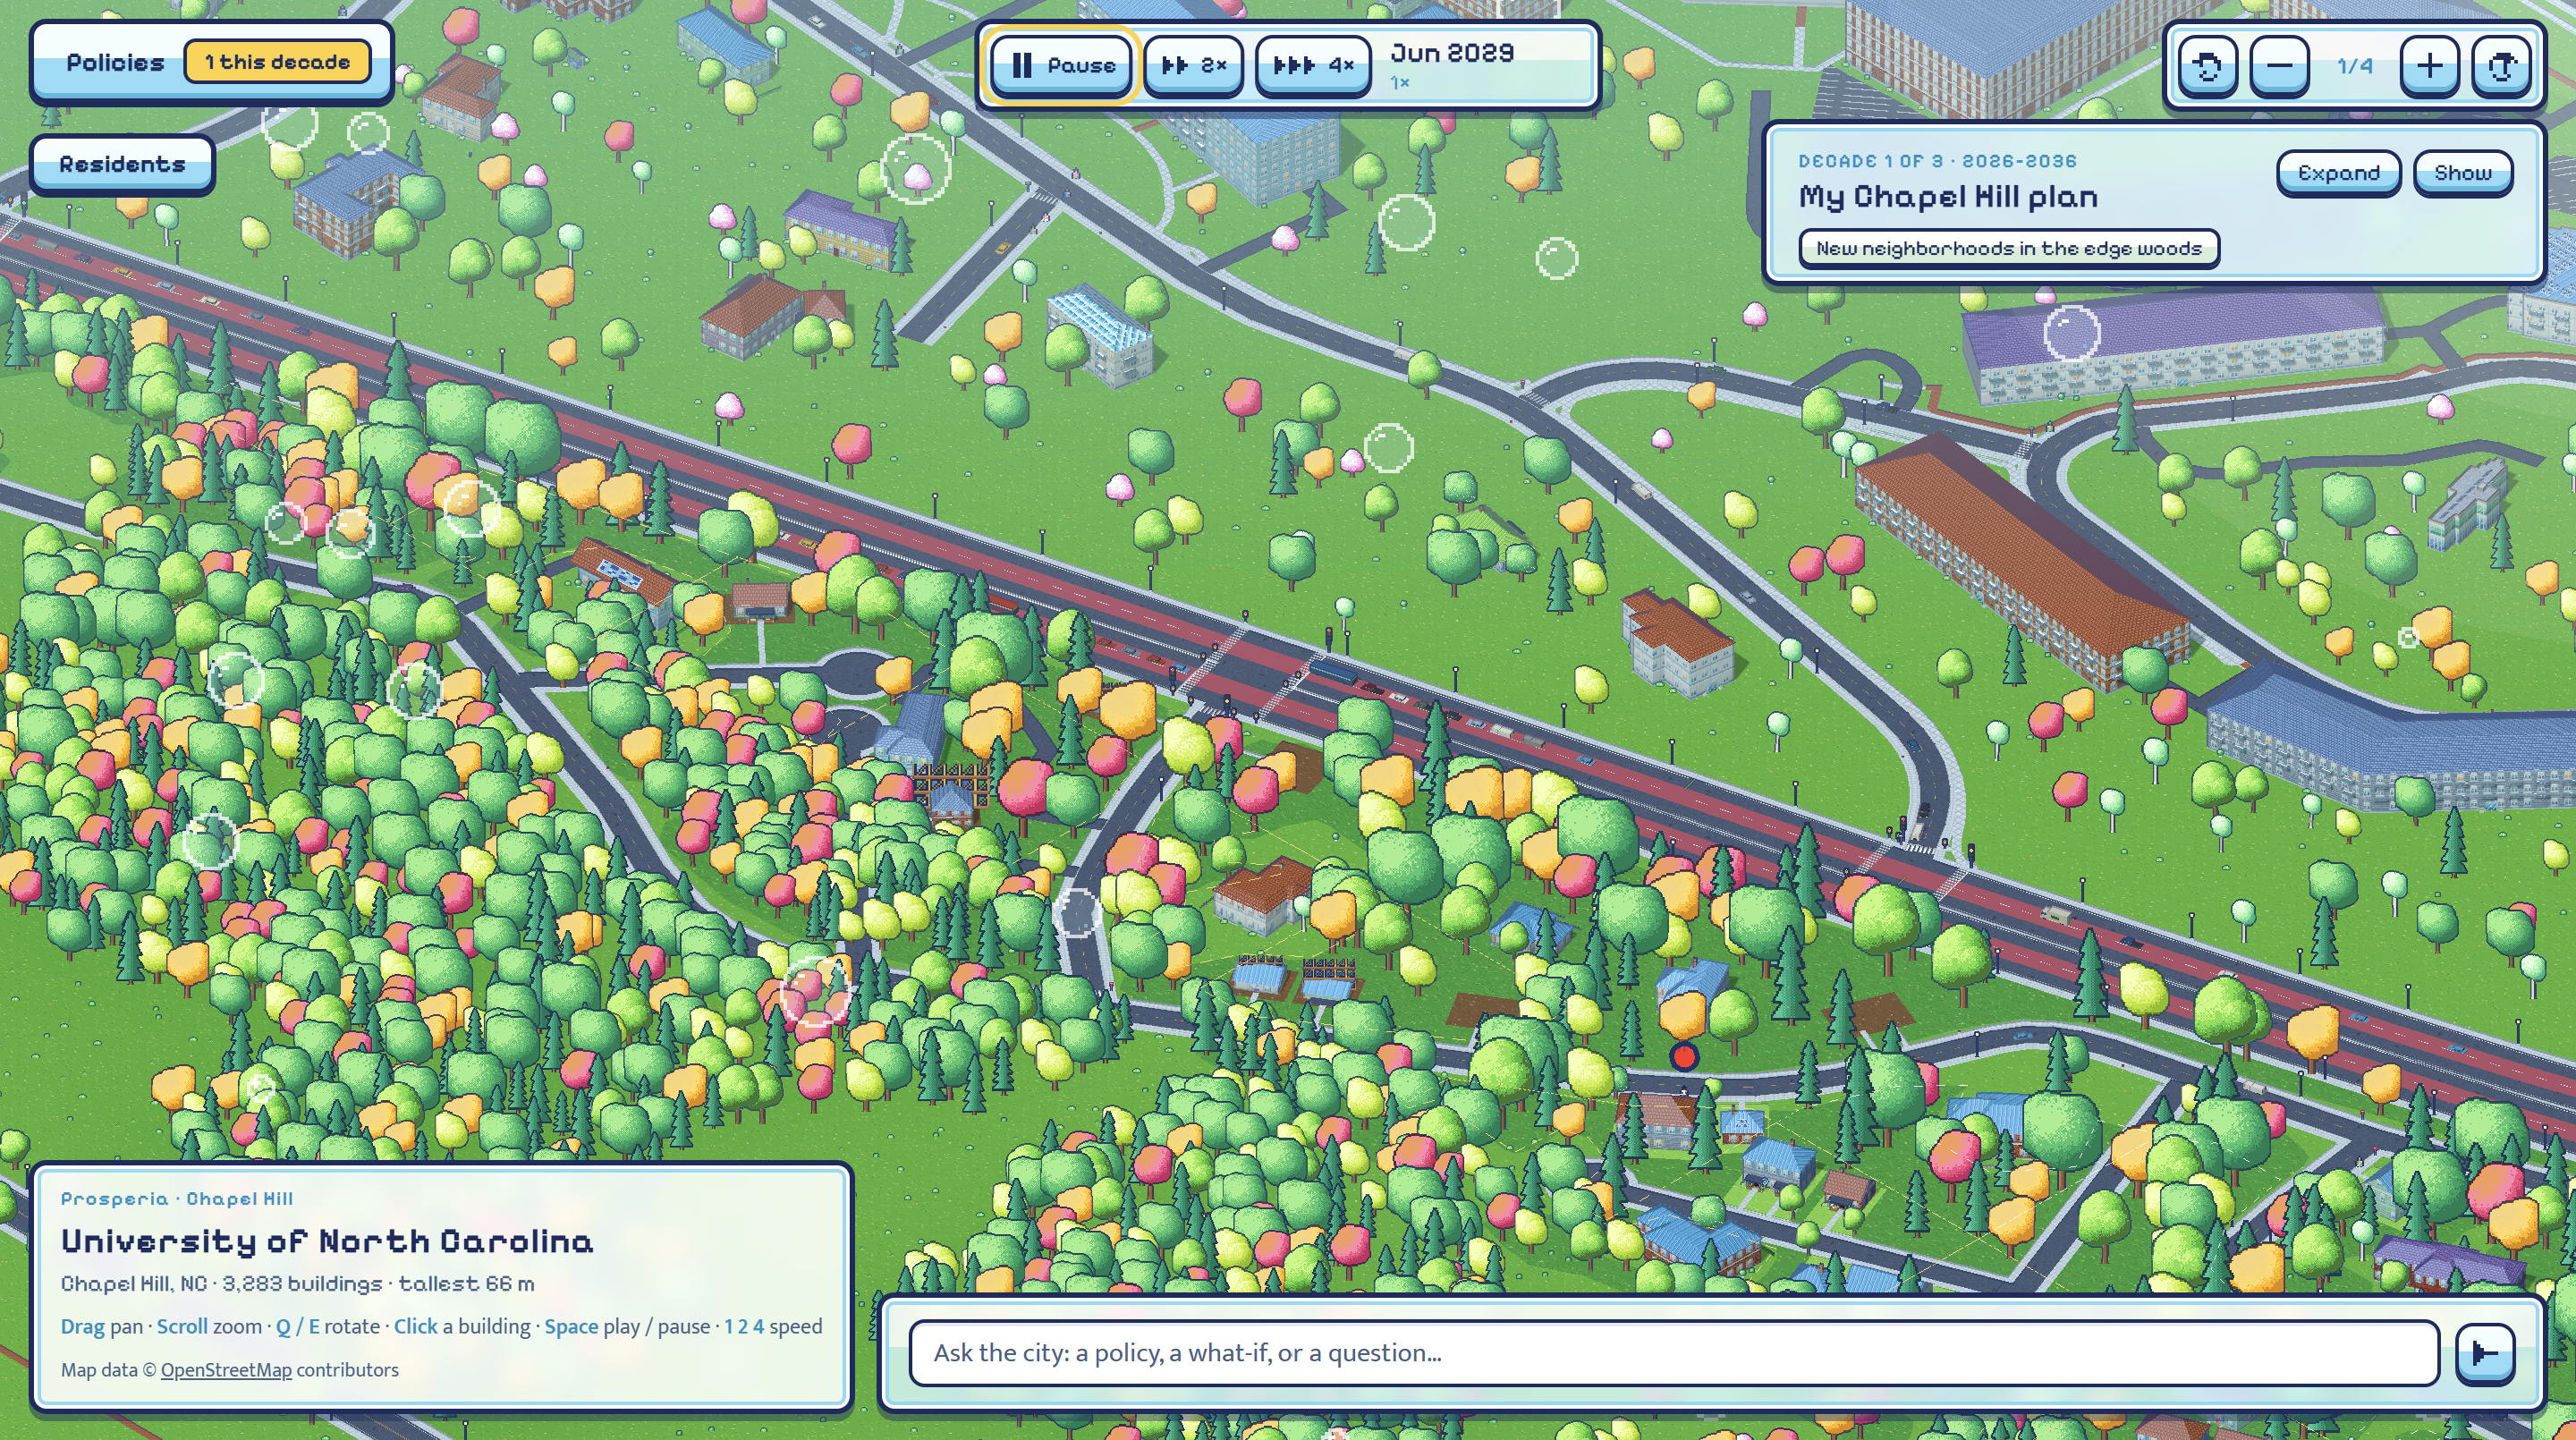
- Built a procedural neighbourhood planner. When a policy rezones a parcel, it lays out new streets, lots and building types, clears trees, then animates construction from grading to scaffolding to landscaping.
The Simulation Engine
- Land-use model converts parcels according to each policy's zoning rules and tracks tree canopy loss.
- CH-LUTI is our Chapel Hill Land-Use/Transport Interaction model, a quarterly system-dynamics model. It has five zones and six linked submodels: travel, location, development, businesses, jobs and the Town budget.
- Household model with 300 simulated households whose rents and commutes follow CH-LUTI's.
Data Pipeline (Python, pandas, NumPy, FastAPI)
- Ingested and checksum-verified ACS 2020–2024, LEHD LODES commuting flows (2009–2023, 396 tracts across five counties), TIGER geography, the Census Building Permits Survey, the FTA National Transit Database and NLCD tree canopy.
- Computed bus frequencies from Chapel Hill Transit's GTFS schedules and pulled fiscal numbers from the Town's FY2026–27 adopted budget.
Policy Cards
- Defined each policy as a JSON card with sliders, zoning rules, economic levers, timing and cited evidence.
- Required every card to list both pros and cons, written in neutral language, so Prosperia shows trade-offs instead of making recommendations.
AI Layer (Gemini, ElevenLabs, Capital One Nessie)
- "Ask the City": Gemini classifies free text as a new policy, a slider adjustment, a what-if scenario or a refusal. Drafted policies are validated, capped at what a real town could plausibly do, budget-checked and HMAC-signed.
- Narration: Gemini writes a news-style recap of each decade, and ElevenLabs reads it aloud.
- Resident chat: residents answer in character, in their own voice, using only their simulated finances. Any reply containing a number the simulation didn't produce is rejected.
- Banking: each showcase resident's paycheck, rent and savings are kept as a real ledger in Capital One's Nessie API.
Challenges we ran into
Hallucination Prevention: When drafting a new policy, using Gemini to control the entire process may lead to incorrect downstream figures and effects. Thus, we had to figure out a way to implement Gemini in a way that it never sets a number, allowing the simulator to compute everything. Every drafted policy gets validated, capped at what a real town could plausibly do, and refused if it is outside of realistic boundaries.
Predictive Modeling: One of our biggest challenges was deciding how to model the effects of different policies on the city’s metrics. We had to weigh the efficacy of using traditional statistical models vs. machine learning models on our historical data to produce accurate predictions.
Art Style: We initially struggled to capture the competition’s Frutiger Aero aesthetic while maintaining a cohesive and intuitive user interface. Implementing the style’s glossy visuals, vibrant colors, and futuristic feel into our simulator required experimentation with different visual elements and layouts.
Accomplishments that we're proud of
Realistic Forecasting: We built a real land-use/transport model from scratch instead of a game with made-up multipliers. CH-LUTI links travel, housing, development, businesses, jobs and the Town budget across five zones and runs 200 Monte Carlo draws per forecast. It starts from Chapel Hill's actual numbers (23,581 homes, $1,613 median rent, 54,322 jobs, a 50¢ tax rate), based on recently published sources.
Policy You Can See: Rezoning a parcel builds a neighbourhood right on the map, street by street and house by house. Other policies show up on the street too: shops reopening, “Now Hiring” signs, new bike lanes, buses at stops. Each development or change in the map traces back to the policy that caused it.
Impacted Residents: You can click a resident, ask how a policy changed their life, and hear the answer in their own voice. They answer from their own simulated paycheck, rent, commute and savings, which are recorded as a real bank ledger.
What we learned
Data vs. Communication: Communicating exactly what is happening in a simulation is as important as getting the numbers right. Data only becomes useful if the user can understand what changes it corresponds to, what they’re comparing, and why it matters for the community.
Public Data is Messy: The Town’s budget export had every column shifted one place to the right. The permit data had dates sitting in the “type of work” column. LODES files thousands of UNC jobs at a Raleigh headquarters, which makes it look like 72% of residents work outside town when the ACS says 45%.
Let AI interpret and Let Code Compute: LLMs are great at understanding what a person means and terrible at being a source of truth. Thus, we allowed AI to interpret the specifics of a general policy proposal, and we allowed the numbers to carry the burden of seeing how it impacts the community.
What's next for Prosperia
We envision Prosperia growing into a platform that helps communities everywhere explore the potential impacts of policy decisions. In the short term, we hope to refine our simulation by incorporating a wider range of cities, adding more historical data, improving the accuracy of our predictive models, and expanding the range of policies users can implement. We also want to make it easier for users to compare different policy combinations and understand the long-term trade-offs between economic growth, environmental sustainability, and social equity.
Ultimately, our goal is to make Prosperia a tool connecting civic education and real-world policymaking. By allowing people to experiment with policies in a simulated environment, we hope to encourage more informed conversations about their communities' futures and empower residents to engage more meaningfully with the decisions that shape their lives.
After all, the future of a city is shaped by the choices we make today.
Built With
- elevenlabs
- gemini
- html
- javascript
- nessie
- node.js
- python


Log in or sign up for Devpost to join the conversation.