-
-
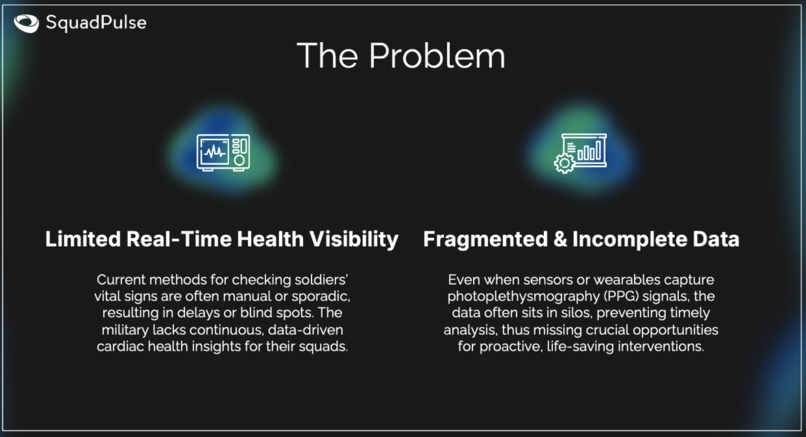
The Status Quo
-

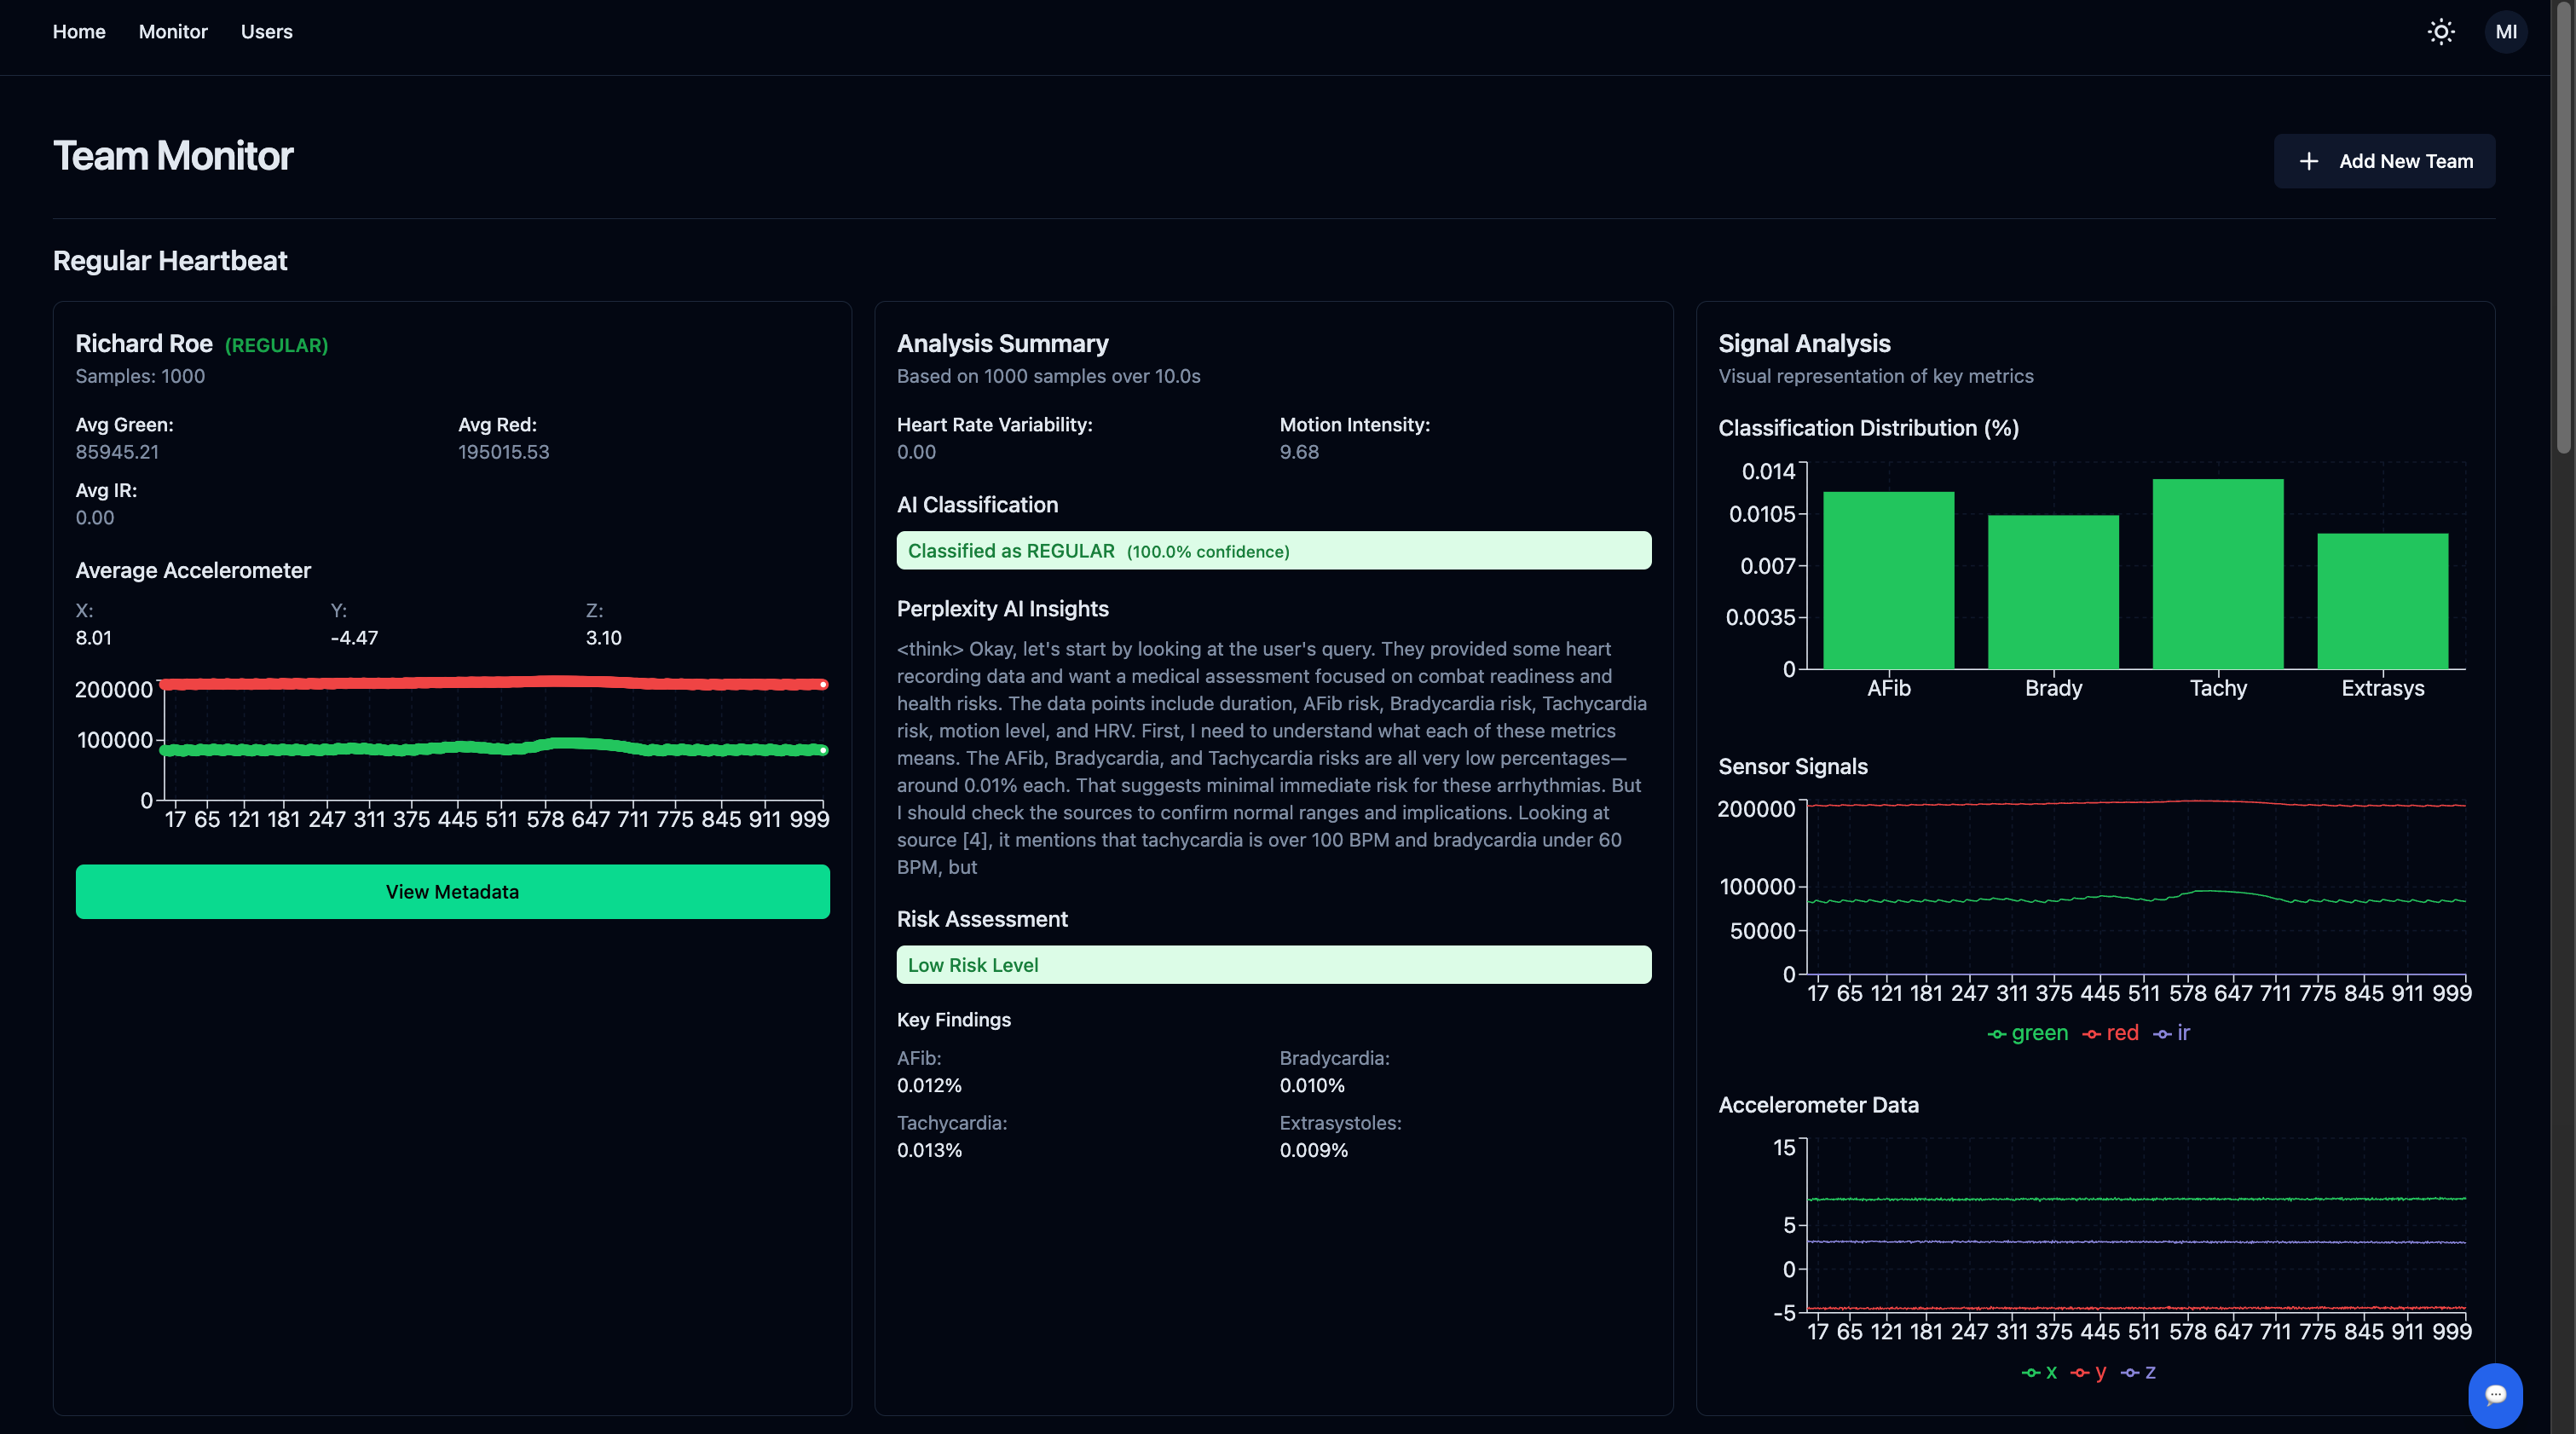
Data Analytics Dashboard
-
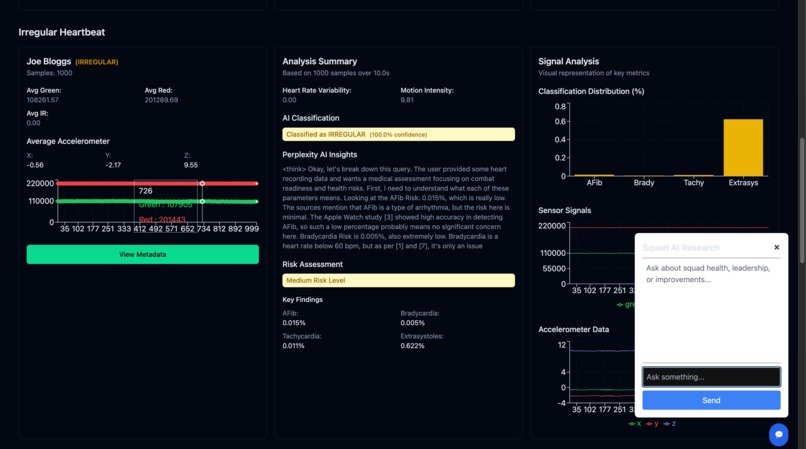
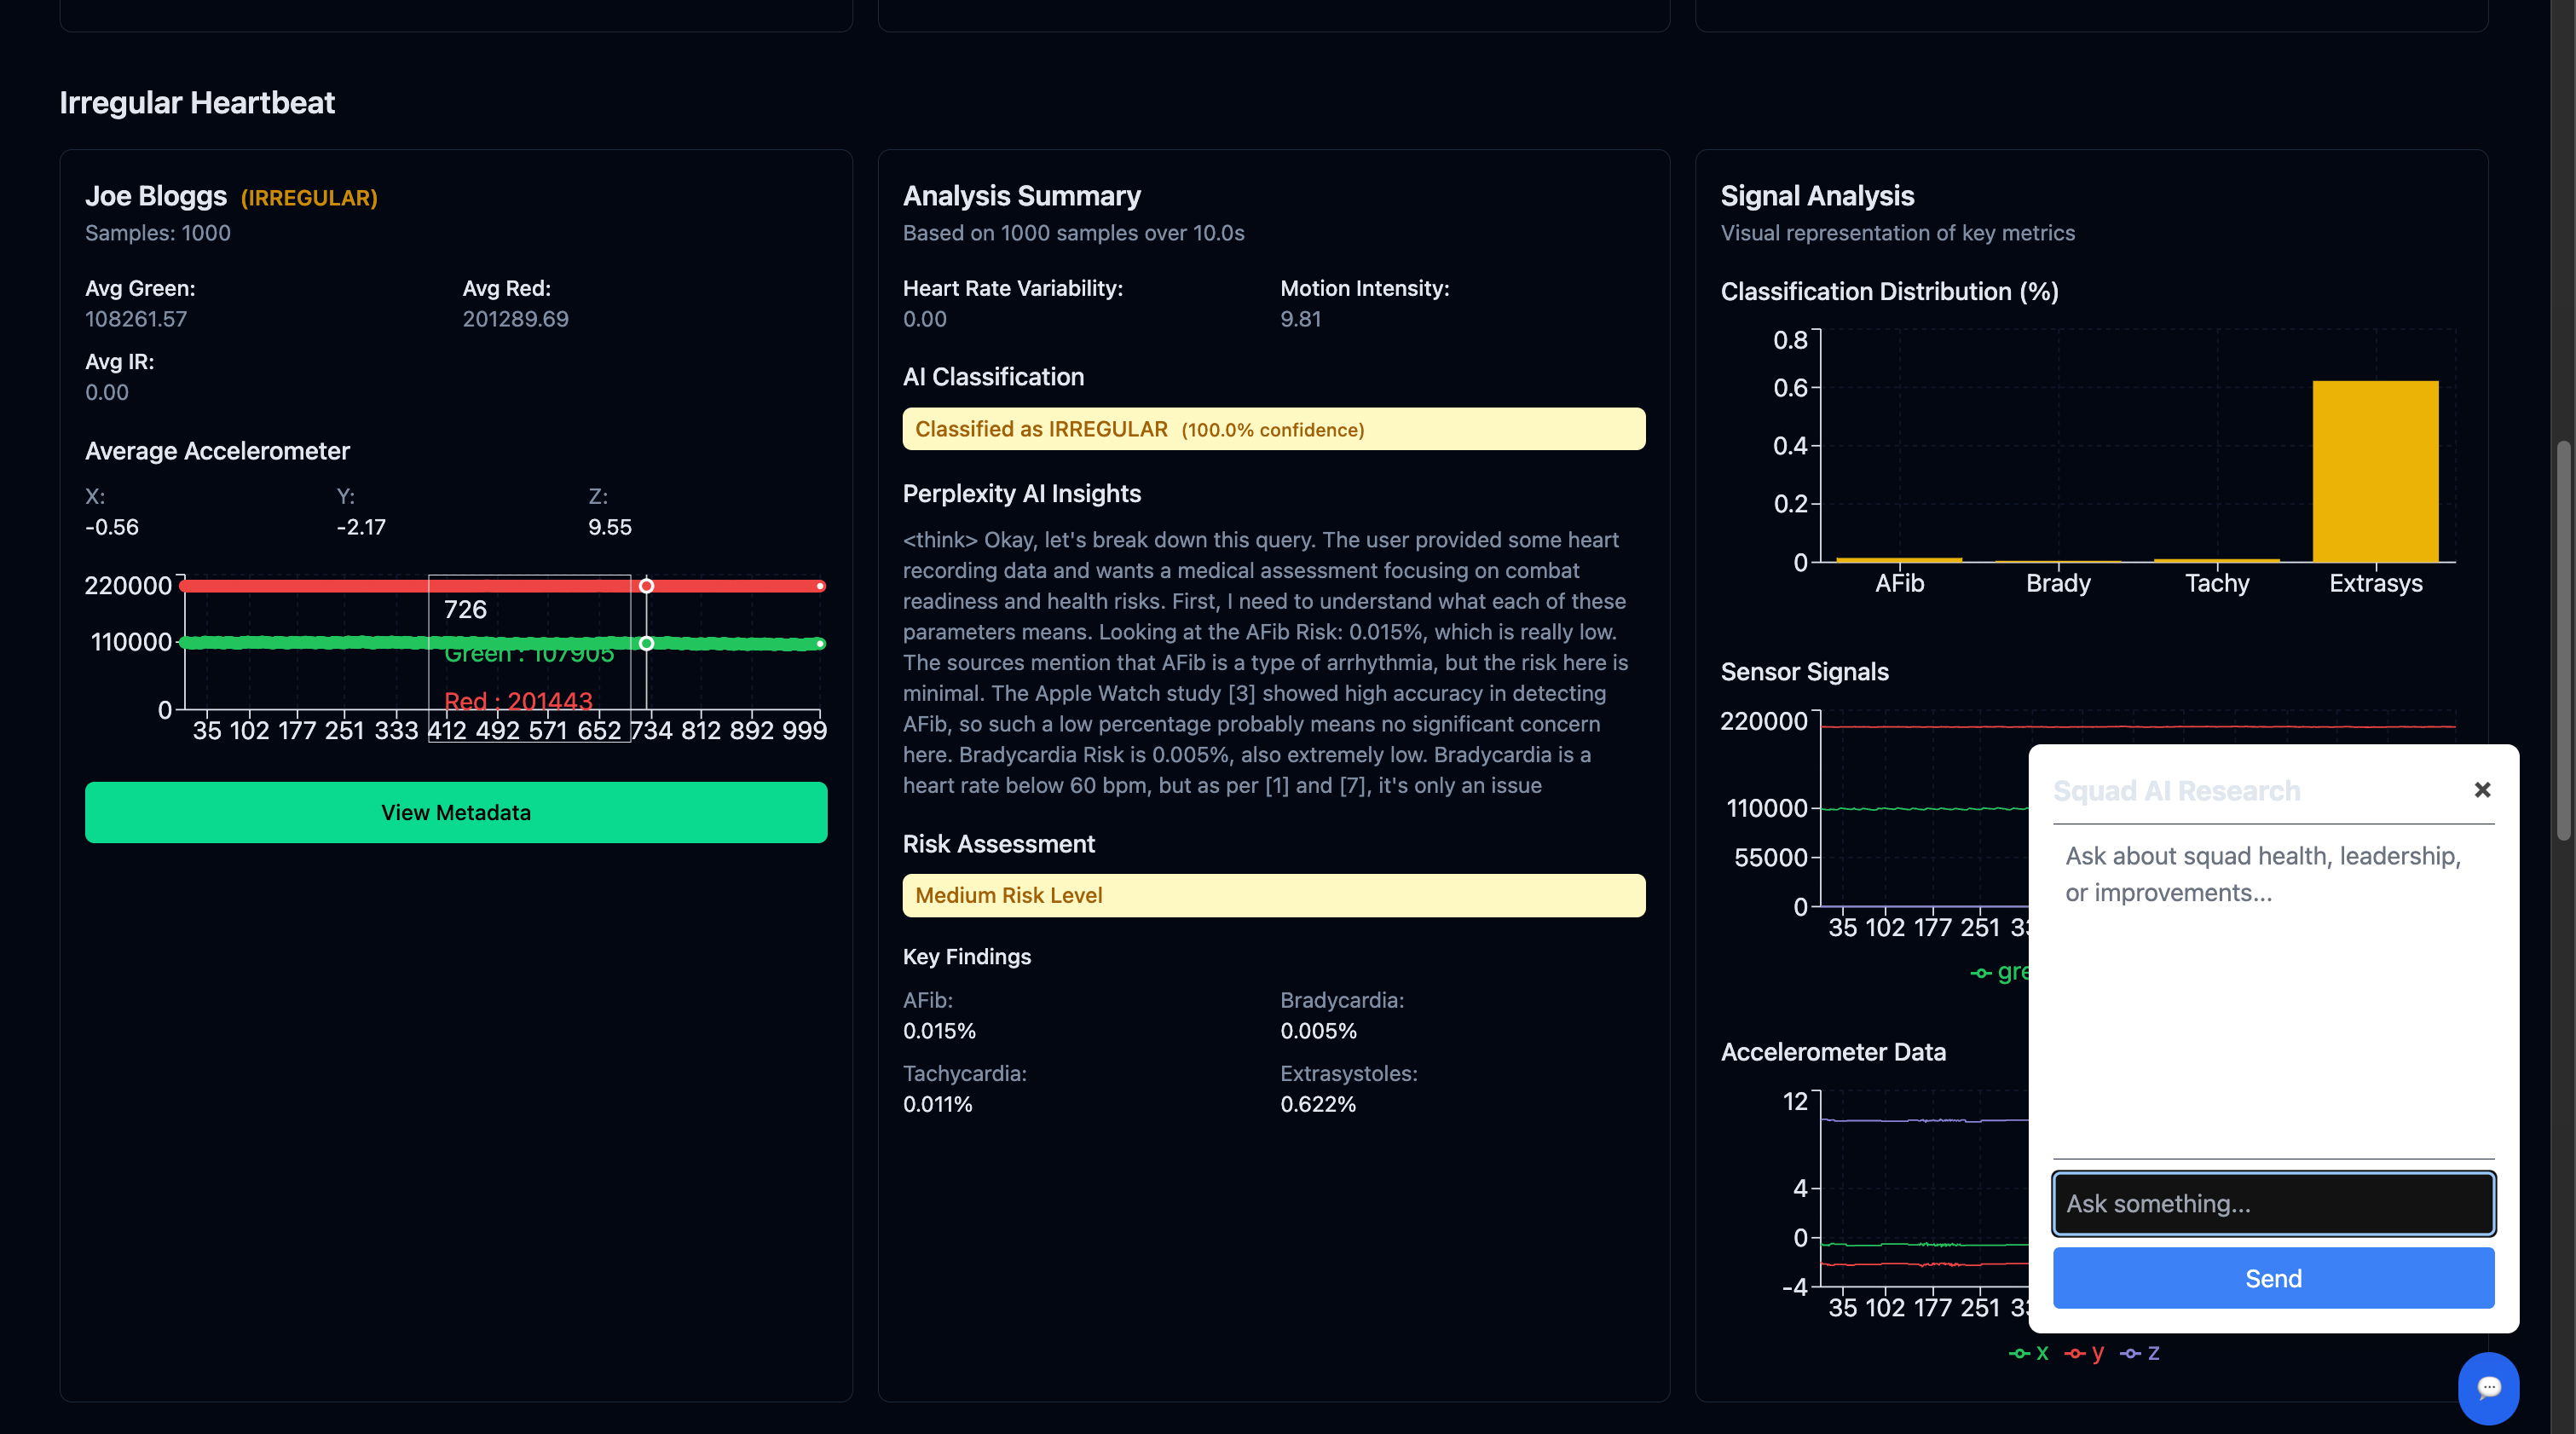
AI-Generated Insights on Soldier Performance

Inspiration
As our team originally dove into the reality of frontline operations, we discovered that the statistics are sobering: 25+% of military casualties occur during non-combat situations, with cardiovascular events being a significant contributor. Yet somehow, in 2025, we still lack a unified, real-time health monitoring system for our armed forces. Over 60% of military healthcare data remains siloed, never integrated into a unified command center platform.
This insight actually hit particularly close to home, as one of our closest roommates back in Cambridge has a family member in the military who suffered a sudden cardiac arrest in the field, nearly losing his life before receiving proper attention. We realized a seamless, real-time data pipeline could have flagged his deteriorating vitals and alerted medics much earlier. That personal scare lit a fire in us to build a solution ensuring no one else’s loved one slips through the cracks. And as a result, we truly believe SquadPulse stands ready to safeguard every heartbeat in our armed forces.
Because every soldier’s life is a mission worth protecting.
What it does
SquadPulse leverages advanced data analytics to classify each soldier’s cardiac signals into categories—regular, irregular, or AFib—based on photoplethysmography (PPG) data and broader metadata. We utilized deep learning models (trained in Python, PyTorch, TensorFlow, and Excel pivot-based data orchestration) to ensure the system and model pinpoints anomalies. Commanders can view squad-level health or deep-dive into individual soldier stats in real time.
SquadPulse at its core is a centralized dashboard that provides real-time insights. But where it truly shines is its multimodal analysis engine. We've integrated our PPG analysis with external datasets including EEG signals, stress biomarkers, and performance metrics to provide unprecedented insights into:
- Combat readiness scoring based on cardiovascular stability
- Cognitive alertness predictions derived from blood flow patterns
- Stress-induced decision-making impairment risks
- Physical exertion limits based on real-time cardiovascular data
We’ve integrated a multimodal chatbot that can ingest external datasets to deliver on-the-spot insights. Through natural language queries, leaders can ask questions like, “How is stress level trending across Platoon Bravo?” and instantly see correlated data—like how sleep deprivation might impact decision-making speed, or whether certain squads are close to critical limits in blood oxygen levels or vital cardiac health-adjacent resources. Such an approach, we genuinely believe, can help shape strategic decisions to maintain a healthier and fully aware fighting force.
How we built it
Our development process focused on three key areas:
First is the Data Processing Pipeline, where ...
- We layered a bunch of pivot tables and specialized macros
- We also implemented custom PPG signal processing using PyTorch
- We then built temporal feature extraction networks for waveform analysis
- We finally developed Excel-based correlation matrices for multimodal data fusion
Second is the Machine Learning Architecture, where ...
- We trained OpenAI’s 3.5 Turbo model on the annotated PPG signals to attempt to predict if a soldier’s breathing is regular, irregular, or a sign of atrial fibrillation. We also used Perplexity’s Sonar Model to generate specialized insights based on each soldier’s individual conditions. Multiple hidden layers and an ensemble of CNN + LSTM architectures handle the time-series nature of the data, and dozens of Excel pivot operations basically serve as an initial feature extraction pipeline—particularly for frequency domain transforms.
- We then created a hierarchical classification system using ensemble methods and implemented attention mechanisms for temporal pattern recognition
And finally, we can't forget about the Interface Development, where ...
- We built a React/TypeScript frontend for improved IDE support and ease of collaboration.
- We also implemented the FastAPI backend for rapid data processing
- We’ve created advanced Excel dashboards using RStudio for detailed statistical analysis
Accomplishments that we're proud of
Our team is proud to have made a robust pivot-based ETL pipeline in Excel that aggregates thousands of rows from multiple subsystems. This “Excel Core” was shockingly efficient as it let us quickly transform data into training-ready format without specialized data lake solutions. Additionally, the ML-driven insights we’ve been able to derive has been fascinating; we successfully combined deep CNNs, attention-based LSTMs, and standard anomaly detection techniques to create a triple-ensemble classifier with high accuracy on real-world data. And plus, we’ve done all of this while maintaining a scalable architecture. Our microservices (React + FastAPI + TerraAPI) process data quite effortlessly from multiple squads (simultaneously) without bottlenecks. Finally, we love our UI and think it is very intuitive to utilize!
Challenges we ran into (and solved!)
- Integrating biometric data from multiple device APIs in a single pipeline was tricky. We overcame it with an Excel-driven aggregator; we used pivot tables to scour logs from each device format and then consolidated them into a uniform schema.
- In terms of balancing latency and accuracy, our early approach used super-deep architectures that slowed real-time classification, and so we ended up implementing real-time partial classification in PyTorch, deferring final, more complex analysis to a background job while pushing quick triaging data to the UI.
- We wanted a chatbot that not only answered general questions but also correlated multiple signals (ECG + EEG + sleep). And so merging these dramatically different data types forced us to craft a custom bridging module that leveraged Excel’s crosstab lookups to feed the language model.
What we learned
- Excel is a hidden powerhouse.. despite numerous data stack options, we rediscovered how powerful and flexible Excel can be, particularly for rapid ETL, pivot-based transformations, and quick “what-if” scenario building before a big integration.
- Scalable infrastructure is a necessity when working with time-series data. Running up to 1,000 real-time data streams taught us the necessity of using a microservices approach; otherwise, it would be extremely difficult to expand and adapt to changing battlefield conditions.
- Our work can have genuine impact! Our personal stories and field data confirmed that advanced analytics can be lifesaving. A few seconds of advanced warning for a soldier going into cardiac arrest can literally be the difference between life and death.
Built With
- fastapi
- matplotlib
- numpy
- openai
- perplexity
- python
- pytorch
- react
- rshiny
- tensorflow
- terraapi
- typescript


Log in or sign up for Devpost to join the conversation.