-
-
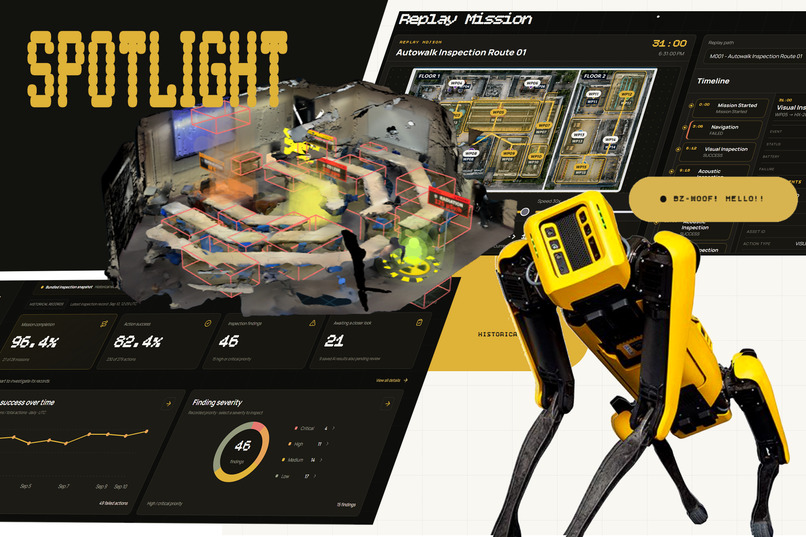
spotlight
-
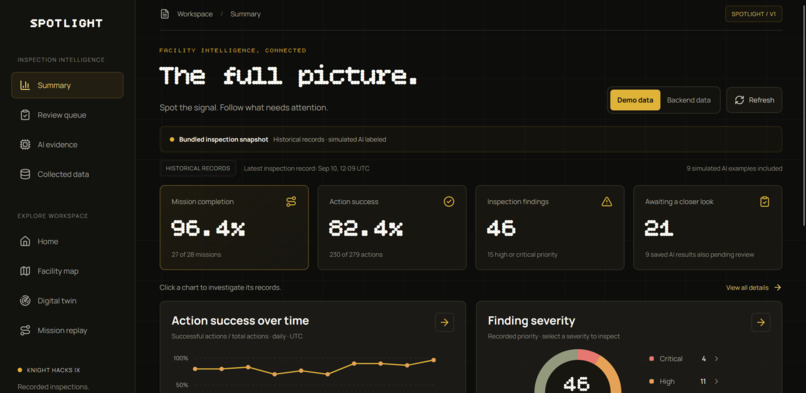
inspection summary
-
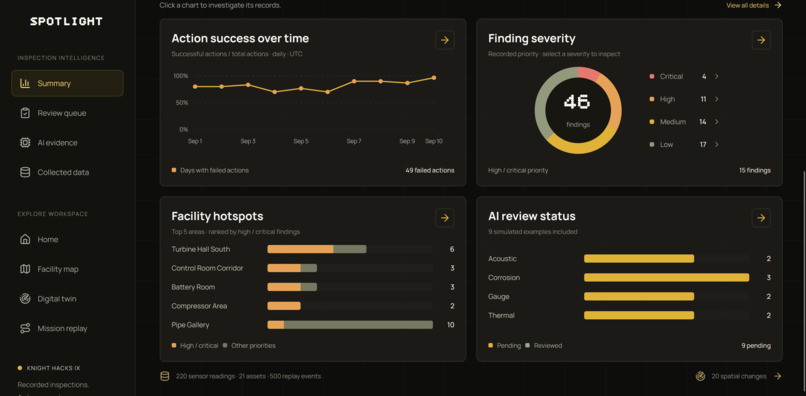
inspection summary
-
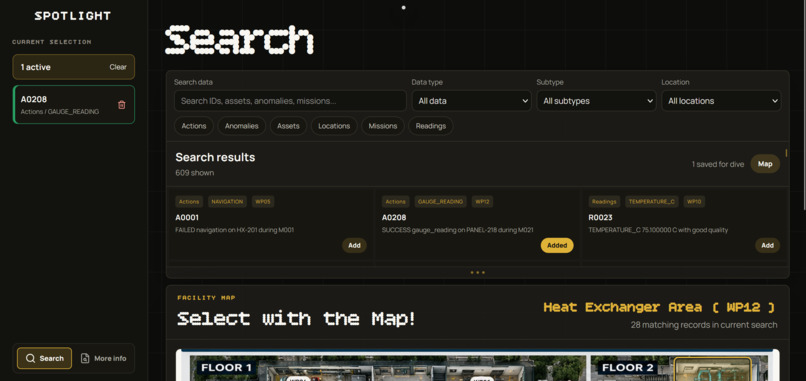
dataset exploration
-
interactive digital twin
-
dataset exploration
-
interactive LiDAR
-
LiDAR change detection
-
mission replay
Inspiration
(˶˃ ᵕ ˂˶) .ᐟ.ᐟ NextEra Energy’s SPOT Operational Intelligence Challenge asked us to turn robotic inspection data into something an operator could understand and act on. The challenge focused on connecting mission results, sensor readings, anomalies, and locations to help someone understand what happened and what needs attention.
We wanted to build Spotlight to bring those pieces together. Our goal was to make inspection data easier to explore and give operators a clearer understanding of the facility they are looking at.
What it does
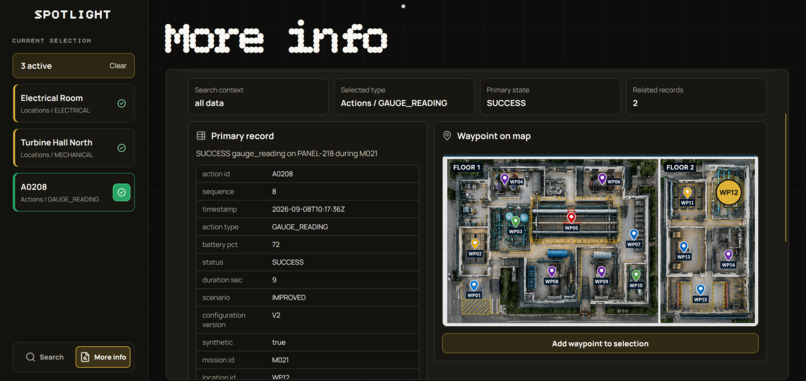
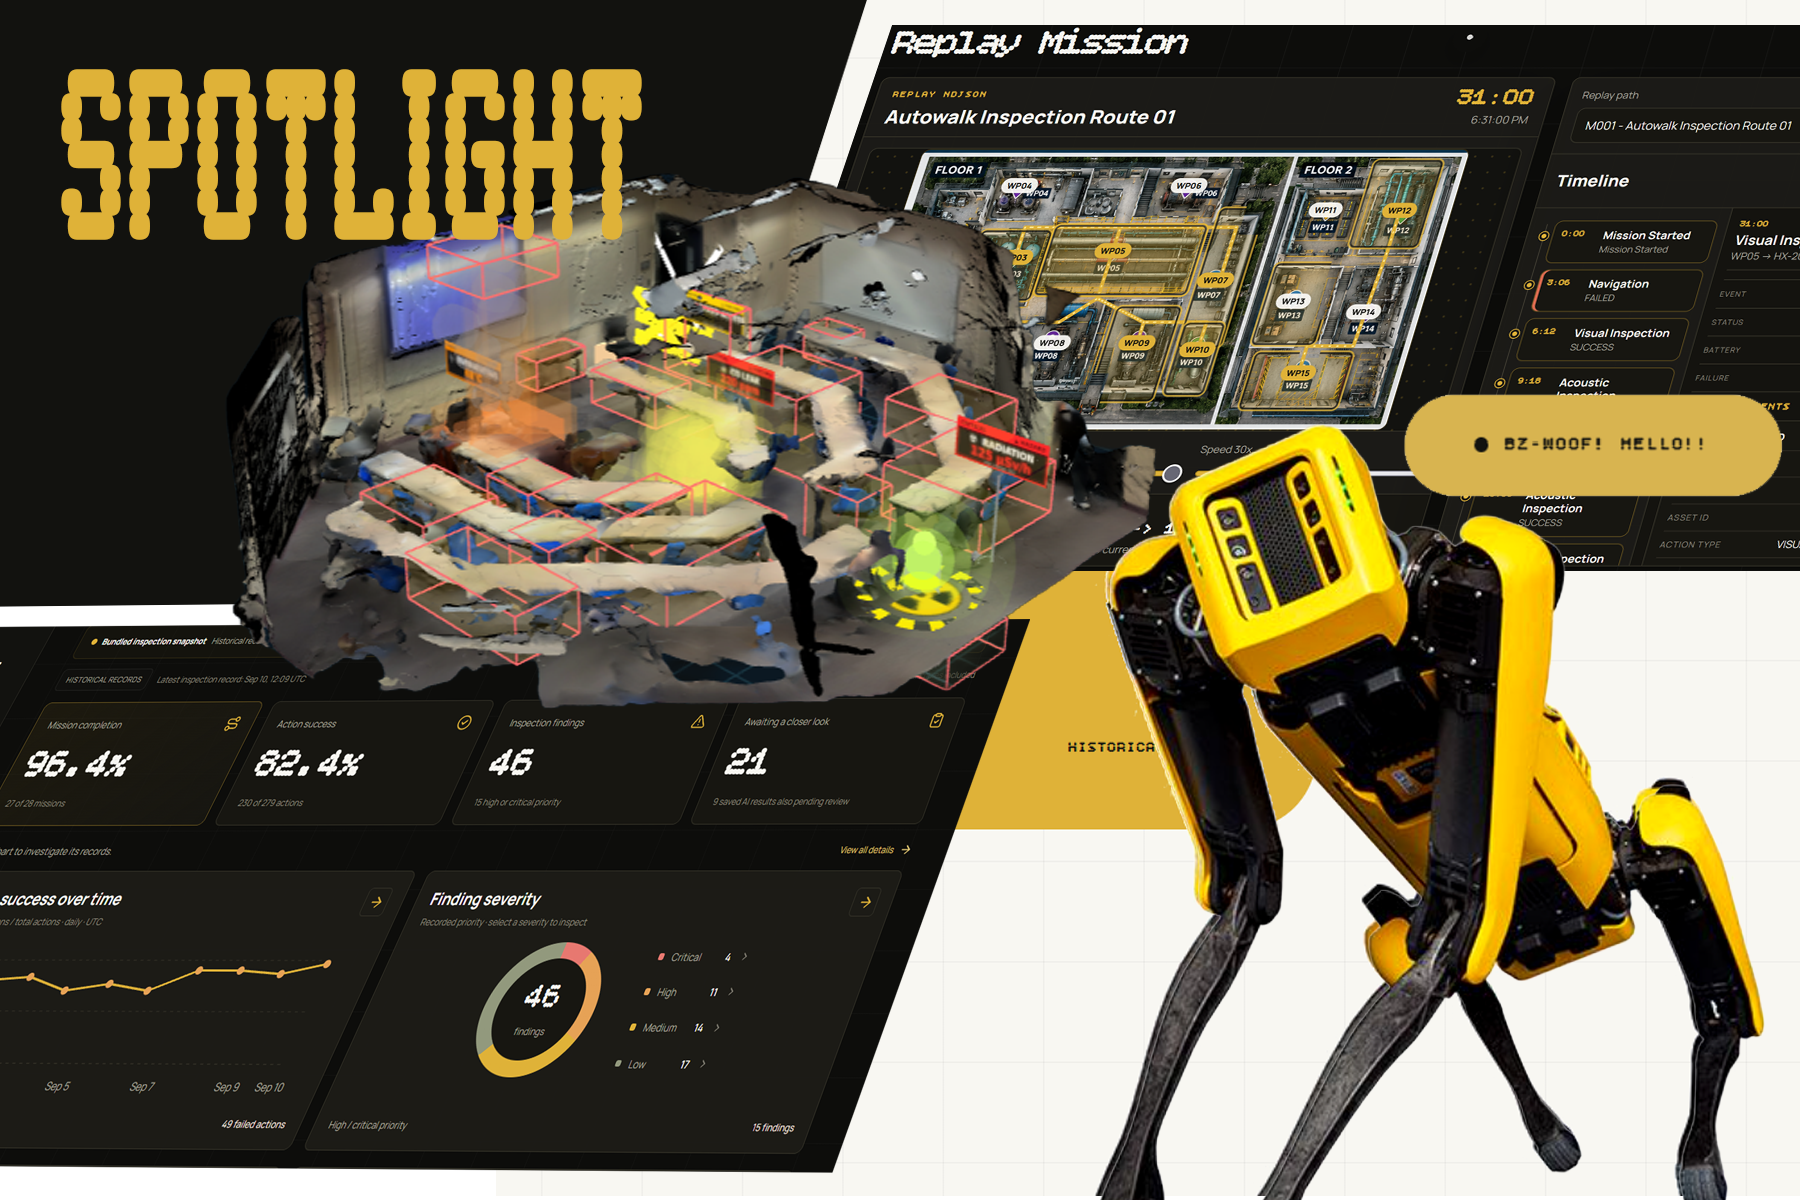
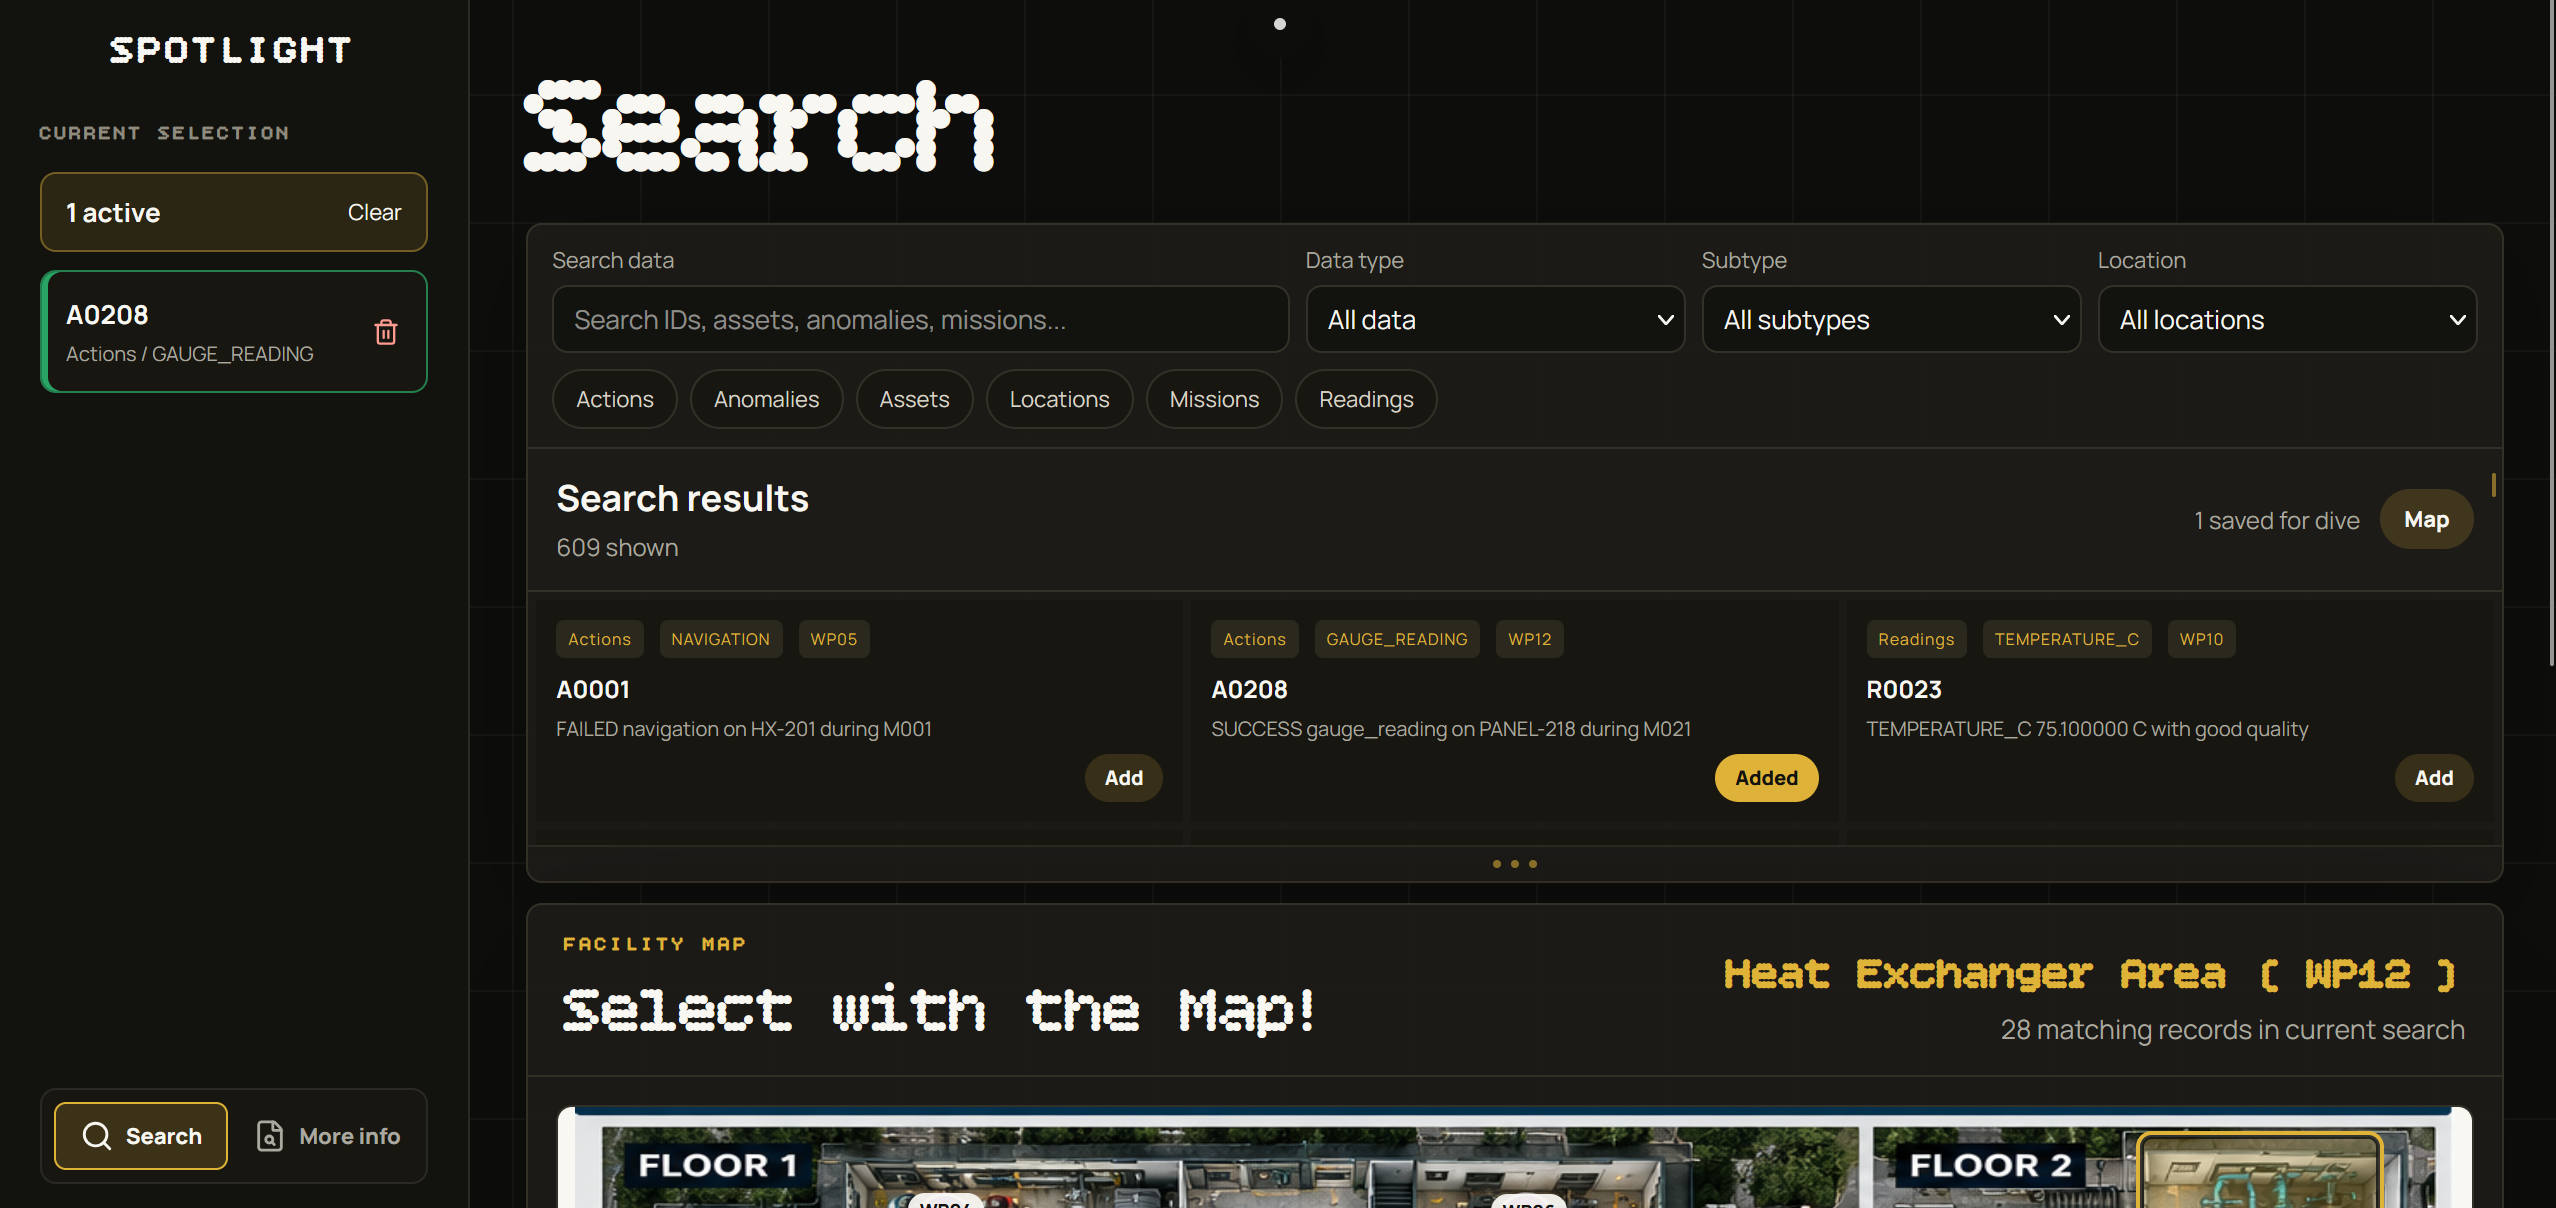
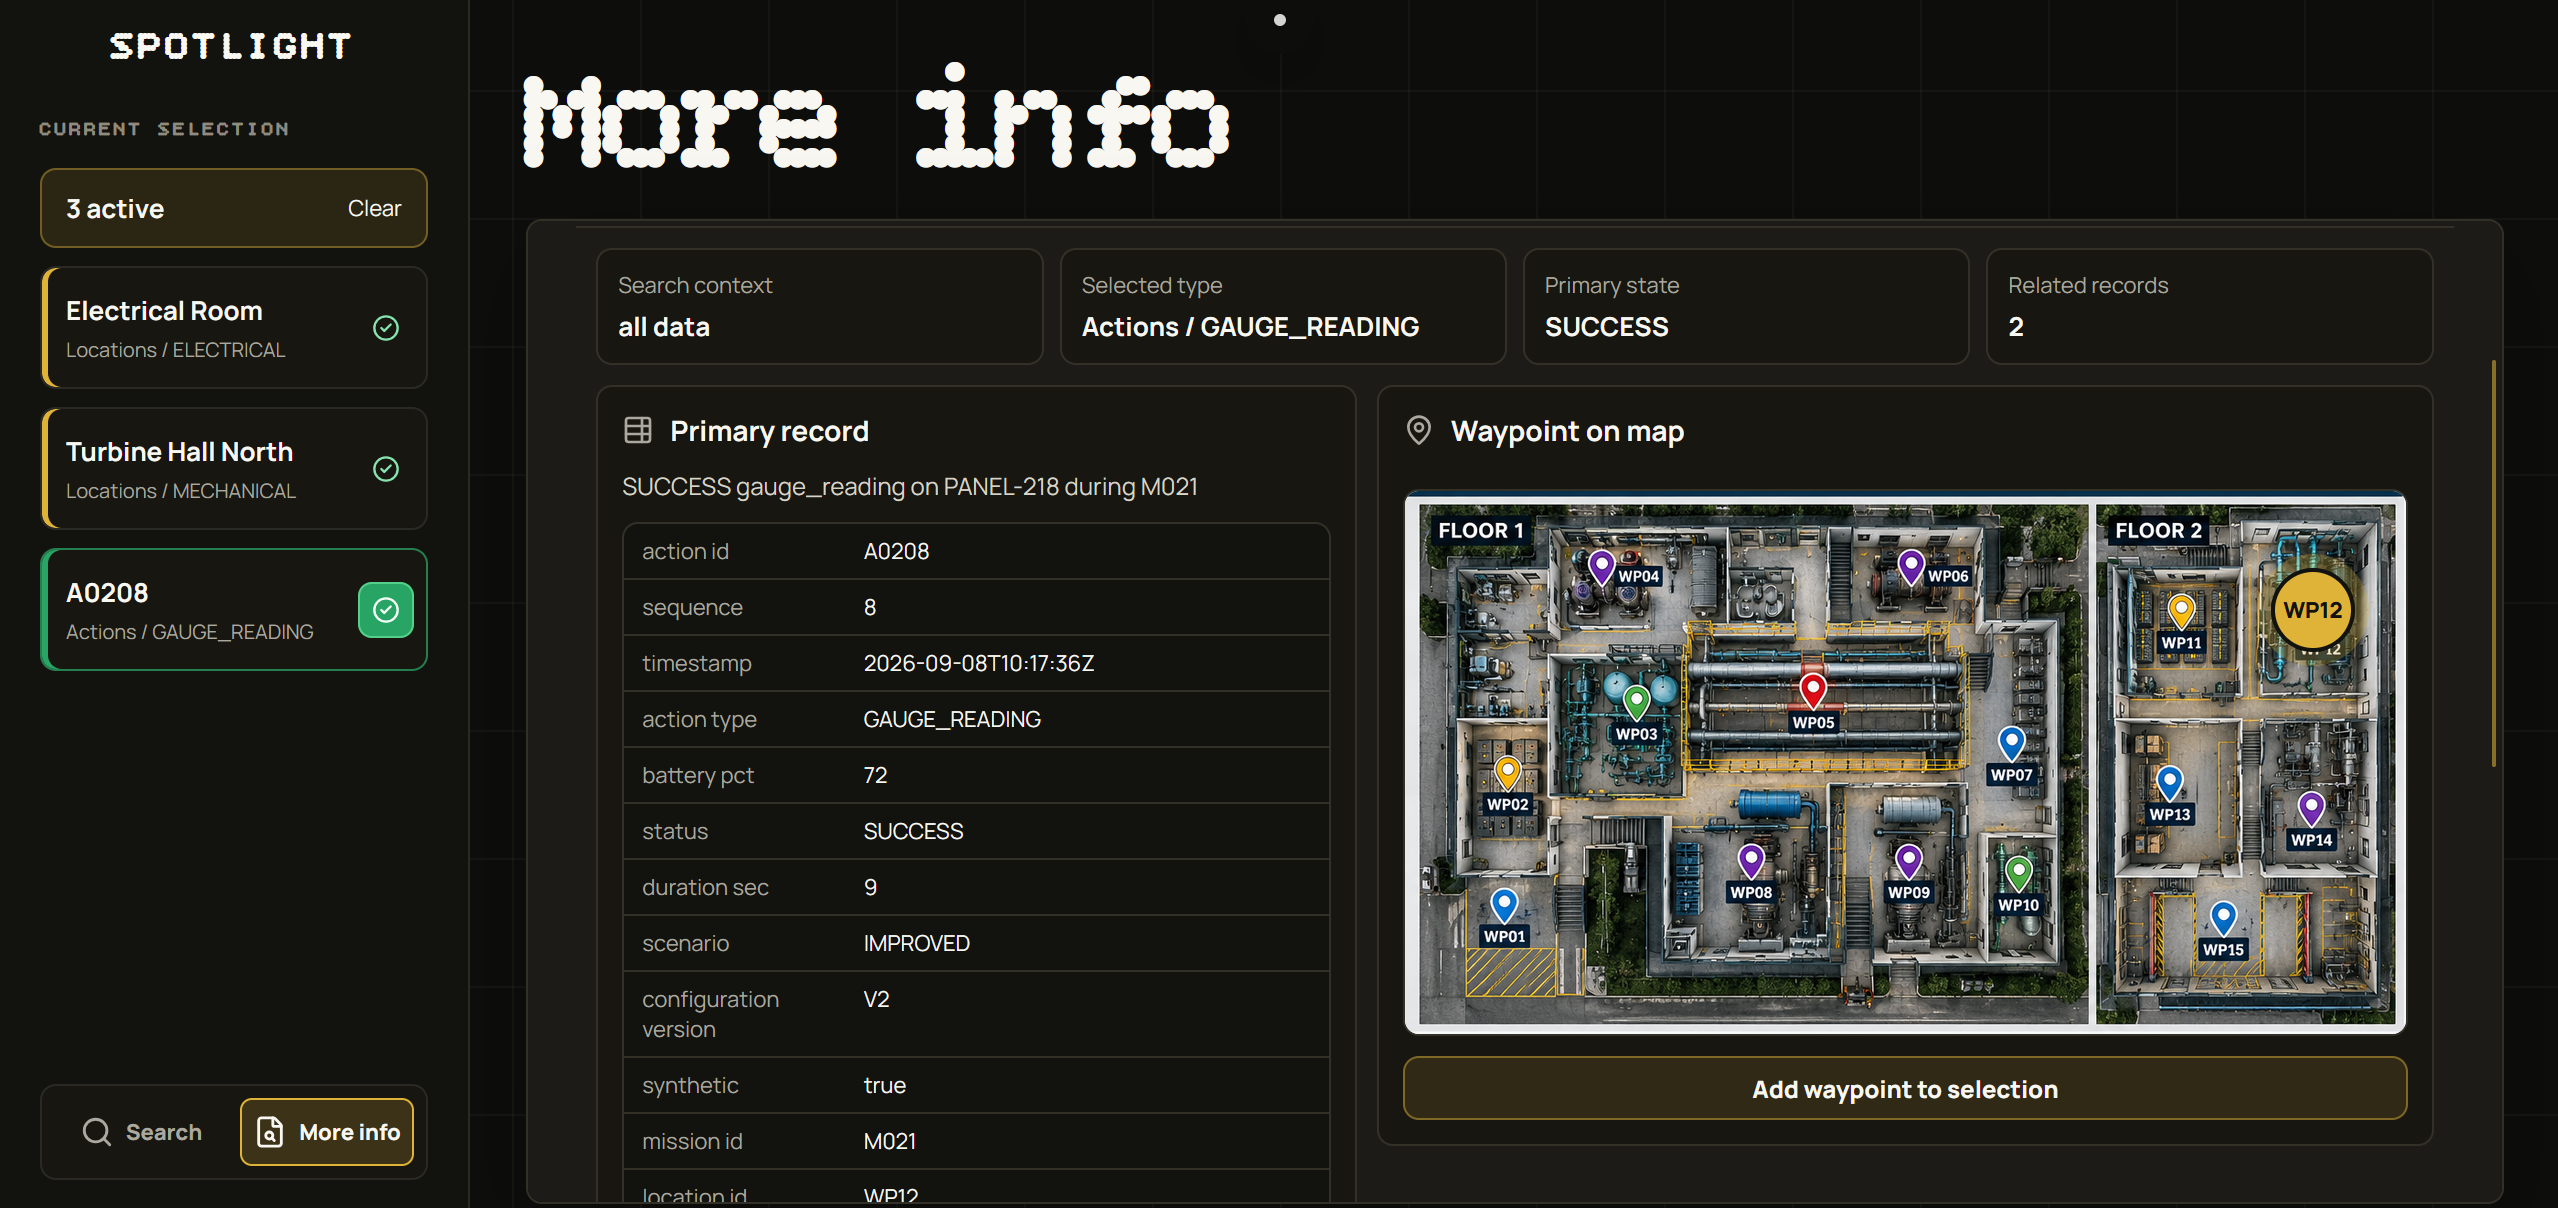
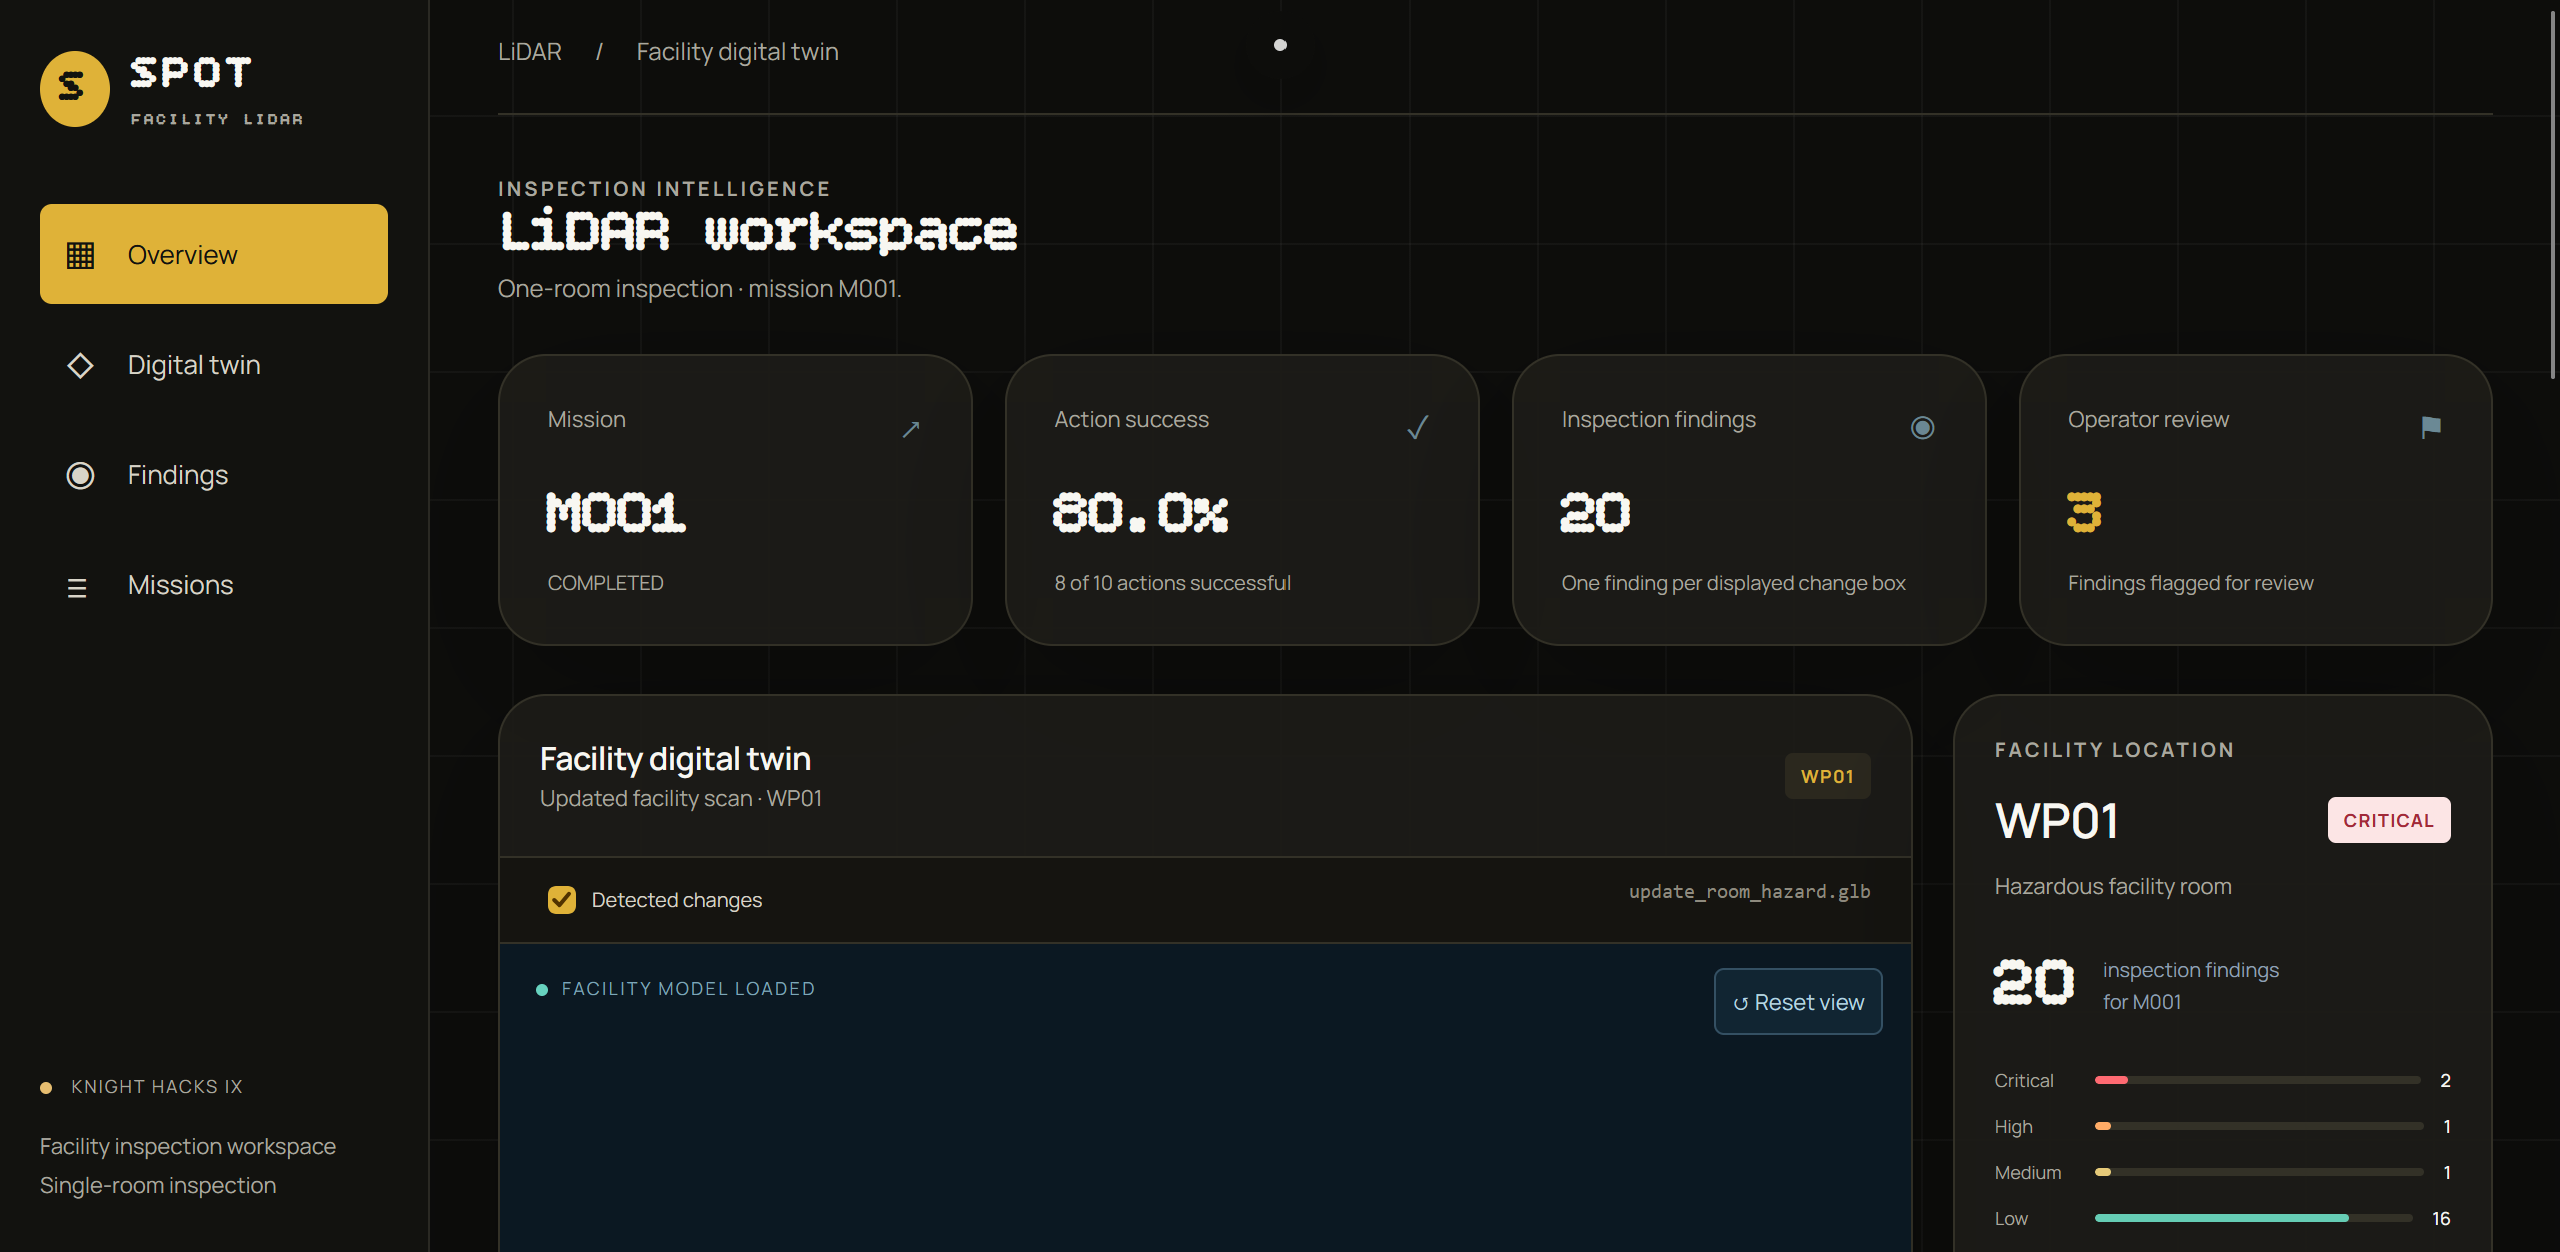
Spotlight is a facility inspection dashboard built around the synthetic SPOT dataset provided for the NextEra challenge. It connects inspection history with spatial context so users can explore what happened, where it happened, and which findings need review.
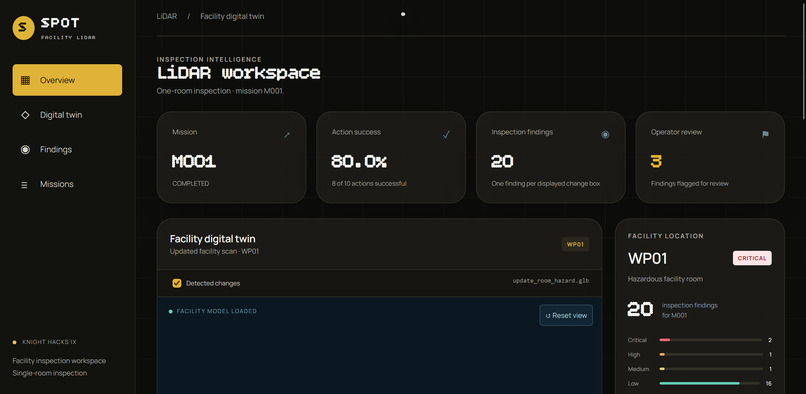
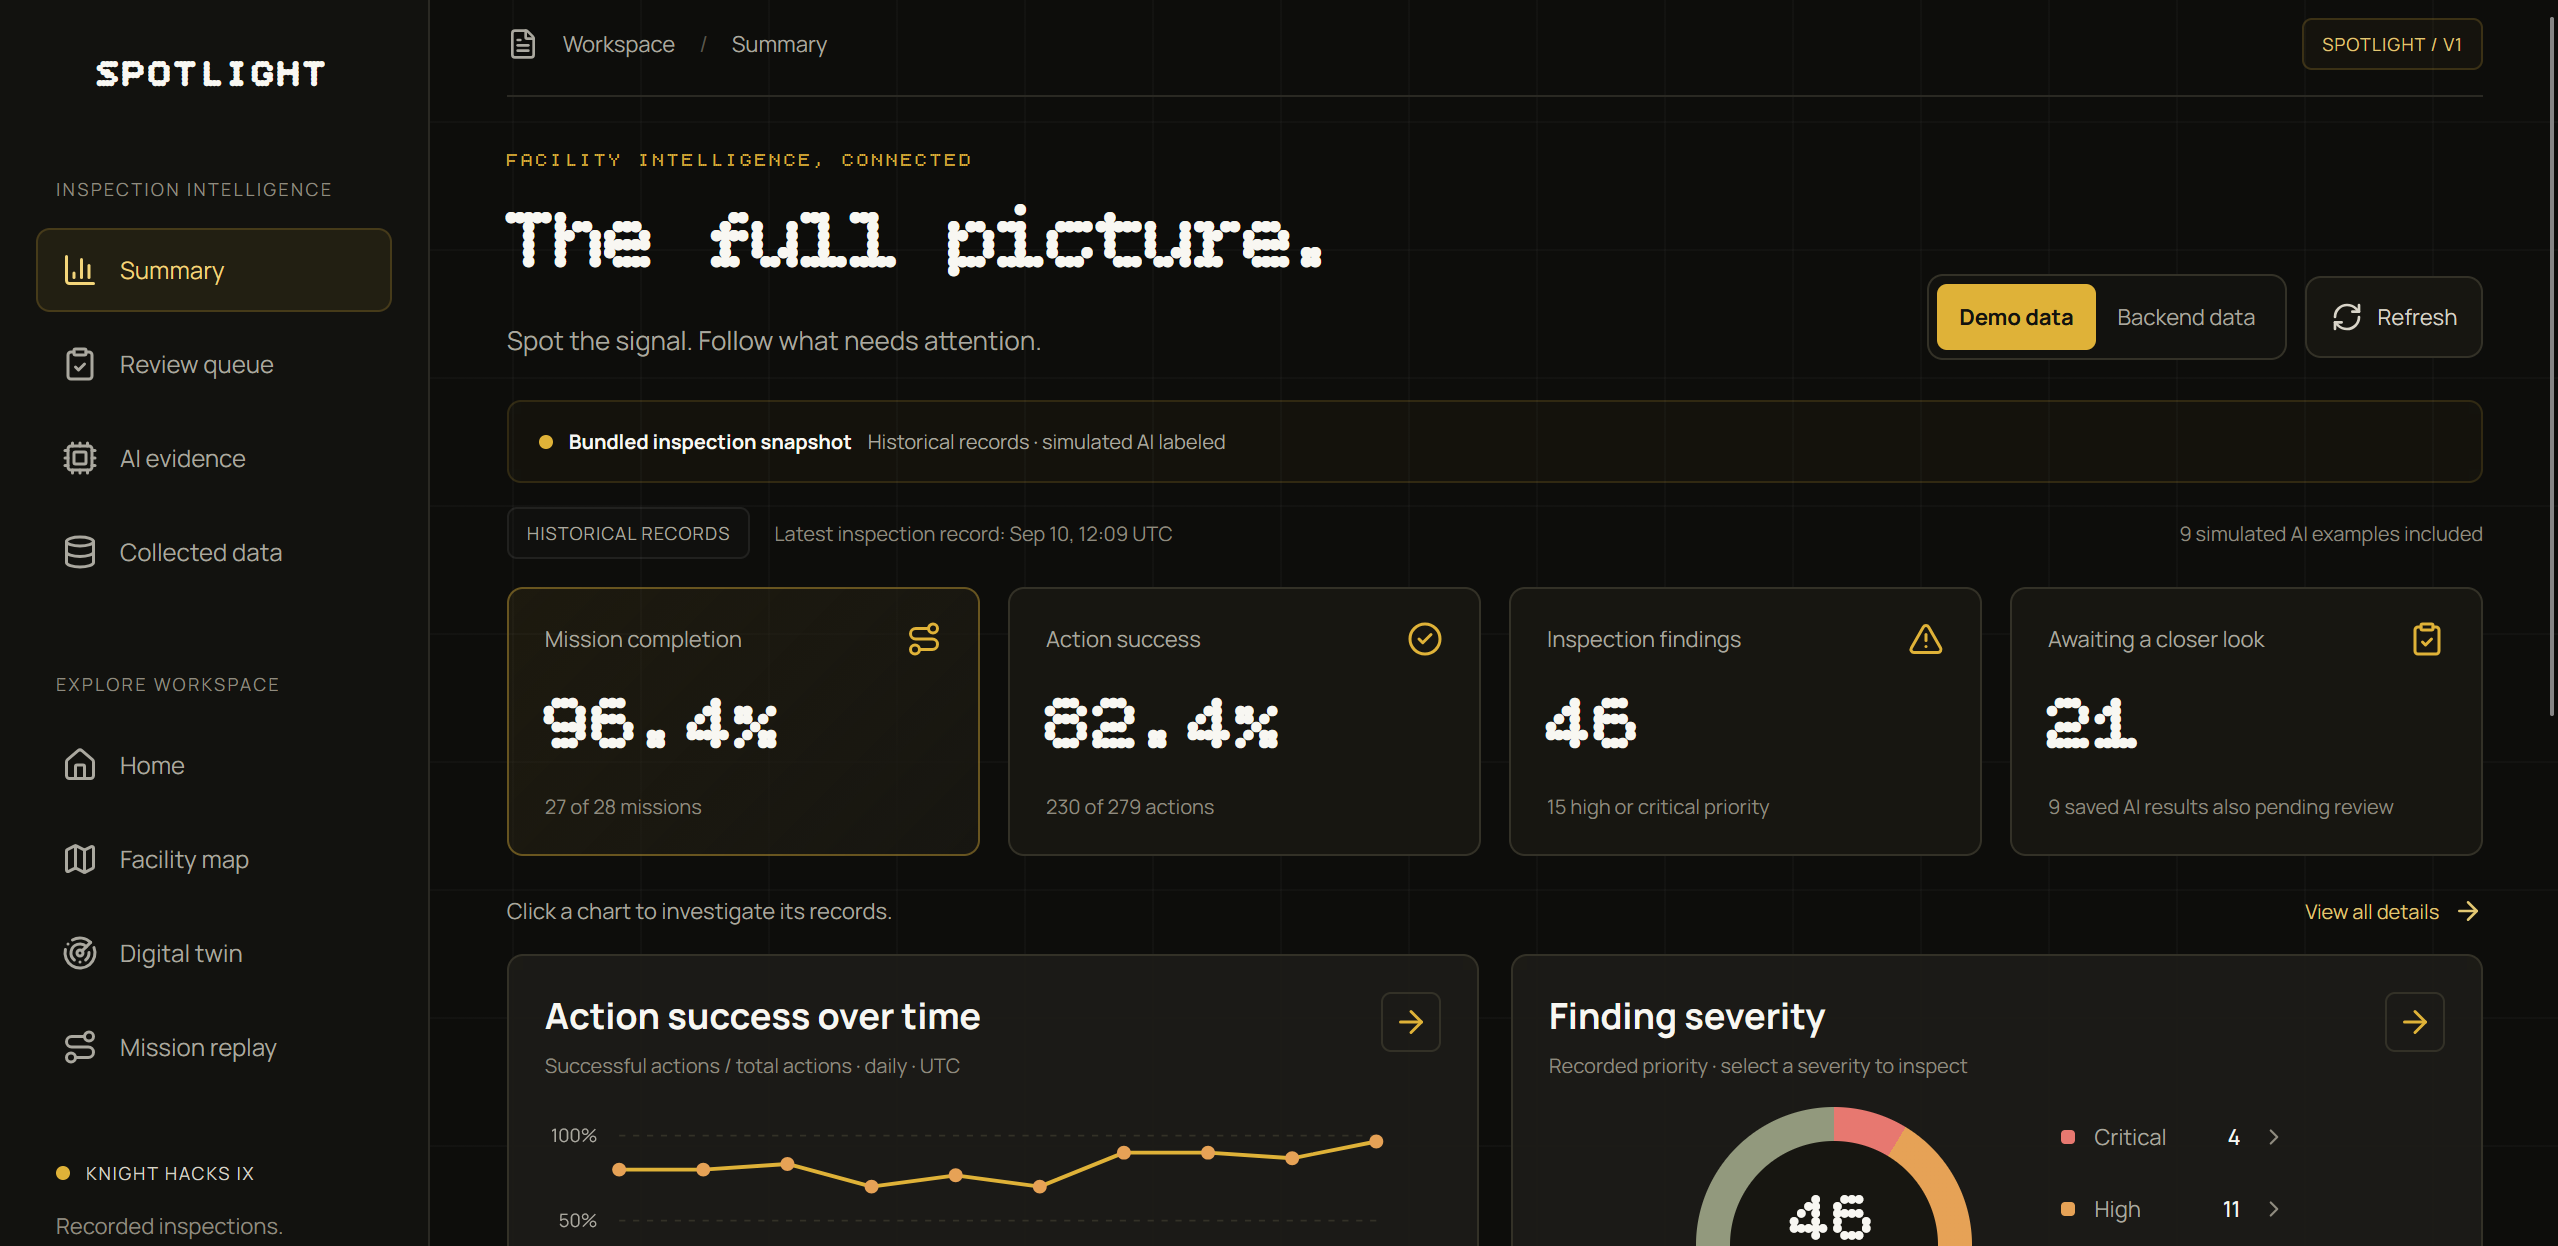
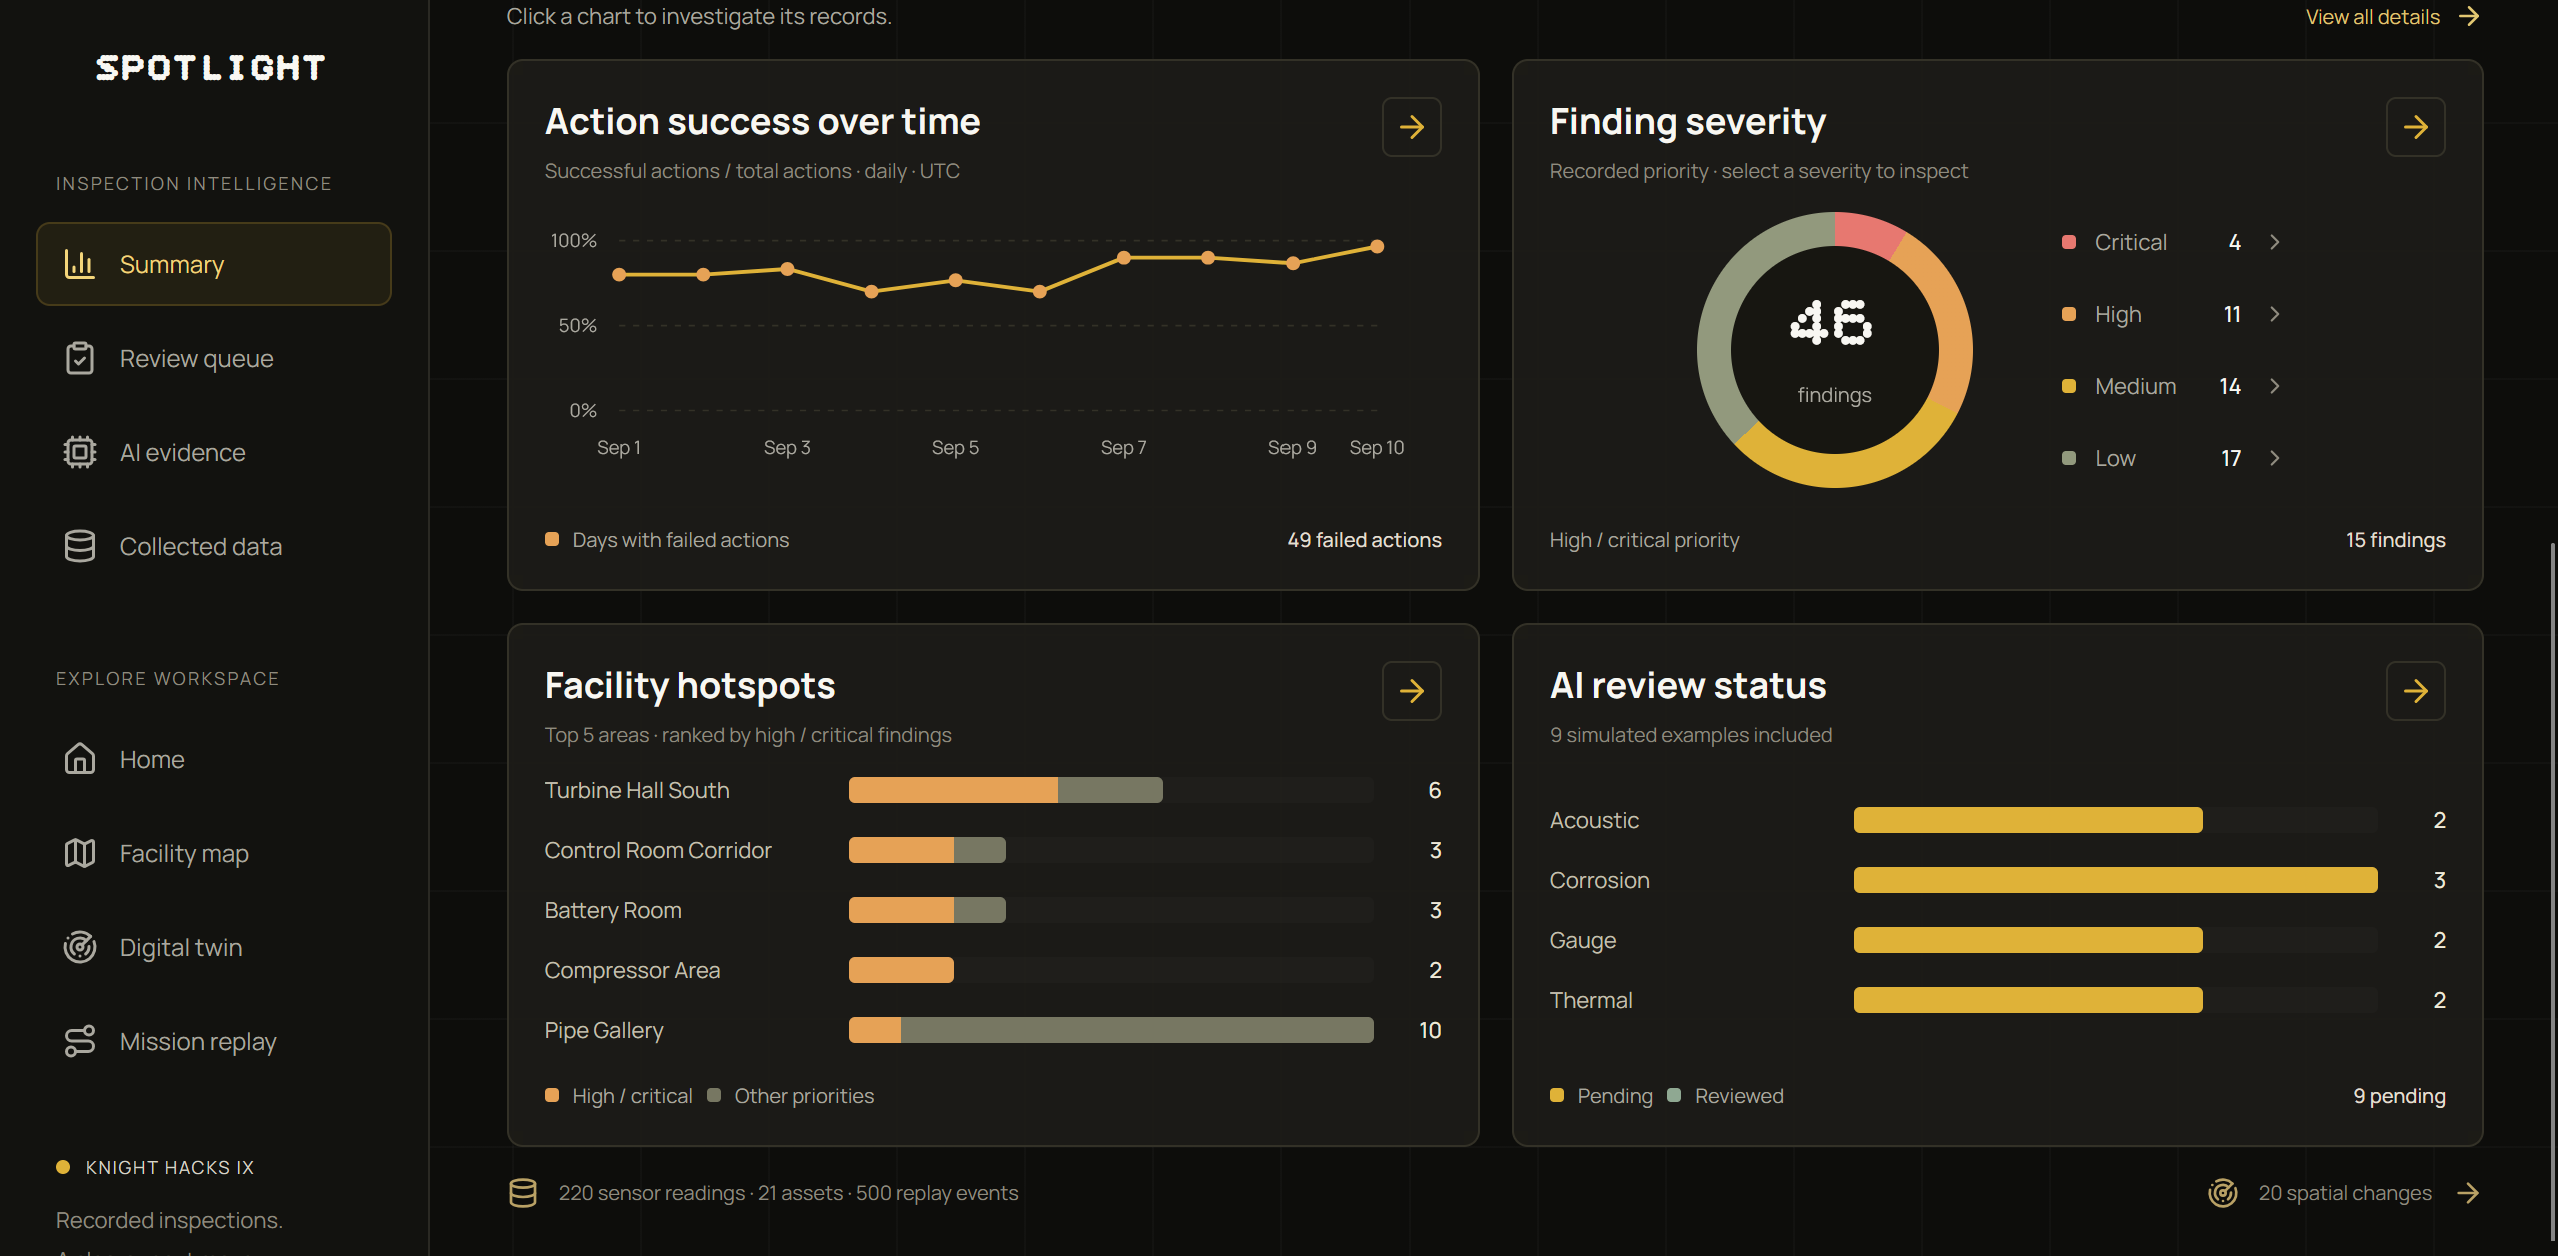
◝(ᵔᵕᵔ)◜ Mission overview: Compare mission completion, action outcomes, and inspection findings
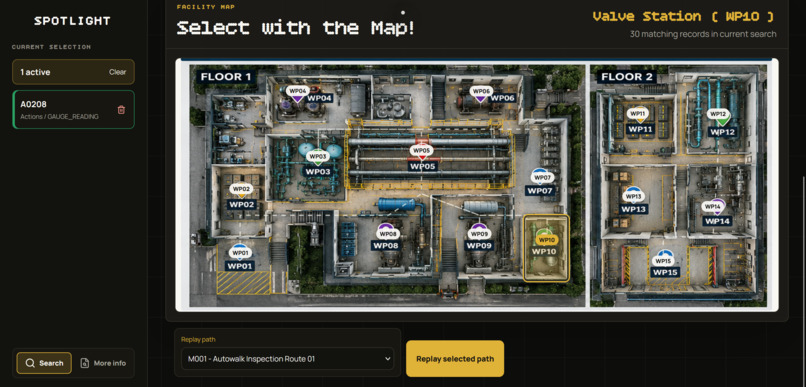
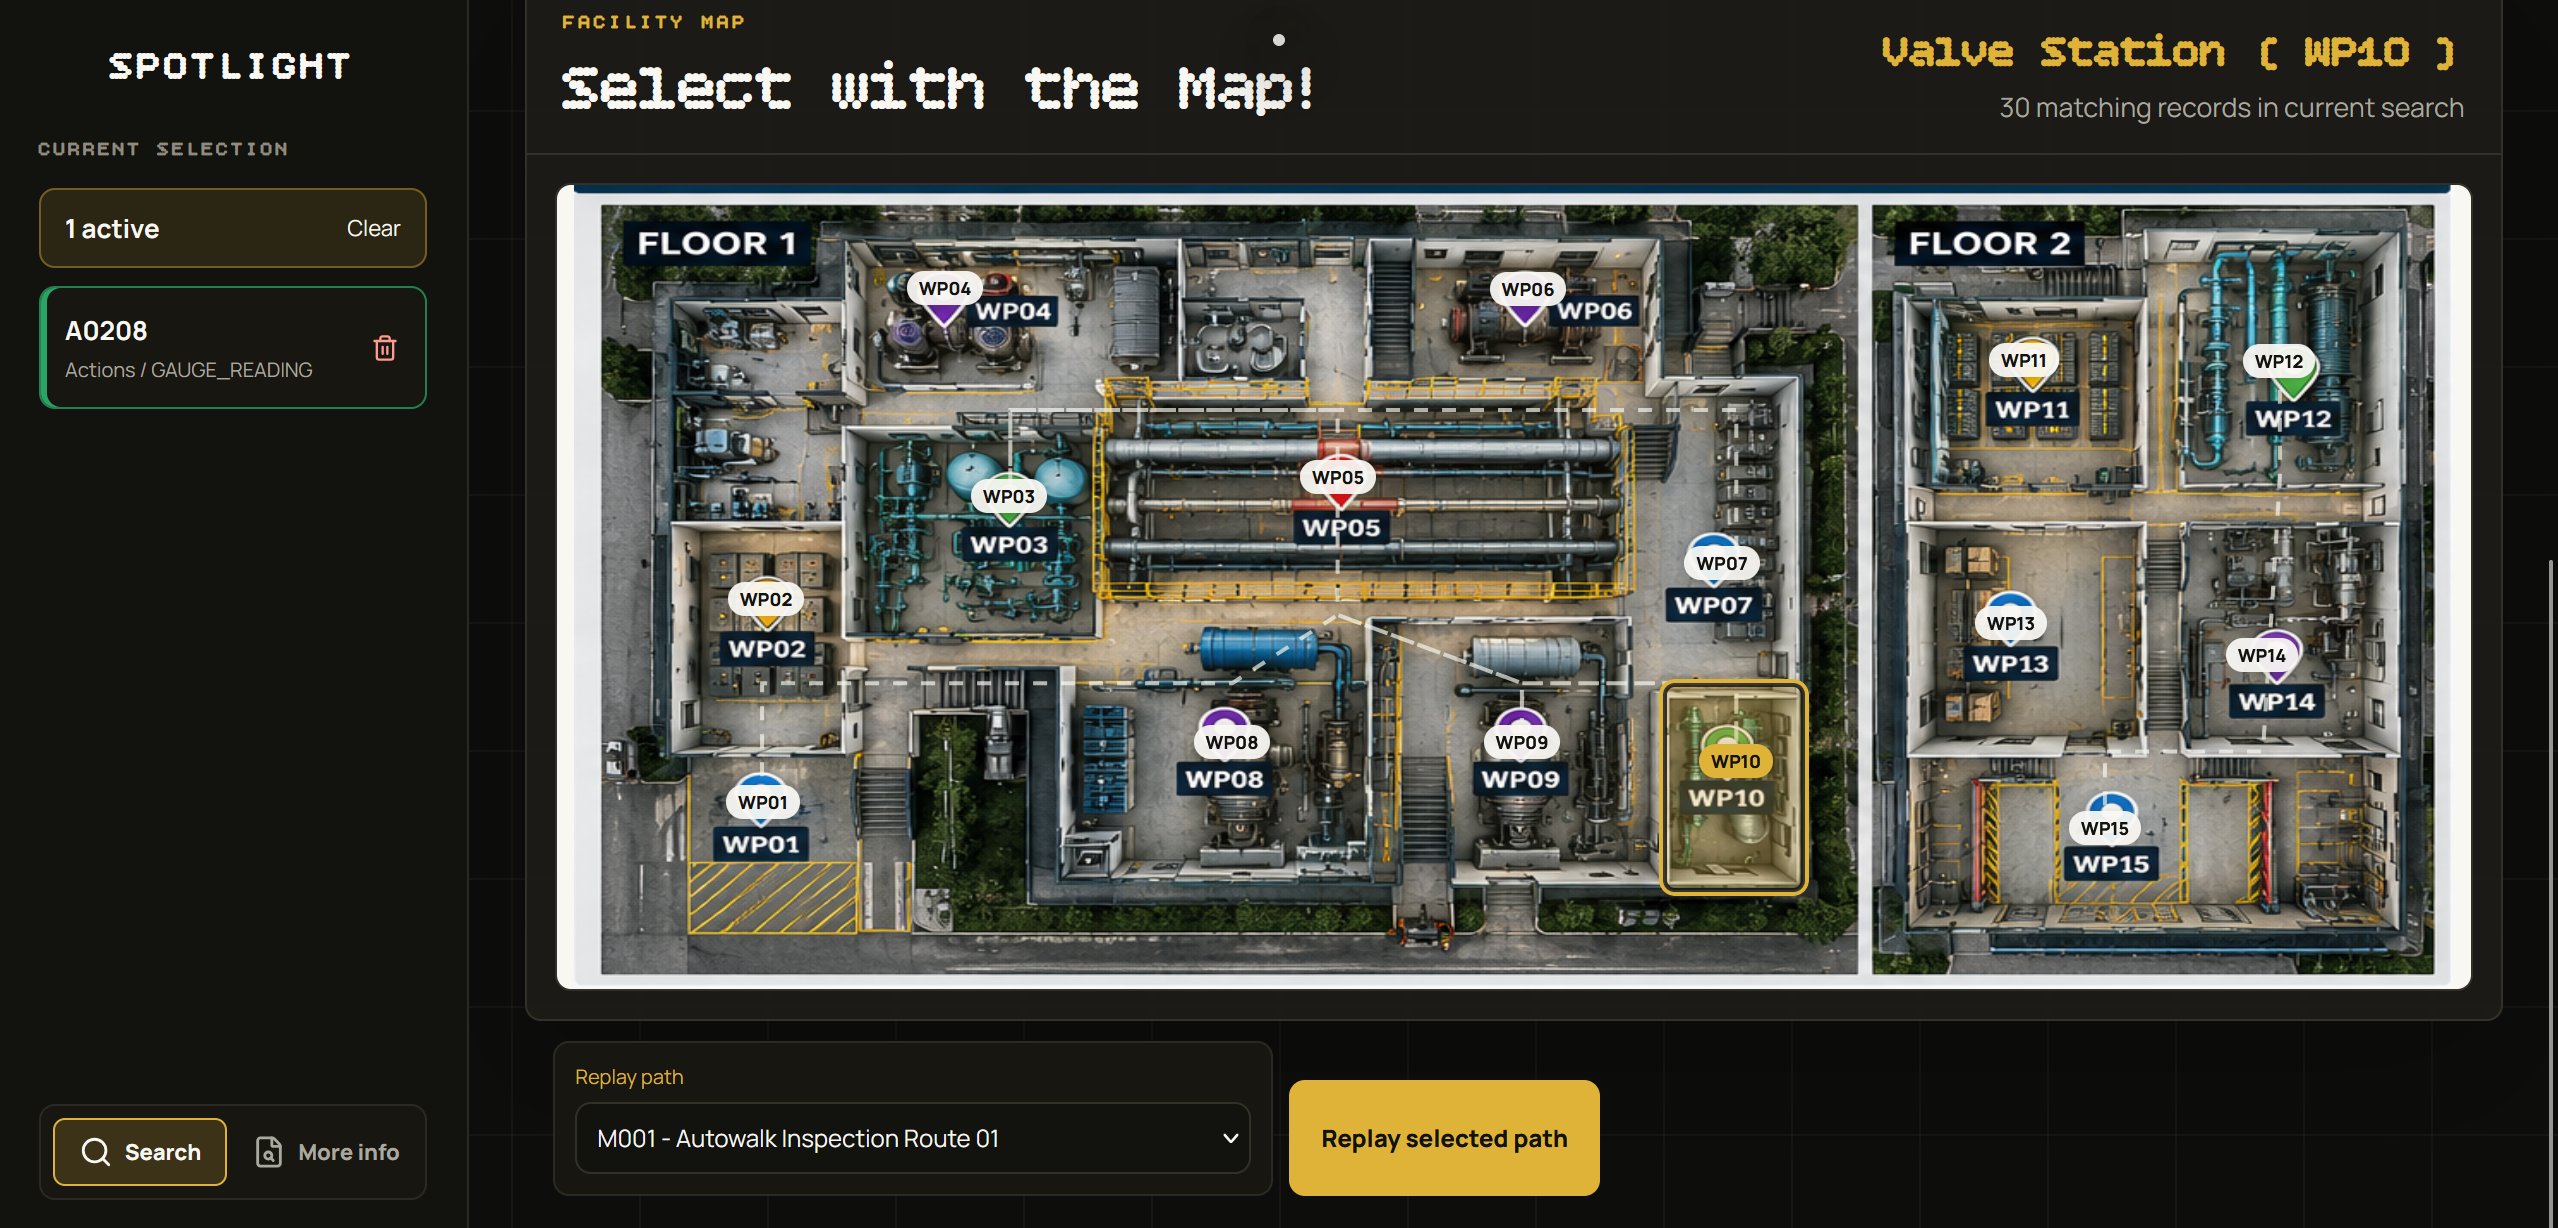
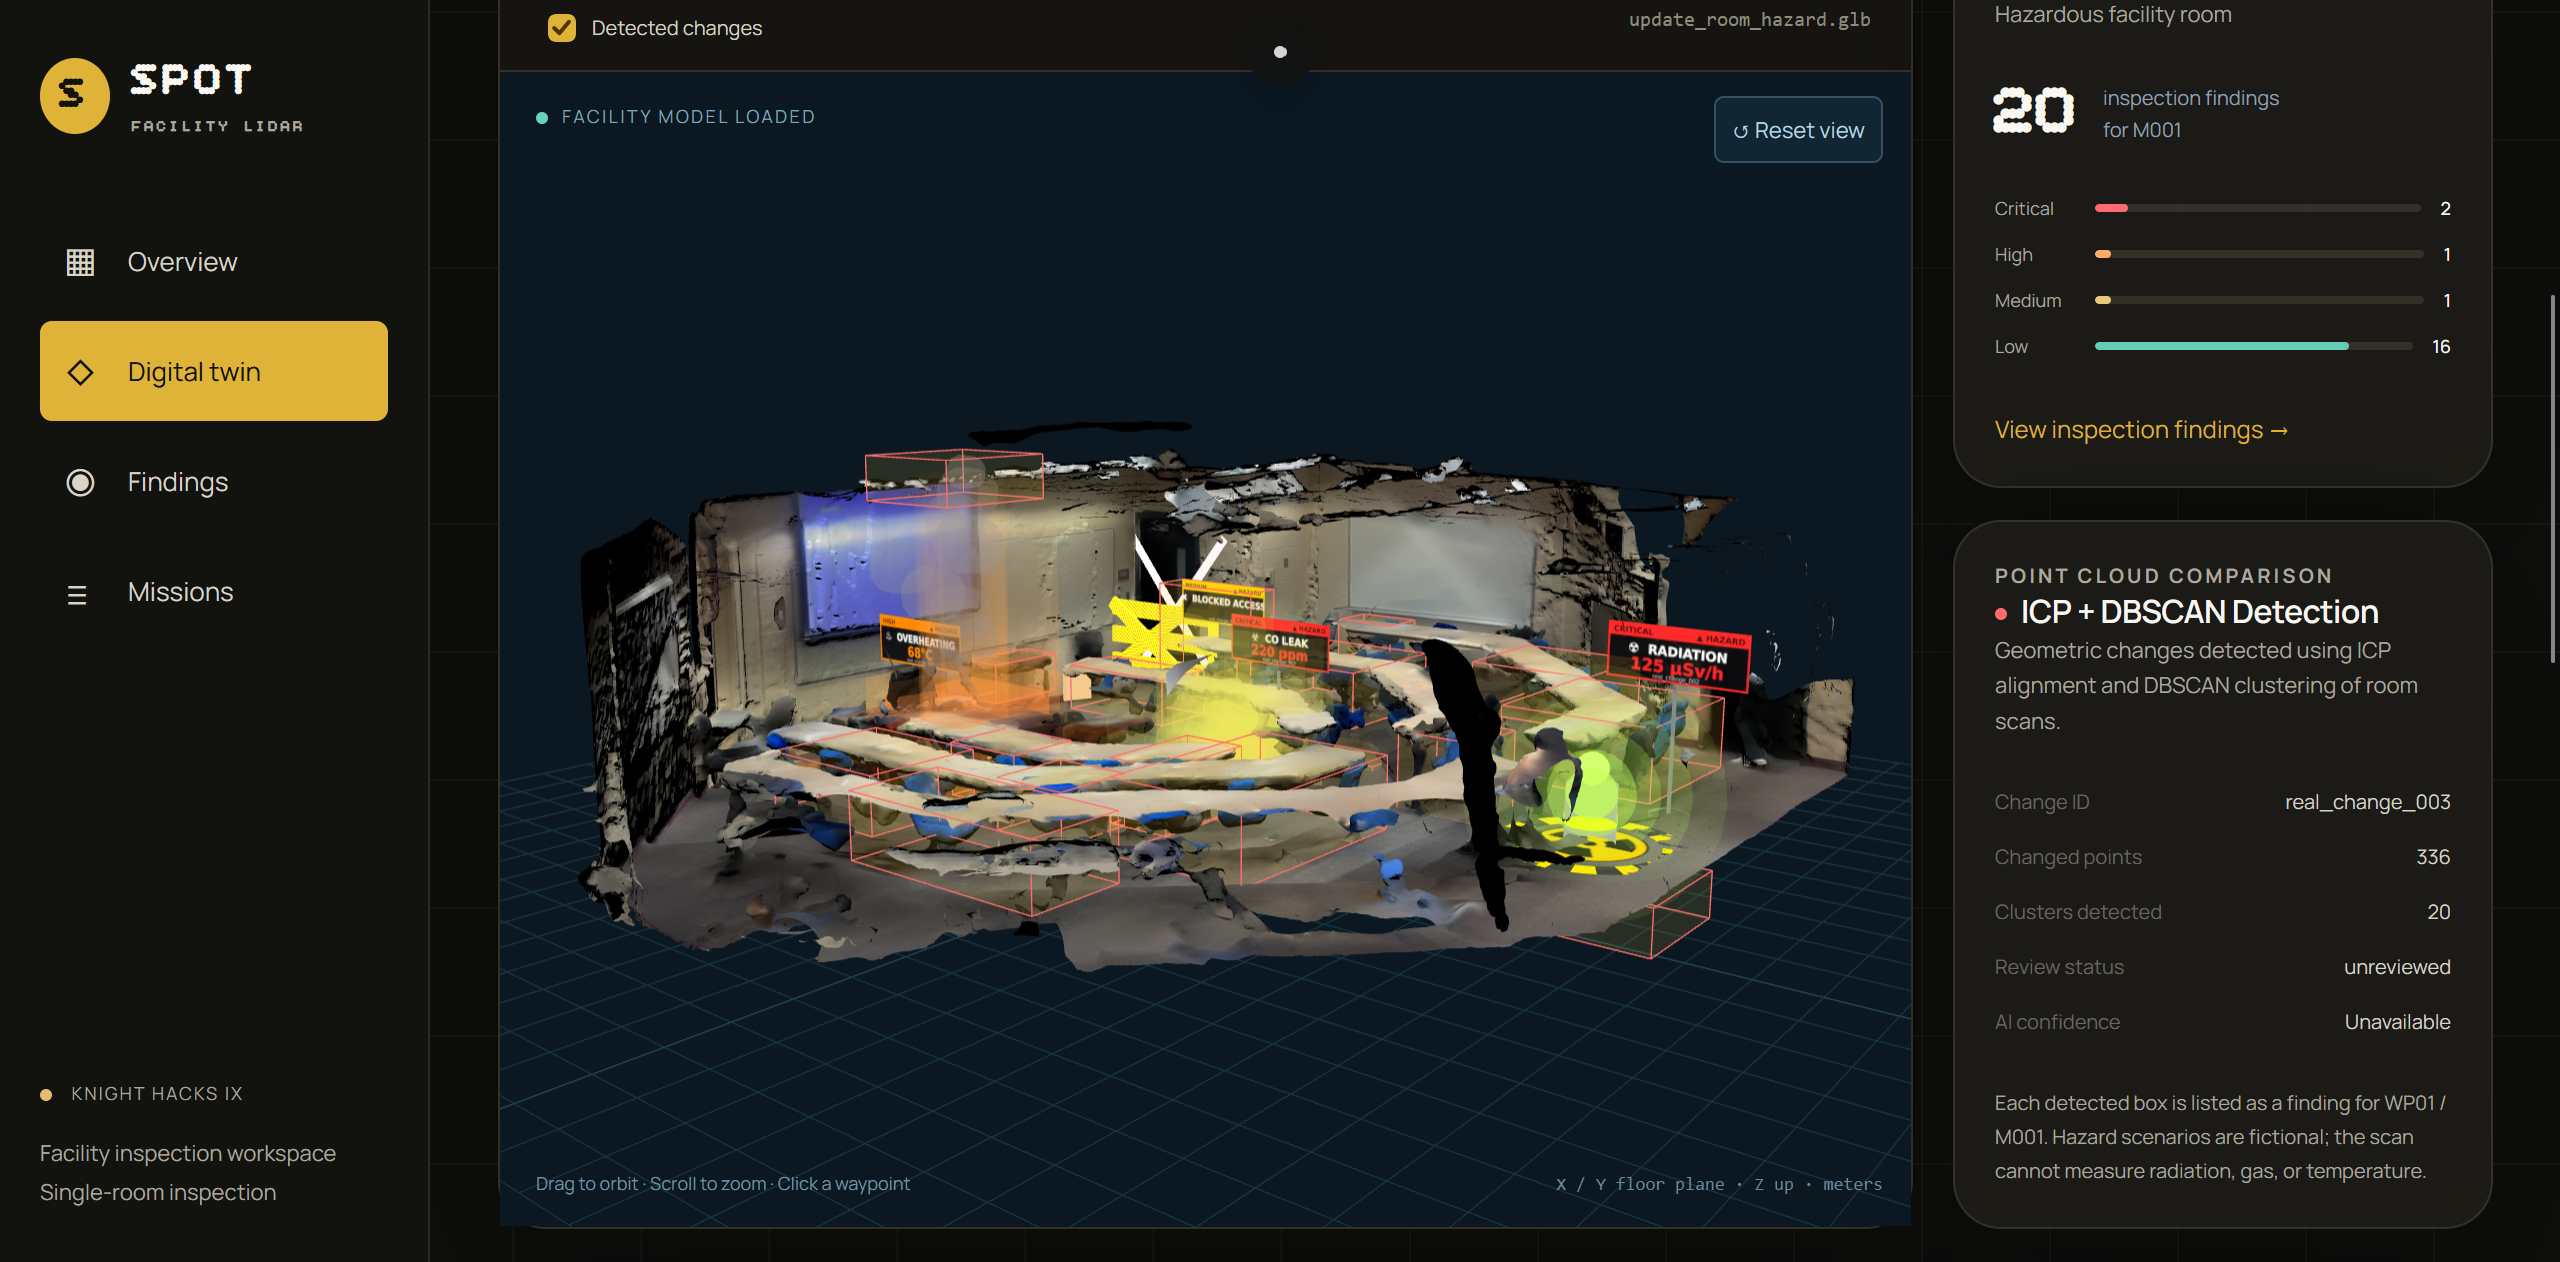
ヽ(°〇°)ノ Interactive digital twin: Explore a simulated facility, select waypoints, and view detected obstructions
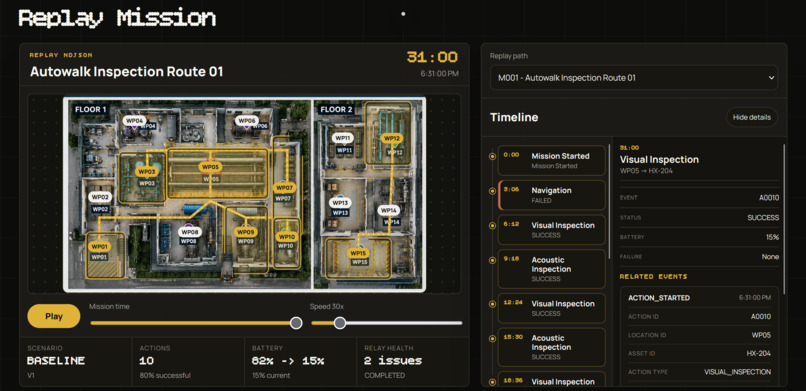
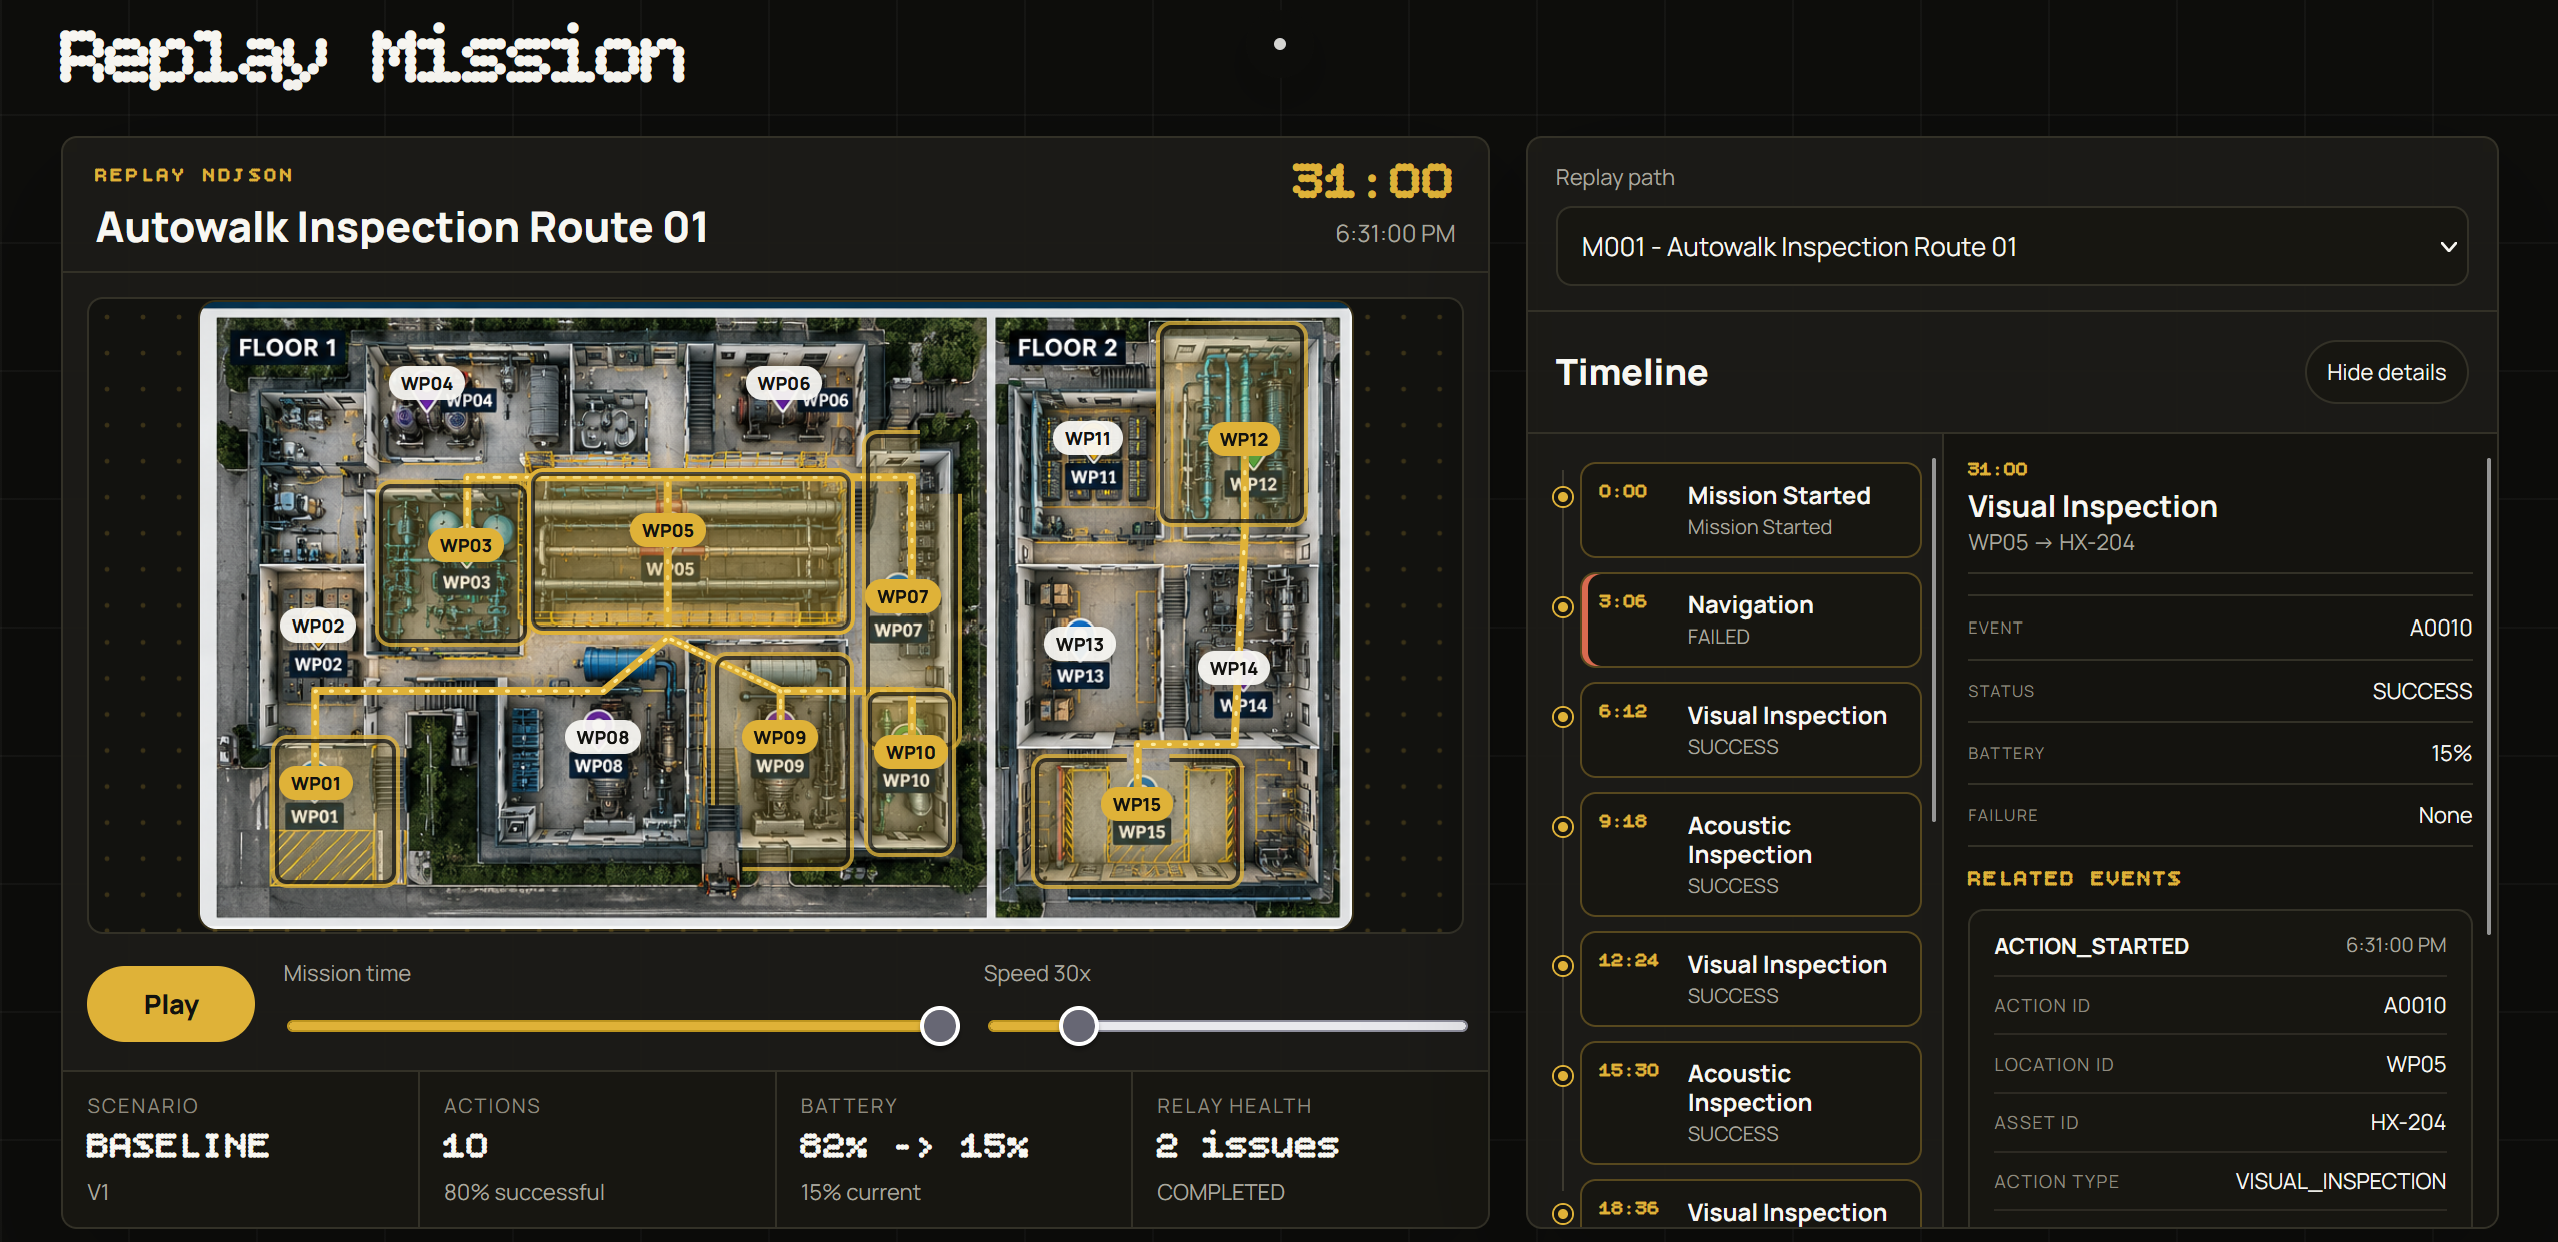
( ˶ˆᗜˆ˵ ) Mission replay: Play back recorded mission events and follow SPOT’s simulated movement
ヾ( ˃ᴗ˂ )◞ Machine learning support: Provide backend APIs for gauge detection, corrosion classification, thermal-image classification, and experimental acoustic analysis
How we built it
We connected the challenge’s missions, actions, readings, anomalies, assets, and locations so users could explore their relationships.
- React and TypeScript: Built the frontend dashboard
- Django REST Framework: Built the backend APIs
- PostgreSQL: Stores inspection records, replay events, and saved machine learning results
- Three.js: Displays the facility and its waypoints in the interactive digital twin
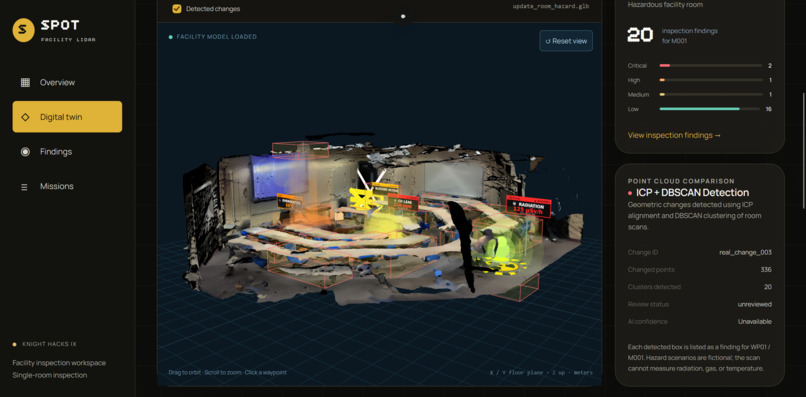
- LiDAR pipeline: Aligns point clouds, identifies changes, and groups those changes into possible obstructions
- AMD AI compute: Used to train machine learning models during development
- Vultr: Hosts the application
- GoDaddy Registry: Provides the .select extension for our domain, getspotlight.select
- Figma Make: Used to prototype the landing page design (https://www.figma.com/make/5Z1YxDxupKTOJfeXlDxnwi/Build-landing-page?t=TlUPTTC4zESwkR8W-1&desktop-link-click-timestamp=1791730157546&desktop-ul-exp-bucket=po)
Challenges we ran into
One of our biggest challenges was understanding what an operator would need from the inspection data. We had to translate NextEra Energy’s challenge into features that could help someone understand mission outcomes, investigate findings, and decide what needs attention.
We also had to connect different kinds of data while keeping their meaning consistent. Understanding how missions, actions, readings, and findings related to each other helped us bring that information into the dashboard.
We worked through LiDAR alignment, deployment, and merge conflicts as different parts of the project came together. Keeping everyone’s features working while maintaining a cohesive design took communication and iteration.
Accomplishments that we're proud of
We are proud of bringing our separate contributions into one working project. Seeing the dashboard, mission replay, and digital twin come together made the inspection data feel much easier to understand.
We also built a backend that can store and organize inspection records alongside machine learning results. Together, these features helped us address the challenge’s goal of making relationships in the data easier to explore.
What we learned
We learned how much work goes into connecting a full-stack application beyond building its individual pieces. Data relationships, API contracts, deployment, and collaboration all shaped how the final project came together.
We also learned that sleep is important. It is easy to keep pushing during a hackathon, but taking a break helps us think more clearly, catch mistakes, and work better together. (- - )💤
What's next for spotlight
As we continue developing the project, we would like to improve our models, test them on more representative data, and keep refining the interface.


Log in or sign up for Devpost to join the conversation.