-

Landing page for the site
-
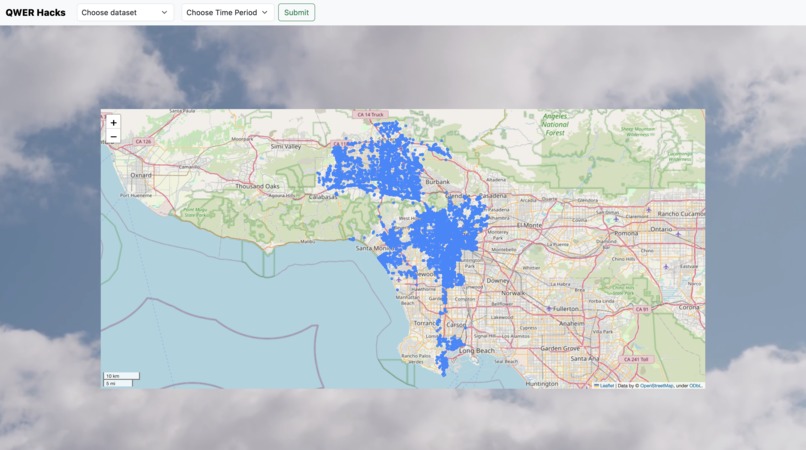
Sample of the interactive map

Inspiration
Police violently engage with houseless folks in LA, evicting them and destroying their possessions. Unhoused LGBTQ+ people are disproportionately at risk of police violence, especially Black folks, as well as others who are marginalized in multiple ways. There already exists “crime trackers” that purport to create safer neighborhoods by documenting criminalized activity. We turn the idea on its head by tracking police presence, for the benefit of individuals who are disproportionately at risk of harm from police contact.
What it does
This web app maps two components:
- Areas where police have been called to investigate homeless encampments – through recorded LA city data
- Current police presence – through a photo text-in service
How we built it
Front end We used bootstrap CSS, html and geopandas for map visualization
Back end Mapping: dataframes
Text service:
- Receives text messages through Twilio
- Convolutional neural network classifier with PyTorch to verify submitted photos as police/not police
Challenges we ran into
We ran into many challenges over the course of this project:
- connecting sms messaging into web app
- integrating neural network model into web app
- generating interactive map
- having to move between languages and therefore sorting out the dependencies
- plotting data
- data consistency
- sourcing data of police interactions
- generating training data for the classification model (we didn't end up to being able to scrape enough police image data in the time frame to train a model, so we used a generic dataset)
- creating an application that seemly combines all these features
What we learned
- Graphic design
- Inventing and using fake phone numbers
- Separating of concerns in different branches
- Learning how to make a model using tensorflow and pytorch and integrating it with a functional app
- Jumping between learning new things and using old skills to make something functional
Accomplishments that we're proud of
We are proud of the challenges we overcame and the things we learnt.
What's next for Spotlight
- Scale up to include other cities
- Fine tune mapping of data
- Improve classifier by training on police pic data (as for the point of demo is car/not car)
- Combine the data we have with housing cost data and public transport on the map
- Track police activity more broadly

Log in or sign up for Devpost to join the conversation.