-

0 - The Spotify Slug Logo...this is Todd!
-
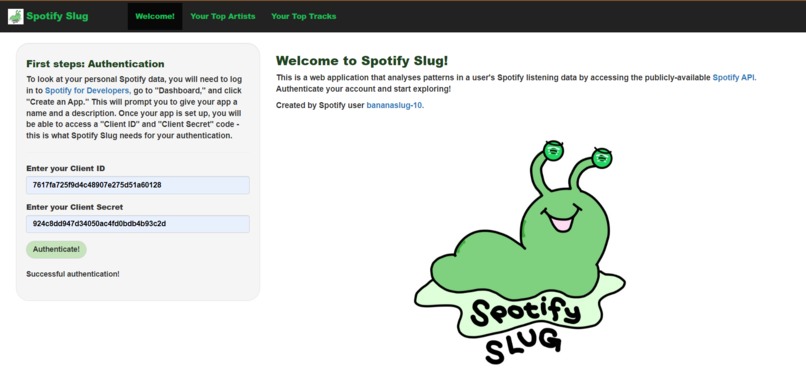
1 - Introduction and Authentication Page
-
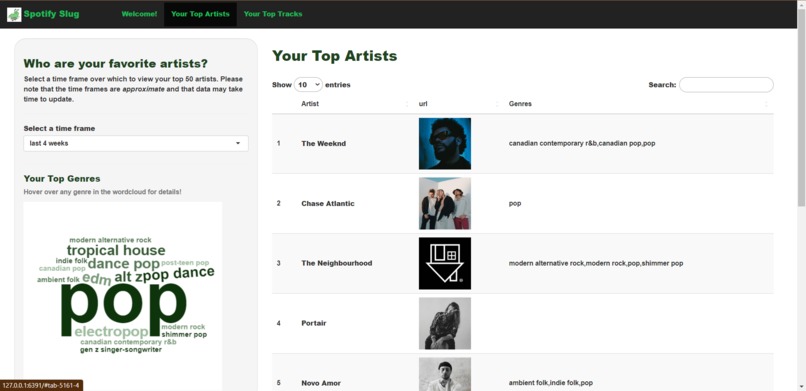
2 - Top Artists
-
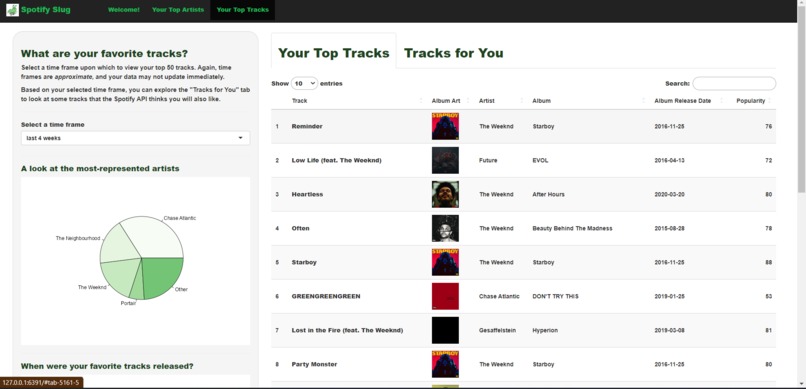
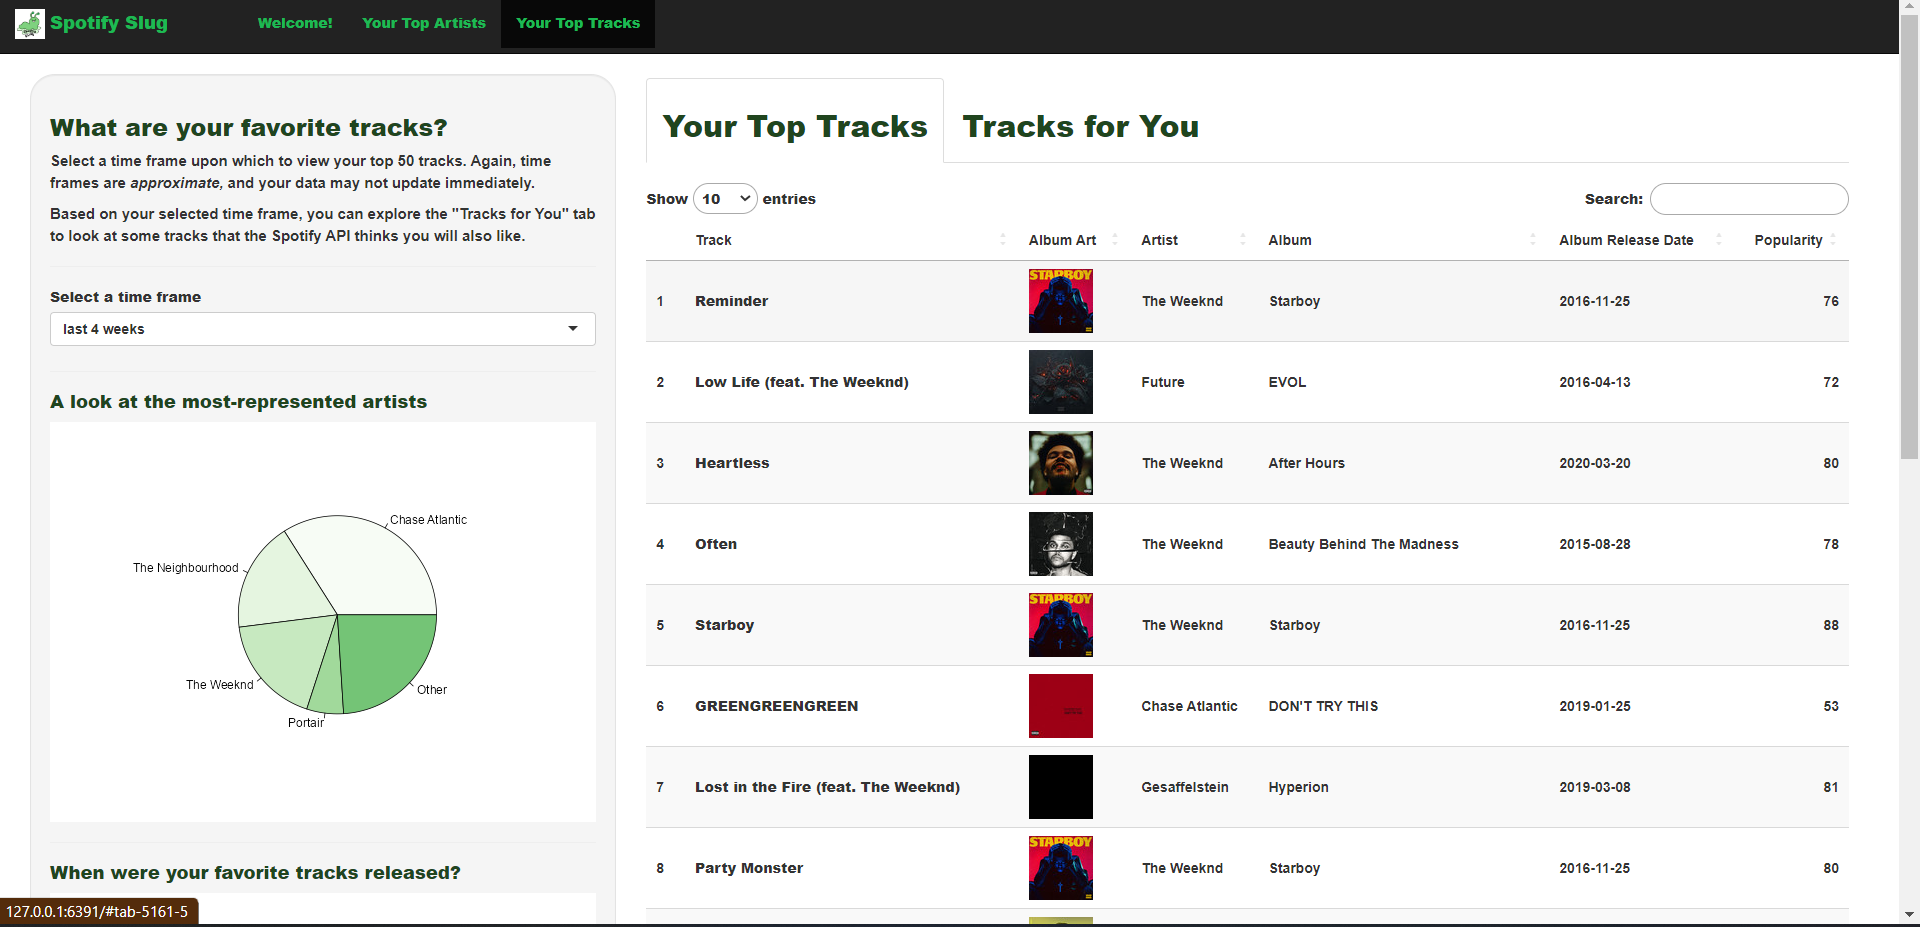
3 - Top Tracks, Recommended Tracks
-
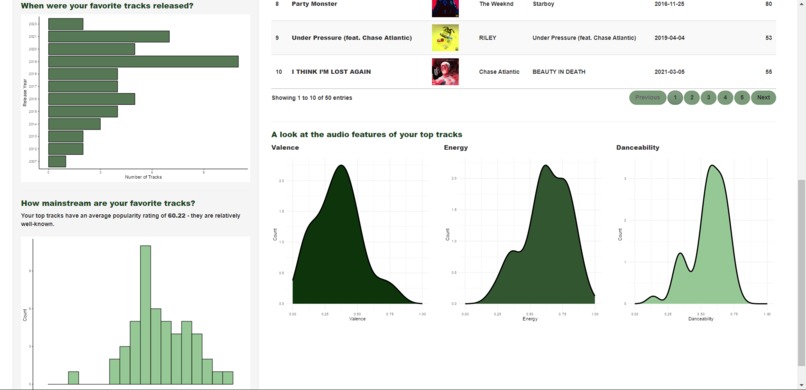
4 - Dynamic plots


Inspiration
I, like many fellow Spotify users, really enjoy looking at my own listening habits and statistics - I find it interesting to see how often I change my tastes. However, I got tired of the same old sites that I used to do this task, so I decided to harness the Spotify API and make my own web application...welcome to Spotify Slug, created by Spotify user bananaslug-10 with lots of love and hard work.
What it does
Spotify Slug is a dynamic web application that aims to curate an interactive and visual experience for users who hope to gain insight into their listening habits. Users can view their top artists and top tracks over three different time frames, and explore the audio features, popularity, and release years of their favorite tracks, and a distribution of the genres represented in their favorite artists. Additionally, a tab is provided to recommend users to new tracks based on their most-played tracks.
How I built it
Spotify Slug was built entirely using R and R Shiny, as well as several other packages that facilitate graphing and enhance visuals (ggplot2, wordcloud2, tidyverse, DT). The R package spotifyr was used to access the Spotify API.
Challenges we ran into
Since this was my first time working with an API in-depth, I found this project quite difficult and time-consuming, and I wasn't able to get as much done as I had initially hoped to.
What I learned and accomplishments
I'm really happy to have participated in this hackathon, and I'm glad that I took the initiative to challenge myself despite being a newer programmer.
What's next for Spotify Slug
I intend to add more functionalities, and possibly add a tab that allows for users to explore similar artists to their top artists.

Log in or sign up for Devpost to join the conversation.